. 2015 May 19;112(20):6479-84.
doi: 10.1073/pnas.1420885112. Epub 2015 May 5.

Activity-dependent, homeostatic regulation of neurotransmitter release from auditory nerve fibers

Affiliations

Activity-dependent, homeostatic regulation of neurotransmitter release from auditory nerve fibers

Tenzin Ngodup et al. Proc Natl Acad Sci U S A. .

Abstract

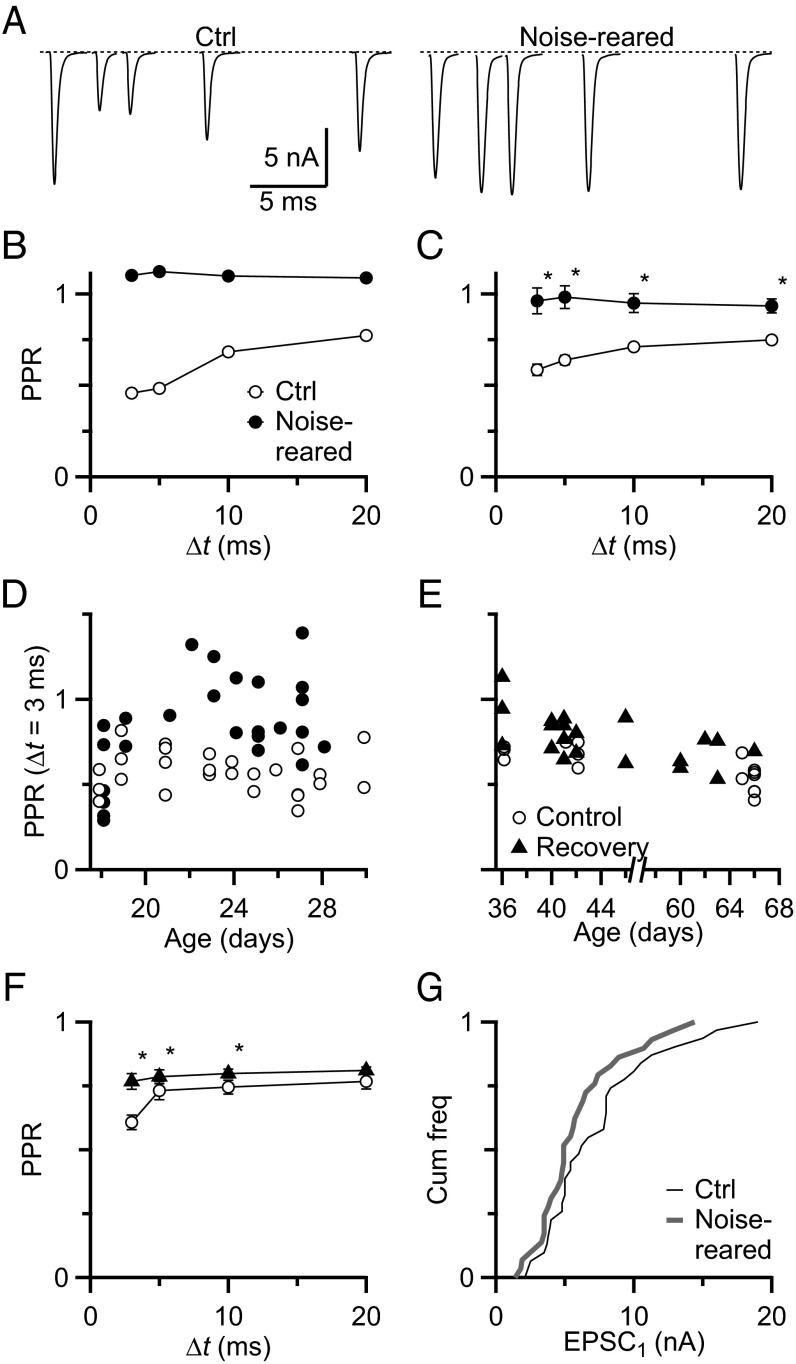
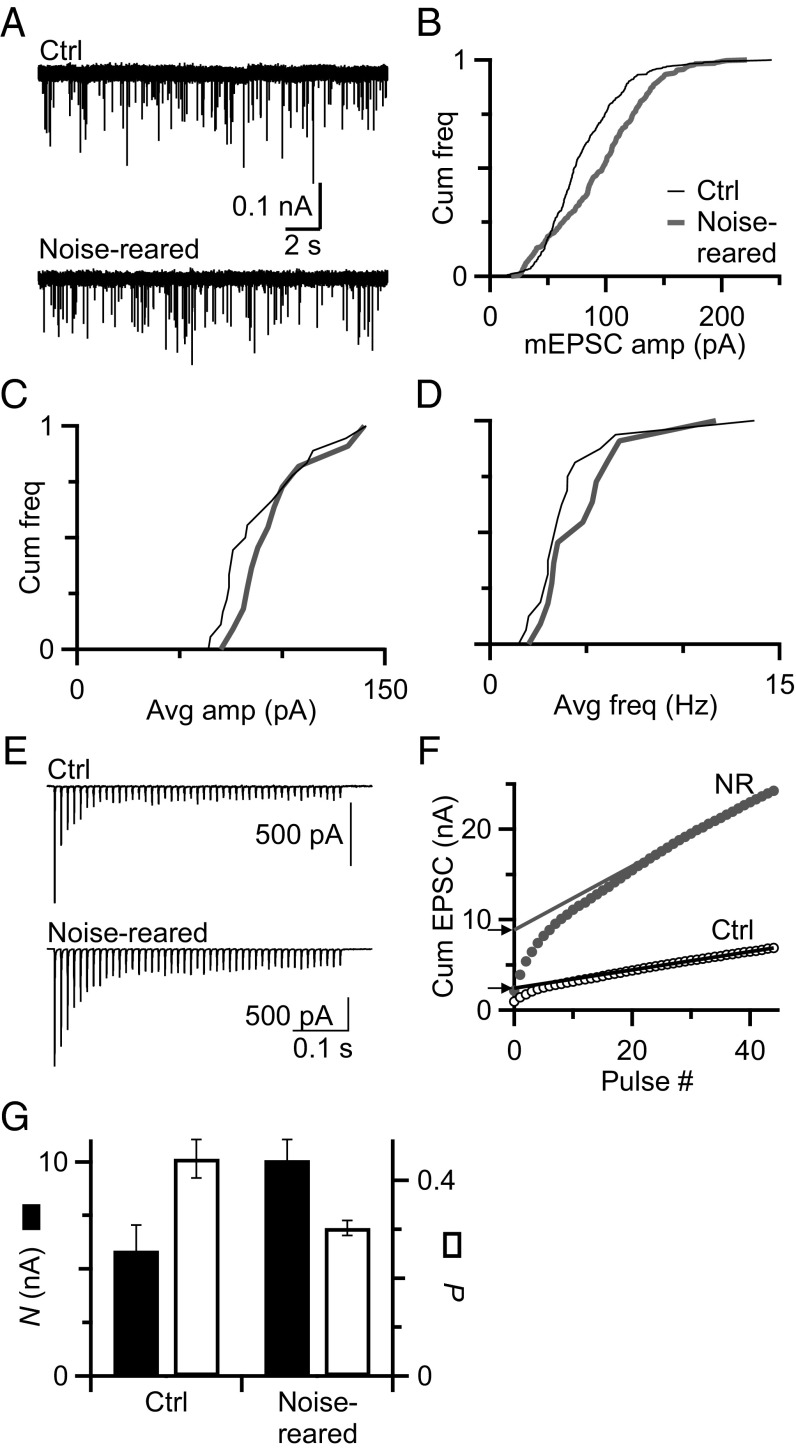
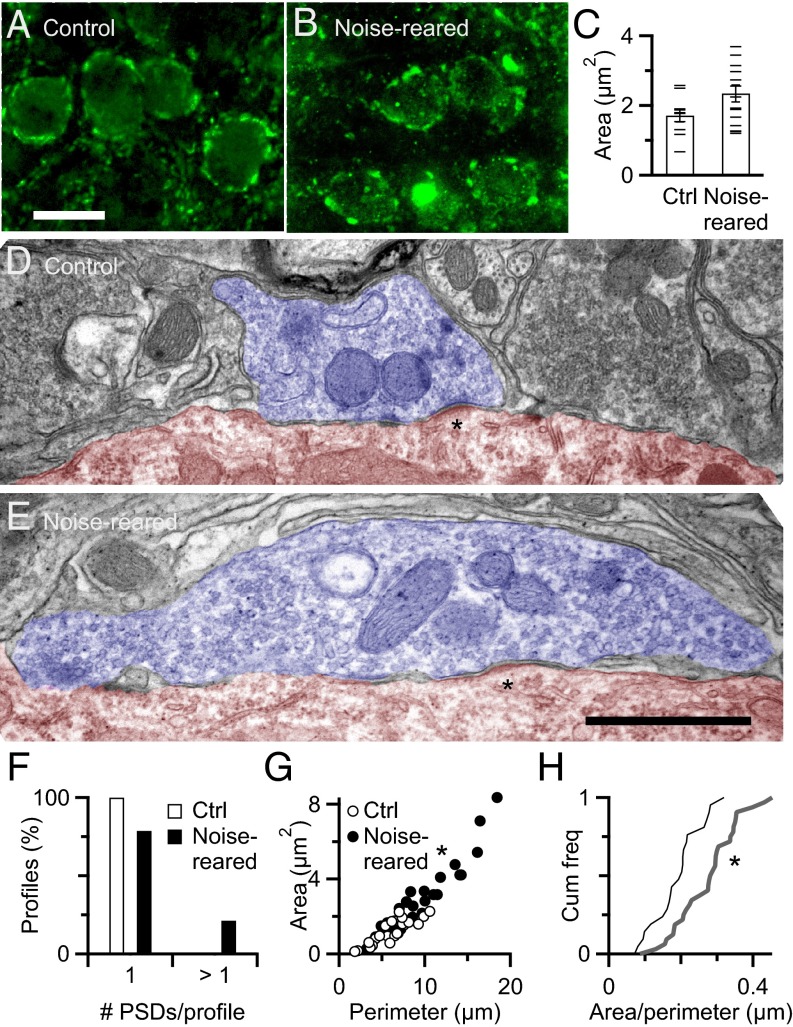
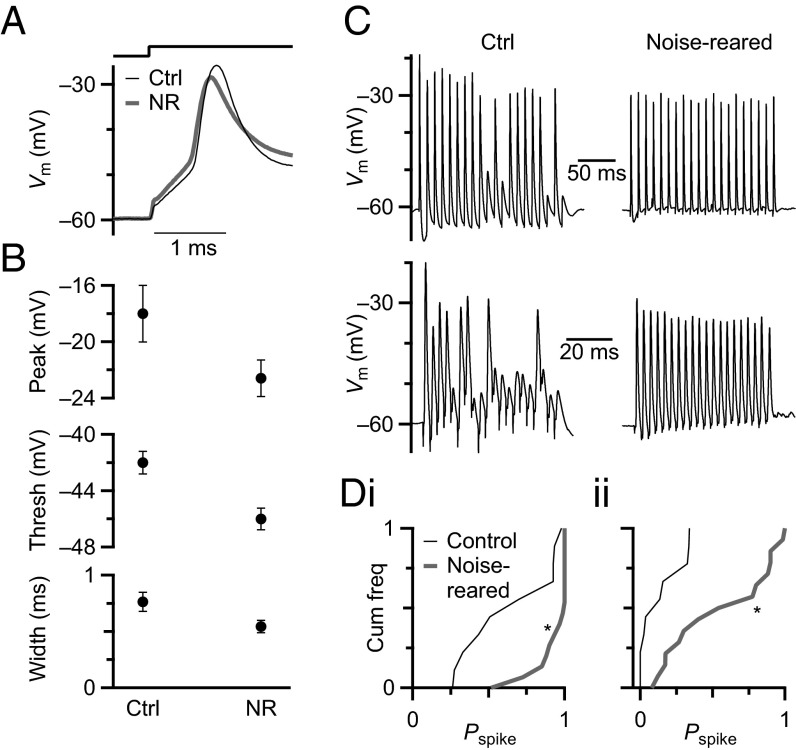
Information processing in the brain requires reliable synaptic transmission. High reliability at specialized auditory nerve synapses in the cochlear nucleus results from many release sites (N), high probability of neurotransmitter release (Pr), and large quantal size (Q). However, high Pr also causes auditory nerve synapses to depress strongly when activated at normal rates for a prolonged period, which reduces fidelity. We studied how synapses are influenced by prolonged activity by exposing mice to constant, nondamaging noise and found that auditory nerve synapses changed to facilitating, reflecting low Pr. For mice returned to quiet, synapses recovered to normal depression, suggesting that these changes are a homeostatic response to activity. Two additional properties, Q and average excitatory postsynaptic current (EPSC) amplitude, were unaffected by noise rearing, suggesting that the number of release sites (N) must increase to compensate for decreased Pr. These changes in N and Pr were confirmed physiologically using the integration method. Furthermore, consistent with increased N, endbulbs in noise-reared animals had larger VGlut1-positive puncta, larger profiles in electron micrographs, and more release sites per profile. In current-clamp recordings, noise-reared BCs had greater spike fidelity even during high rates of synaptic activity. Thus, auditory nerve synapses regulate excitability through an activity-dependent, homeostatic mechanism, which could have major effects on all downstream processing. Our results also suggest that noise-exposed bushy cells would remain hyperexcitable for a period after returning to normal quiet conditions, which could have perceptual consequences.

Keywords: cochlear nucleus; homeostasis; release probability.


Conflict of interest statement

The authors declare no conflict of interest.

Figures

Fig. 1.
Fig. 1.
Noise exposure lowers Pr at the endbulb of Held. AN fibers were stimulated with pairs of pulses of different interpulse intervals, Δt = 3–20 ms. (A) Representative traces recorded from P26 BCs from control and noise-reared animals. In control conditions (Left), EPSCs show depression at all intervals whereas, after noise rearing (Right), EPSCs show no depression, but rather facilitation. (B) Paired-pulse ratio (PPR) for the representative experiments in A. (C) Average PPR for control (n = 17) and noise-reared (n = 22) in animals P21 or older. PPR differed significantly (P < 0.005) at all intervals. (D) PPR for control (n = 28) and noise-reared (n = 26) at Δt = 3 ms as a function of age. Noise rearing commenced at P12. (E) PPR at Δt = 3 ms for control (open circles) and recovery (closed triangles) BCs. (F) Average PPR is slightly elevated over control after recovery (control n = 15; recovery n = 20, P < 0.05 for each interval). (G) Cumulative frequency of EPSC1 amplitudes in BCs from control (n = 34) and noise-reared animals (n = 22). The amplitudes do not differ significantly (P > 0.5, Kolmogorov–Smirnov test). Averages in C and F and in subsequent figures are represented by the mean ± the SEM.
Fig. 2.
Fig. 2.
Noise rearing has no effect on mEPSCs. (A) Representative traces showing mEPSCs measured in BCs from control (Top) and noise-reared (Bottom) animals. (B) Cumulative histogram of mEPSC amplitude for the representative cells in A. (C) Cumulative histogram of average mEPSC amplitudes measured in BCs from control (n = 19) and noise-reared (n = 12) animals. The distributions do not differ significantly (P = 0.3, K–S test). (D) Cumulative histogram of mEPSC frequency in BCs from control (n = 19) and noise-reared (n = 12) animals. The distributions of frequency do not differ significantly (P = 0.37). (E) Representative EPSC trains recorded in the presence of 1 mM kynurenate from a control and noise-reared BC in response to stimulation of a single presynaptic AN fiber (45 pulses, 100 Hz). (F) Derivation of N and Pr from trains data in E, using the integration method. EPSC amplitudes are integrated, and a fit is extrapolated back to the y axis. Arrowheads mark the estimated value of N. Pr is calculated by dividing the first EPSC by N. (G) Average Pr and N measured using the integration method. Noise-reared endbulbs have significantly lower Pr (0.30 ± 0.01, P < 0.005) and larger N (10.1 ± 0.1 nA, P < 0.05) compared with control (Pr = 0.45 ± 0.04, N = 5.9 ± 1.2 nA).
Fig. 3.
Fig. 3.
Anatomical changes at light and ultrastructure levels. (A and B) Endbulbs immunolabeled for VGLUT-1 in control (A) and noise-reared (B) animals. BC somata are surrounded by multiple VGLUT-1–positive puncta. (Scale bar: A and B, 20 µm.) (C) Puncta area for endbulbs from control and noise-reared mice. Horizontal lines mark average areas of puncta around individual BCs, and bars are overall averages across all cells (10 control, 15 noise-reared). The average area of puncta around noise-reared BCs is significantly greater than around control BCs (P < 0.05). (D and E) Representative profiles of endbulbs from control (D) and noise-reared (E) animals. Each profile has numerous synaptic vesicles, curved and asymmetric postsynaptic densities (asterisks). (Scale bar: D and E, 1 µm.) (F–H) Endbulbs in noise-reared mice had significantly more postsynaptic densities per profile (P < 0.05, Fisher exact test; F), larger profile perimeter and cross-sectional area (P < 0.001; G) and larger form factors (P < 0.001; H).
Fig. 4.
Fig. 4.
Effects of noise rearing on spike generation and fidelity of BC spiking. (A) Representative current-clamp recordings in response to current pulses of 0.6 nA in control and noise-reared BCs. (B) Average measurements of 30 BCs from control and 32 BCs from noise-reared mice, showing significant decreases in action potential peak voltage (Top, P = 0.03), threshold voltage (Middle, P < 0.005), and spike half-width (Bottom, P < 0.05). (C) Representative traces showing responses to fiber stimulation at 100 (Top) and 333 Hz (Bottom) in BCs from control (Left) and noise-reared (Right) mice. (D) Cumulative frequency histogram of spike probability (Pspike) over the second half of the stimulation train (pulses 11–20), for experiments similar to C. Pspike increased significantly after noise rearing (P < 0.05, asterisks) for both 100 (i) and 333 (ii) Hz.

References

    1. Turrigiano GG, Leslie KR, Desai NS, Rutherford LC, Nelson SB. Activity-dependent scaling of quantal amplitude in neocortical neurons. Nature. 1998;391(6670):892–896. - PubMed
    1. Turrigiano GG, Nelson SB. Homeostatic plasticity in the developing nervous system. Nat Rev Neurosci. 2004;5(2):97–107. - PubMed
    1. O’Brien RJ, et al. Activity-dependent modulation of synaptic AMPA receptor accumulation. Neuron. 1998;21(5):1067–1078. - PubMed
    1. Keck T, et al. Synaptic scaling and homeostatic plasticity in the mouse visual cortex in vivo. Neuron. 2013;80(2):327–334. - PubMed
    1. Hengen KB, Lambo ME, Van Hooser SD, Katz DB, Turrigiano GG. Firing rate homeostasis in visual cortex of freely behaving rodents. Neuron. 2013;80(2):335–342. - PMC - PubMed

Publication types

Substances