The Allergic Rhinitis - Clinical Investigator Collaborative (AR-CIC): nasal allergen challenge protocol optimization for studying AR pathophysiology and evaluating novel therapies
- PMID: 25945101
- PMCID: PMC4419495
- DOI: 10.1186/s13223-015-0082-0
The Allergic Rhinitis - Clinical Investigator Collaborative (AR-CIC): nasal allergen challenge protocol optimization for studying AR pathophysiology and evaluating novel therapies
Abstract
Background: The Nasal Allergen Challenge (NAC) model allows the study of Allergic Rhinitis (AR) pathophysiology and the proof of concept of novel therapies. The Allergic Rhinitis - Clinical Investigator Collaborative (AR-CIC) aims to optimize the protocol, ensuring reliability and repeatability of symptoms to better evaluate the therapies under investigation.
Methods: 20 AR participants were challenged, with 4-fold increments of their respective allergens every 15 minutes, to determine the qualifying allergen concentration (QAC) at which the Total Nasal Symptom Score (TNSS) of ≥10/12 OR a Peak Nasal Inspiratory Flow (PNIF) reduction of ≥50% from baseline was achieved. At the NAC visit, the QAC was used in a single challenge and TNSS and PNIF were recorded at baseline, 15 minutes, 30 minutes, 1 hour, and hourly up to 12 hours. 10 additional ragweed allergic participants were qualified at TNSS of ≥8/12 AND ≥50% PNIF reduction; the Cumulative Allergen Challenge (CAC) of all incremental doses was used during the NAC visit. 4 non-allergic participants were challenged with the highest allergen concentration.
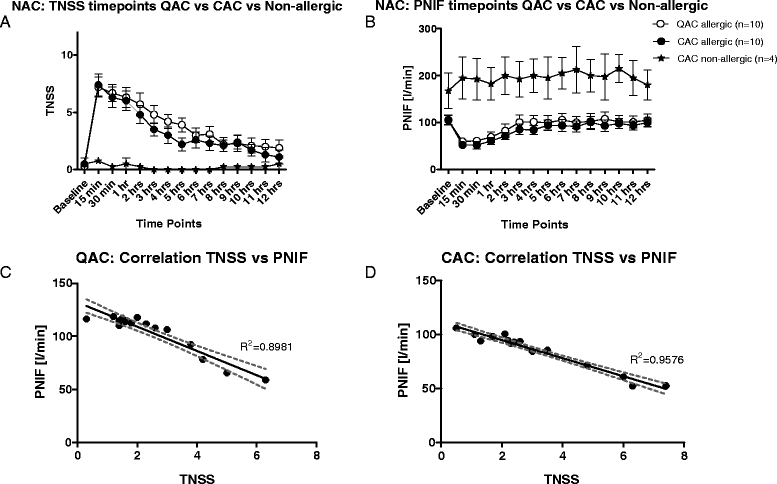
Results: In the QAC study, a group qualified by only meeting PNIF criteria achieved lower TNSS than those achieving either TNSS criteria or PNIIF+TNSS (p<0.01). During the NAC visit, participants in both studies reached their peak symptoms at 15minutes followed by a gradual decline, significantly different from non-allergic participants. The "PNIF only" group experienced significantly lower TNSS than the other groups during NAC visit. QAC and CAC participants did not reach the same peak TNSS during NAC that was achieved at screening. QAC participants qualifying based on TNSS or TNSS+PNIF managed to maintain PNIF scores.
Conclusions: Participants experienced reliable symptoms of AR in both studies, using both TNSS and PNIF reduction as part of the qualifying criteria proved better for qualifying participants at screening. Phenotyping based on pattern of symptoms experienced is possible and allows the study of AR pathophysiology and can be applied in evaluation of efficacy of a novel medication. The AR-CIC aims to continue to improve the model and employ it in phase 2 and 3 clinical trials.
Keywords: Allergic rhinitis; Clinical investigator collaborative; Nasal allergen challenge.
Figures


Similar articles
-
The Allergic Rhinitis Clinical Investigator Collaborative (AR-CIC): verification of nasal allergen challenge procedures in a study utilizing an investigational immunotherapy for cat allergy.Clin Transl Allergy. 2018 Apr 12;8:15. doi: 10.1186/s13601-018-0198-7. eCollection 2018. Clin Transl Allergy. 2018. PMID: 29682277 Free PMC article.
-
Repeatability of nasal allergen challenge results: Further validation of the allergic rhinitis clinical investigator collaborative protocols.Ann Allergy Asthma Immunol. 2018 Jun;120(6):607-613. doi: 10.1016/j.anai.2018.02.009. Epub 2018 Feb 9. Ann Allergy Asthma Immunol. 2018. PMID: 29432965
-
Clinical symptoms and biomarkers of Bermuda grass-induced allergic rhinitis using the nasal allergen challenge model.Ann Allergy Asthma Immunol. 2020 Jun;124(6):608-615.e2. doi: 10.1016/j.anai.2020.03.003. Epub 2020 Mar 13. Ann Allergy Asthma Immunol. 2020. PMID: 32173484
-
Effect of Medical Therapy in Allergic Rhinitis: A Systematic Review and Meta-Analysis.Am J Rhinol Allergy. 2022 Mar;36(2):269-280. doi: 10.1177/19458924211041438. Epub 2021 Sep 21. Am J Rhinol Allergy. 2022. PMID: 34546814
-
How to Diagnose and Treat Local Allergic Rhinitis: A Challenge for Clinicians.J Clin Med. 2019 Jul 19;8(7):1062. doi: 10.3390/jcm8071062. J Clin Med. 2019. PMID: 31331047 Free PMC article. Review.
Cited by
-
Adverse Drug Reactions (ADRs) of Montelukast in Children.Children (Basel). 2022 Nov 21;9(11):1783. doi: 10.3390/children9111783. Children (Basel). 2022. PMID: 36421233 Free PMC article.
-
Pharmacist-Led Education Intervention for Adults With Allergic Rhinitis: A Randomized Clinical Trial.JAMA Netw Open. 2025 Jul 1;8(7):e2517160. doi: 10.1001/jamanetworkopen.2025.17160. JAMA Netw Open. 2025. PMID: 40668584 Free PMC article. Clinical Trial.
-
Aeroallergens in Canada: Distribution, Public Health Impacts, and Opportunities for Prevention.Int J Environ Res Public Health. 2018 Jul 25;15(8):1577. doi: 10.3390/ijerph15081577. Int J Environ Res Public Health. 2018. PMID: 30044421 Free PMC article. Review.
-
A Study on the Significance of Nasal Smear Eosinophil Count and Blood Absolute Eosinophil Count in Patients with Allergic Rhinitis of Varied Severity of Symptoms.Indian J Otolaryngol Head Neck Surg. 2023 Dec;75(4):3449-3452. doi: 10.1007/s12070-023-03945-5. Epub 2023 Jun 27. Indian J Otolaryngol Head Neck Surg. 2023. PMID: 37974798 Free PMC article.
-
Allergic Rhinitis and Chronic Daily Headaches: Is There a Link?Curr Neurol Neurosci Rep. 2016 Apr;16(4):33. doi: 10.1007/s11910-016-0631-z. Curr Neurol Neurosci Rep. 2016. PMID: 26898685 Free PMC article. Review.
References
-
- Ray NF, Baraniuk JN, Thamer M, Rinehart CS, Gergen PJ, Kaliner M, et al. Direct expenditures for the treatment of allergic rhinoconjunctivitis in 1996, including the contributions of related airway illnesses. J Allergy Clin Immunol. 1999;103:401–407. doi: 10.1016/S0091-6749(99)70463-X. - DOI - PubMed
-
- Settipane RA, Charnock DR. Epidemiology of rhinitis: allergic and nonallergic. Clin Allergy Immunol. 2007;19:23–34. - PubMed
LinkOut - more resources
Full Text Sources
Other Literature Sources
Research Materials
Miscellaneous

