. 2015:2015:689745.
doi: 10.1155/2015/689745. Epub 2015 Mar 19.

Shaped singular spectrum analysis for quantifying gene expression, with application to the early Drosophila embryo

Affiliations

Shaped singular spectrum analysis for quantifying gene expression, with application to the early Drosophila embryo

Alex Shlemov et al. Biomed Res Int. 2015.

Abstract

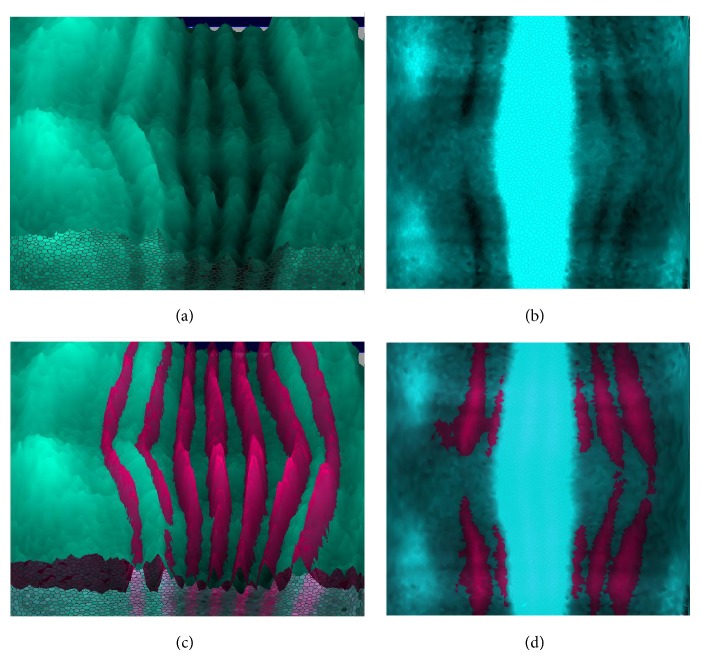
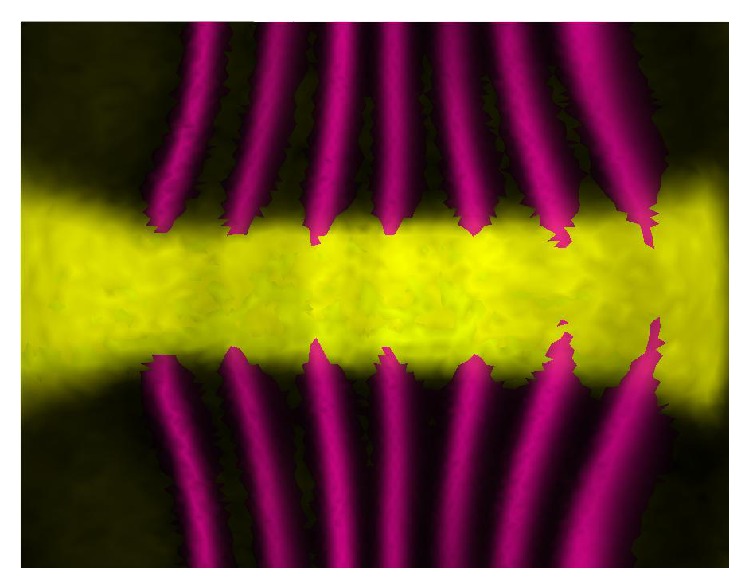
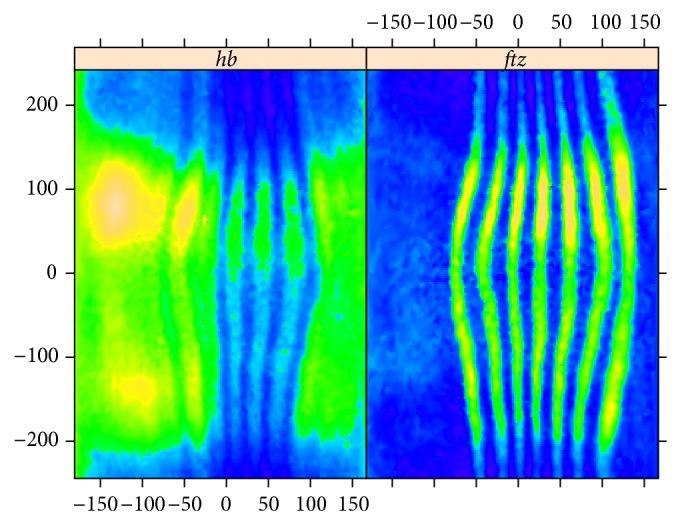
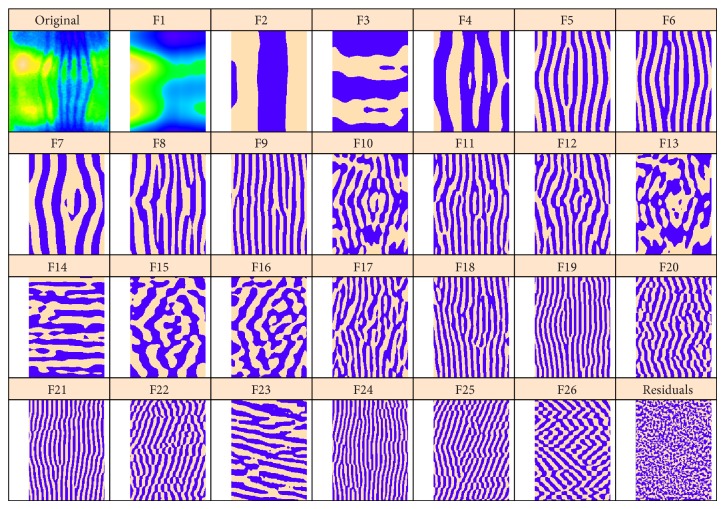
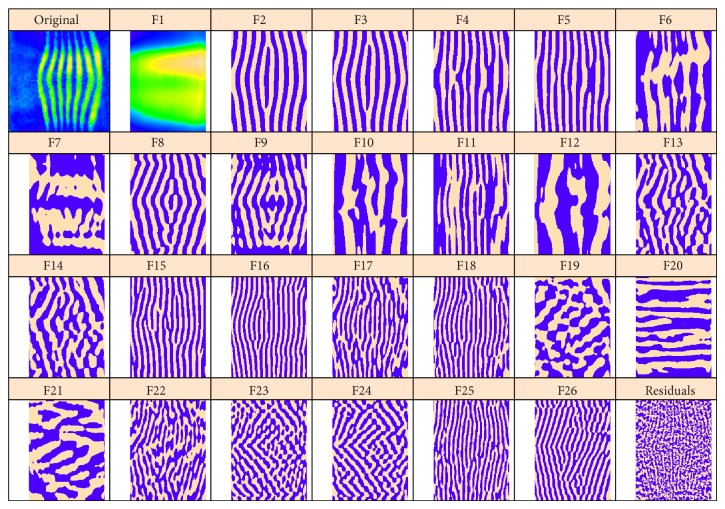
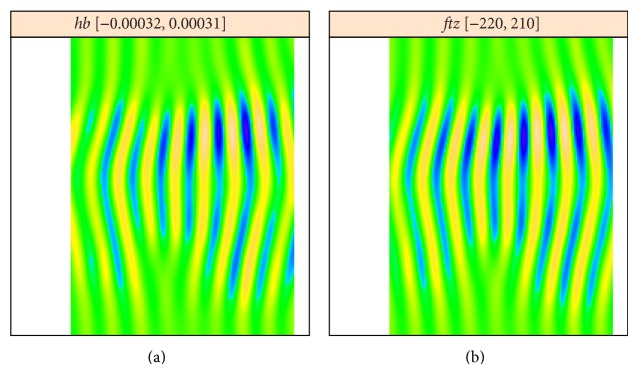
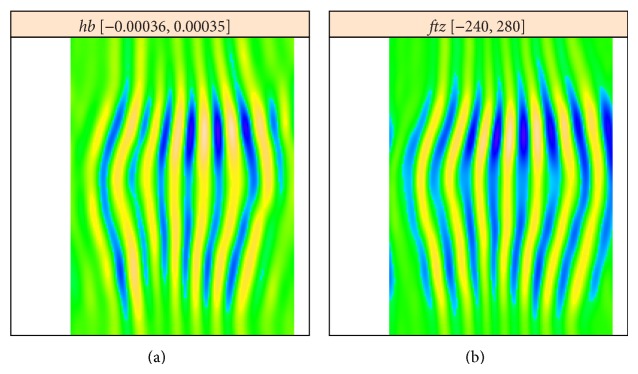
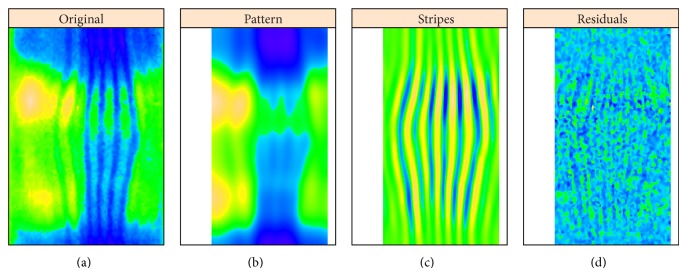
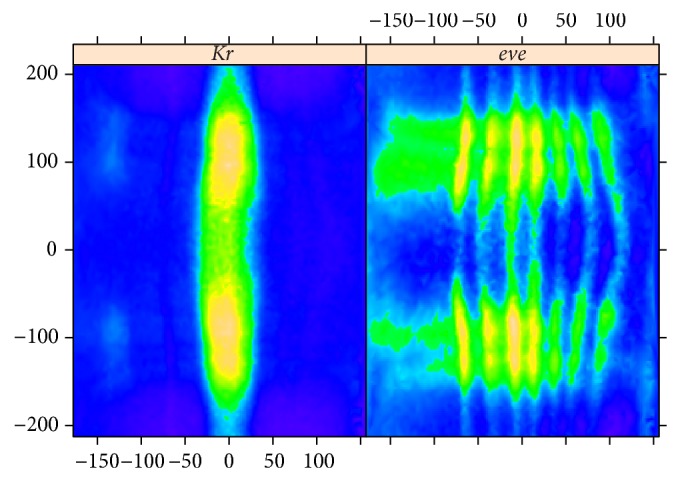
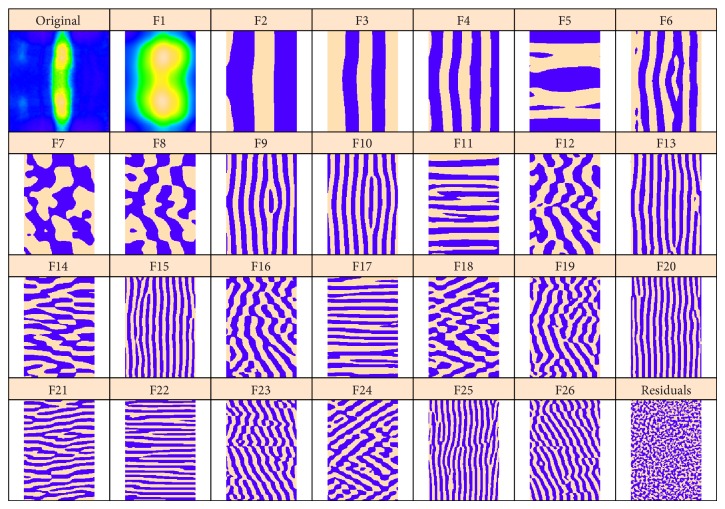
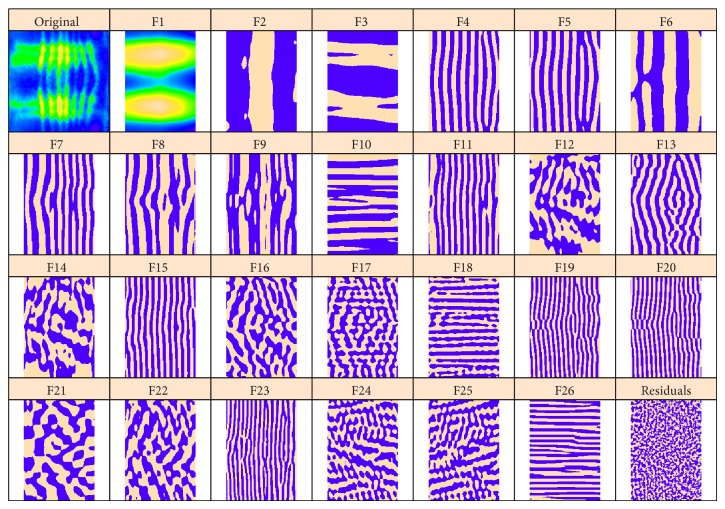
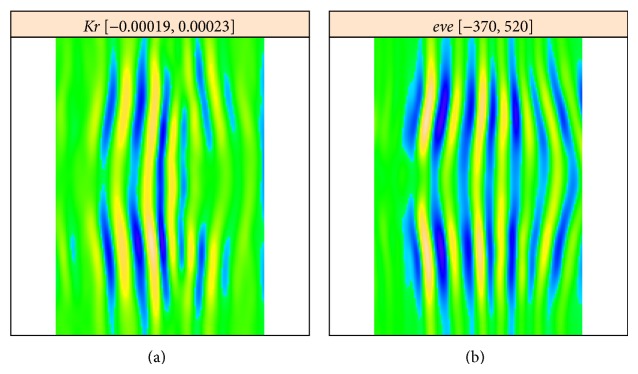
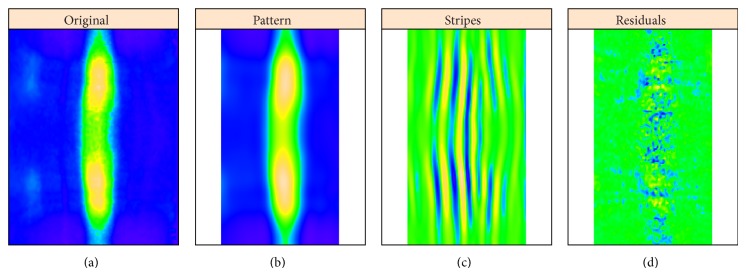
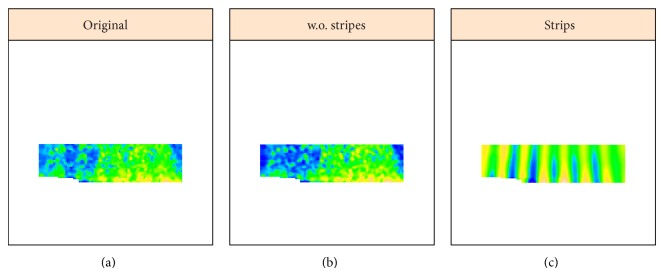
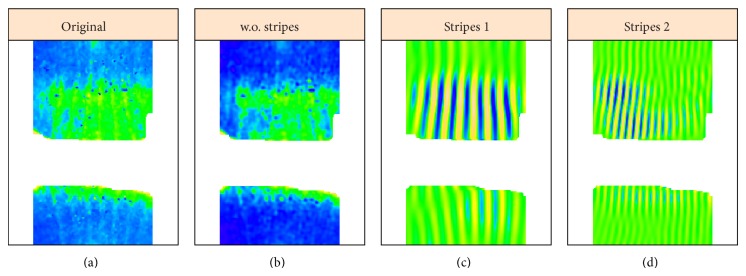
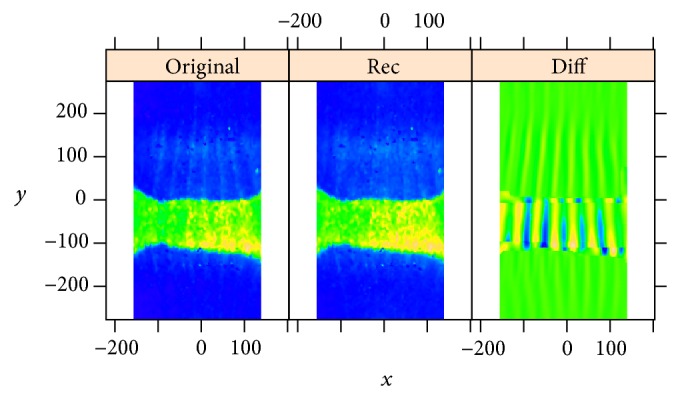
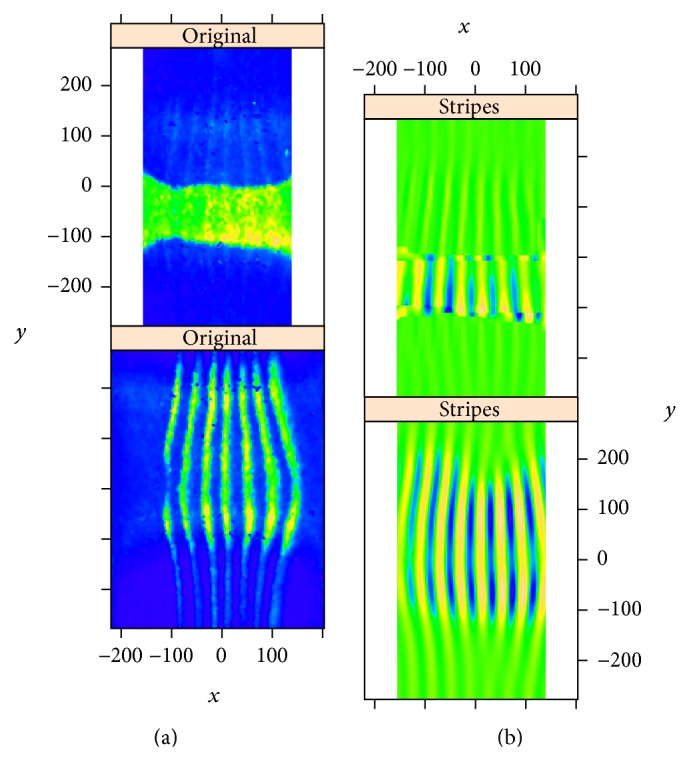
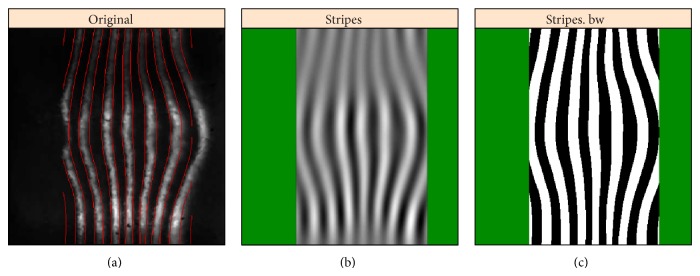
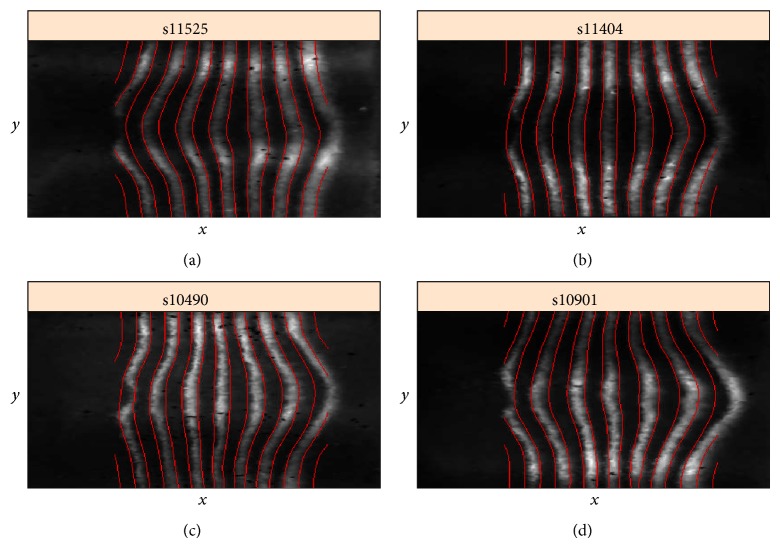
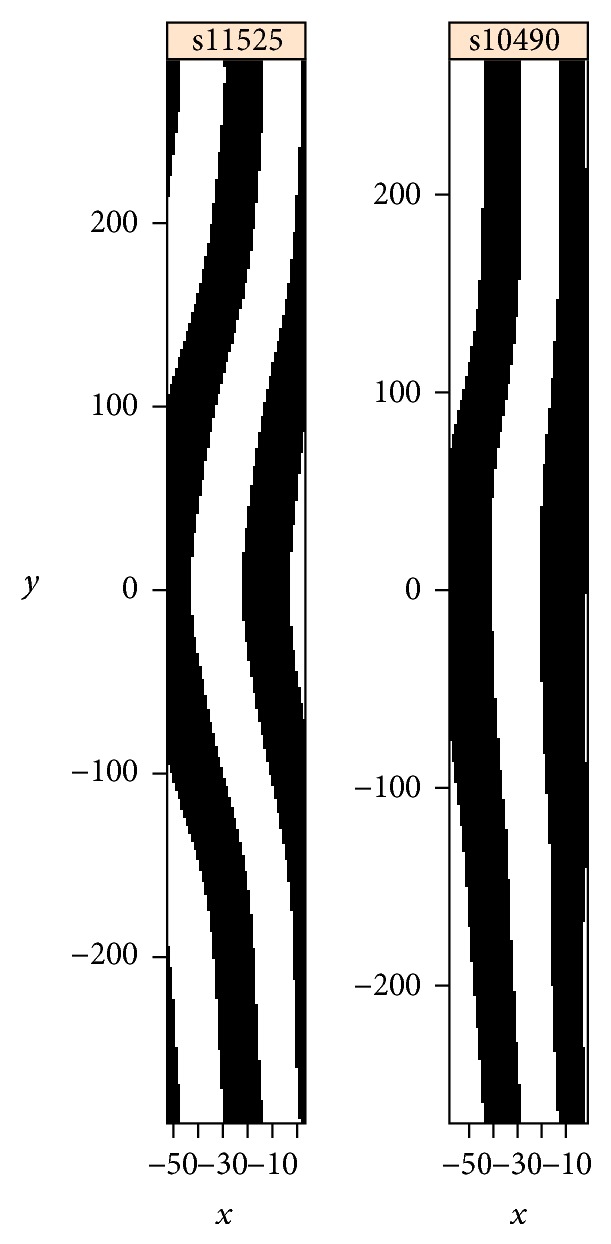
In recent years, with the development of automated microscopy technologies, the volume and complexity of image data on gene expression have increased tremendously. The only way to analyze quantitatively and comprehensively such biological data is by developing and applying new sophisticated mathematical approaches. Here, we present extensions of 2D singular spectrum analysis (2D-SSA) for application to 2D and 3D datasets of embryo images. These extensions, circular and shaped 2D-SSA, are applied to gene expression in the nuclear layer just under the surface of the Drosophila (fruit fly) embryo. We consider the commonly used cylindrical projection of the ellipsoidal Drosophila embryo. We demonstrate how circular and shaped versions of 2D-SSA help to decompose expression data into identifiable components (such as trend and noise), as well as separating signals from different genes. Detection and improvement of under- and overcorrection in multichannel imaging is addressed, as well as the extraction and analysis of 3D features in 3D gene expression patterns.


Figures

Figure 1
Figure 1
An example of overcorrection in gene expression data causing the subtraction of the reference gene pattern (the seven-striped ftz and eve patterns; dark magenta) from the pattern under study (hb and Kr gene products (transcription factors); light blue). Visualization by PointCloudXplore tools [7], BDTNP embryos hbv5-s11512-2oc06-25” ((a) and (c)), Krv5-s12169-24oc07-22” ((b) and (d)); (c) is the same as (a) with added ftz; (d) is the same as (b) with added eve.
Figure 2
Figure 2
An example of undercorrection, in which the periodic reference gene pattern (eve; dark magenta) adds periodicity to the nonperiodic pattern under study (sna gene product; yellow). Visualization by PointCloudXplore. Embryo “v5-s10531-28fe05-07.”
Figure 3
Figure 3
hb and ftz: original images of the “unrolled” cylindrical surface; the top values are a direct continuation of bottom values.
Figure 4
Figure 4
hb: the original image and the elementary components extracted by circular 2D-SSA. The original image and the leading component (F1) are colour-mapped according to the min and max expression levels. For more contrast, the remaining components are depicted in a binary format, with positive values in beige and negative values in purple.
Figure 5
Figure 5
ftz: original image, F1 with the background; the remaining elementary components are depicted in a binary format.
Figure 6
Figure 6
hb (a) and ftz (b): reconstruction from the main striped components 5 and 6 for the hb analysis, 2 and 3 for the ftz analysis. The stripes are out of phase for hb and ftz.
Figure 7
Figure 7
hb (a) and ftz (b): reconstruction from all striped components.
Figure 8
Figure 8
hb ((a) to (d)): original image, unstriped pattern, stripes, and residual noise.
Figure 9
Figure 9
Kr and eve: original images.
Figure 10
Figure 10
Kr gene expression, with circular 2D-SSA decomposition: original image and elementary components. As with Figures 11 and 10, the original image and leading component (F1) are colour-mapped according to min and max expression levels. For more contrast, the remaining components are depicted purple and beige.
Figure 11
Figure 11
eve gene expression, with circular 2D-SSA decomposition: original image and elementary components.
Figure 12
Figure 12
Kr and eve: reconstruction with stripe components, from the Kr image (a) and from the eve image (b). The frequencies correspond, but are out-of-phase, indicating overcorrection in the unmixing algorithm.
Figure 13
Figure 13
Kr: processing of the Kr expression image by circular 2D-SSA. ((a) to (d)): original image, pattern components (numbers 1–8), stripes (components 9, 10, 13, 15, 20, 25), and residual noise.
Figure 14
Figure 14
sna image, area 1, strong expression zone. ((a) to (c)): original image, reconstruction without stripes, and stripe components from the eve marker.
Figure 15
Figure 15
sna image, area 2, weak expression zone. ((a) to (d)): original image, reconstruction without stripes, and stripe components.
Figure 16
Figure 16
sna, combined image (both zones from Figures 14 and 15). ((a) to (d)): original image, reconstruction without stripes, and the difference. BDTNP embryo  v5-s10531-28fe05-07.pce.
Figure 17
Figure 17
sna and eve: the original images (a) and the stripes (b), sna at top and eve at bottom.
Figure 18
Figure 18
(a) original image, (b) reconstruction of strips, (c) conversion to black and white, according to positive or negative values on the intensity scale; black-white boundaries are shown as red lines on the original image. BDTNP embryo “v5_s10901-20ap06-11s10901.”
Figure 19
Figure 19
Four cases of the 3D geometry of eve expression stripes. Stripe 4 can be a forward “C”-shape (a), straight (b), a negative “C”-shape (c), or “S”-shaped (d). BDTNP embryo IDs are given on the images.
Figure 20
Figure 20
“C” and straight eve stripe 4 shapes, shown in black and white. BDTNP embryo IDs given on the images.

Similar articles

Cited by

References

    1. Knowles D. W., Biggin M. D. Building quantitative, three-dimensional atlases of gene expression and morphology at cellular resolution. Wiley Interdisciplinary Reviews: Developmental Biology. 2013;2(6):767–779. - PMC - PubMed
    1. Schindelin J., Arganda-Carreras I., Frise E., et al. Fiji: an open-source platform for biological-image analysis. Nature Methods. 2012;9(7):676–682. doi: 10.1038/nmeth.2019. - DOI - PMC - PubMed
    1. Bao Z., Murray J. I., Boyle T., Ooi S. L., Sandel M. J., Waterston R. H. Automated cell lineage tracing in Caenorhabditis elegans. Proceedings of the National Academy of Sciences of the United States of America. 2006;103(8):2707–2712. doi: 10.1073/pnas.0511111103. - DOI - PMC - PubMed
    1. Fowlkes C. C., Hendriks C. L. L., Keränen S. V. E., et al. A quantitative spatiotemporal atlas of gene expression in the Drosophila blastoderm. Cell. 2008;133(2):364–374. doi: 10.1016/j.cell.2008.01.053. - DOI - PubMed
    1. Liu X., Long F., Peng H., et al. Analysis of cell fate from single-cell gene expression profiles in C. elegans. Cell. 2009;139(3):623–633. doi: 10.1016/j.cell.2009.08.044. - DOI - PMC - PubMed

Publication types

MeSH terms

Substances

LinkOut - more resources