. 2015;14(14):2285-92.
doi: 10.1080/15384101.2015.1046653. Epub 2015 May 6.

Apoptotic effects of high-dose rapamycin occur in S-phase of the cell cycle

Affiliations

Apoptotic effects of high-dose rapamycin occur in S-phase of the cell cycle

Mahesh Saqcena et al. Cell Cycle. 2015.

Abstract

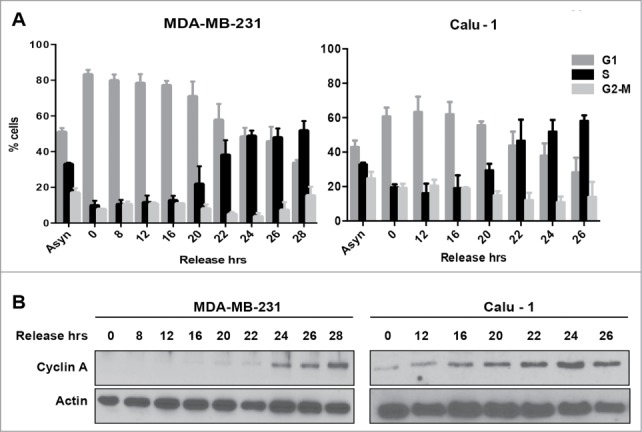
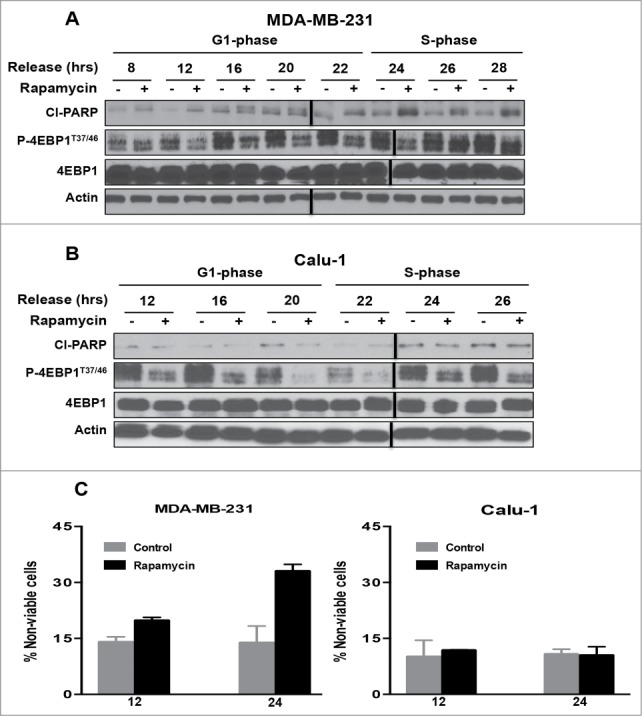
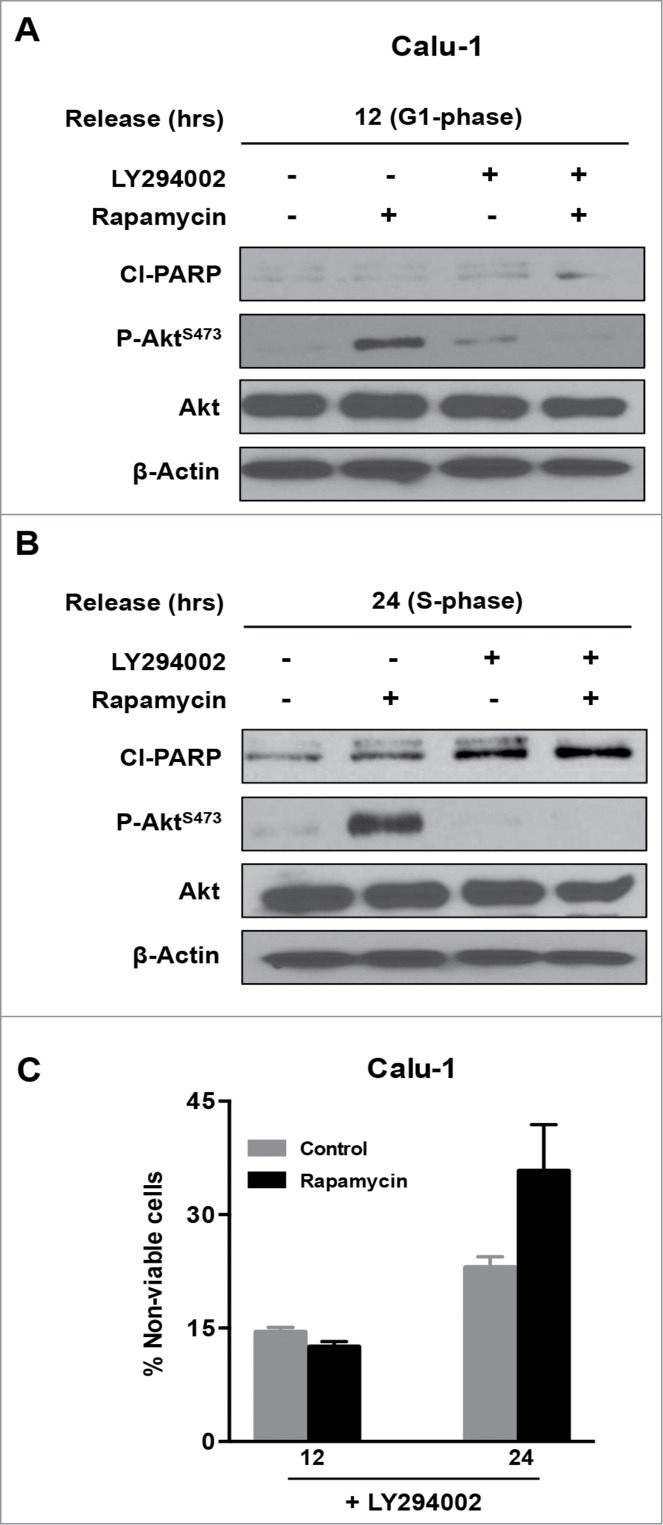
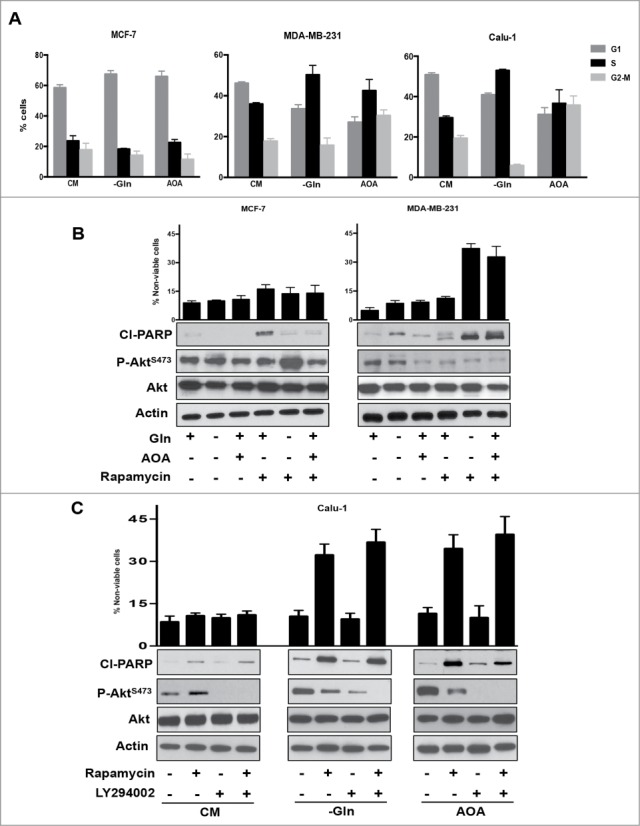
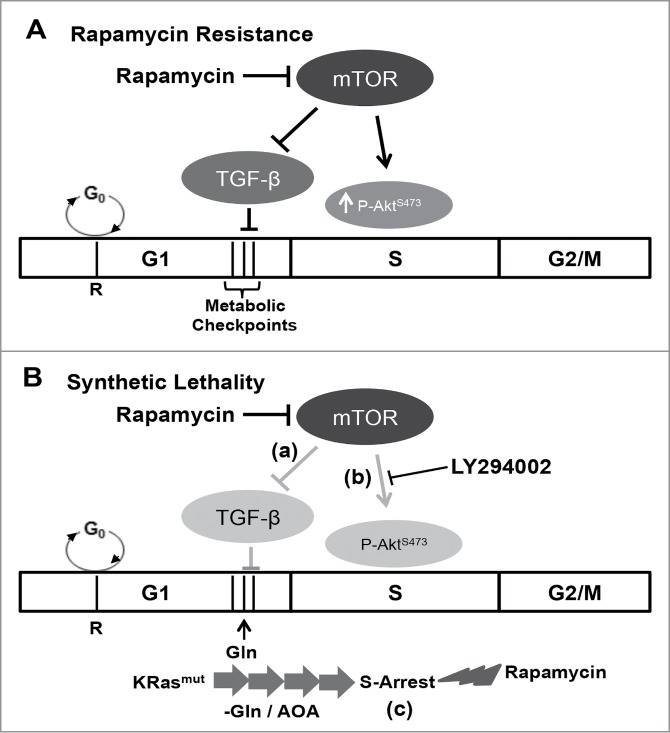
Mutations in genes encoding regulators of mTOR, the mammalian target of rapamycin, commonly provide survival signals in cancer cells. Rapamycin and analogs of rapamycin have been used with limited success in clinical trials to target mTOR-dependent survival signals in a variety of human cancers. Suppression of mTOR predominantly causes G1 cell cycle arrest, which likely contributes to the ineffectiveness of rapamycin-based therapeutic strategies. While rapamycin causes the accumulation of cells in G1, its effect in other cell cycle phases remains largely unexplored. We report here that when synchronized MDA-MB-231 breast cancer cells are allowed to progress into S-phase from G1, rapamycin activates the apoptotic machinery with a concomitant increase in cell death. In Calu-1 lung cancer cells, rapamycin induced a feedback increase in Akt phosphorylation at Ser473 in S-phase that mitigated rapamycin-induced apoptosis. However, sensitivity to rapamycin in S-phase could be reestablished if Akt phosphorylation was suppressed. We recently reported that glutamine (Gln) deprivation causes K-Ras mutant cancer cells to aberrantly arrest primarily in S-phase. Consistent with observed sensitivity of S-phase cells to rapamycin, interfering with Gln utilization sensitized both MDA-MB-231 and Calu-1 K-Ras mutant cancer cells to the apoptotic effect of rapamycin. Importantly, rapamycin induced substantially higher levels of cell death upon Gln depletion than that observed in cancer cells that were allowed to progress through S-phase after being synchronized in G1. We postulate that exploiting metabolic vulnerabilities in cancer cells such as S-phase arrest observed with K-Ras-driven cancer cells deprived of Gln, could be of great therapeutic potential.

Keywords: 4E-BP1, eIF4E binding protein-1; GOT, glutamate-oxaloacetate-transaminase; Gln, glutamine; PARP, poly-ADP-ribose polymerase; PI3K, phosphatidylinositol-3-kinase; S6K, S6 kinase; TGF-β, transforming growth factor-β.; cell cycle; eIF4E, eukaryotic initiation factor 4E; glutamine; mTOR; mTOR, mammalian target of rapamycin; mTORC1/2, mTOR complex 1/2; rapamycin; synthetic lethality.


Figures

Figure 1.
Figure 1.
Cell cycle progression from G1 into S-phase for MDA-MB-231 and Calu-1 cells. (A) MDA-MB-231 breast cancer cells and Calu-1 lung cancer cells were plated at 30% confluence in medium containing 10% serum. After 24 hours, cells were synchronized using lovastatin as described in Materials and Methods. Upon release from G1 block, cells were collected at indicated time points and analyzed for cell cycle distribution by measuring DNA content using flow cytometry. Error bars represent the standard deviation for experiments repeated at least 3 times. (B) Western blot analysis performed to determine the levels of cyclin A, and actin. These data shown are representative of experiments repeated at least 3 times.
Figure 2.
Figure 2.
mTOR inhibition by rapamycin enhances apoptosis in S-phase of the cell cycle in MDA-MB-231 cells but not in Calu-1 cells. MDA-MB-231 (A) and Calu-1 (B) cells were synchronized in G1 phase of the cell cycle using lovastatin as in Figure 1. Upon release from G1 block, rapamycin (20μM) was added at indicated time points. After 24 hours, cells were collected and Western blot analysis was performed for cleaved PARP (ClPARP), P-4E-BP1T37/46, 4E-BP1, and actin. These data shown are representative of experiments repeated at least 3 times. (C) MDA-MB-231 and Calu-1 cells were synchronized using lovastatin as in A and B. Upon release from G1 block, the cells were treated with rapamycin at 12 and 24 hr. Cells were collected 24 hr later and cell viability assays were performed using trypan blue exclusion as described in Materials and Methods. Error bars represent the standard deviation for experiment at least repeated 3 times.
Figure 3.
Figure 3.
Combined inhibition of mTORC1 and Akt phosphorylation induces PARP cleavage in Calu-1 cells. Calu-1 cells were synchronized using lovastatin as in Figure 1. Upon release from G1 block, rapamycin and LY294002 (20 μM each) were added at 12 hours (G1 phase) (A) and at 24 hours (S phase) (B). Twenty-four hours later, cells were collected and Western blot analysis was performed for cleaved PARP (ClPARP), P-AktS-473, Akt and actin. The data shown are representative of experiments repeated at least 2 times. (C) Calu-1 cells were synchronized using Lovastatin as above. Upon release from G1 block, the cells were treated with rapamycin and LY294002 at indicated times for 24 hours. Cells were then collected and cell viability assays were performed as in Figure 2C. Error bars represent the standard deviation for experiment at least repeated 2 times.
Figure 4.
Figure 4.
Glutamine starvation causes S phase arrest in K-Ras mutant cell lines and sensitizes them to rapamycin. (A) MCF7, MDA-MB-231, and Calu-1 cells were plated at 30% confluence. After 24 hours, cells were shifted to medium lacking Gln or complete medium containing AOA (0.5 mM) for 48 hours. Cells were collected and analyzed for cell cycle distribution by measuring DNA content using FACS analysis. Error bars represent the standard deviation for experiments repeated at least repeated 3 times. (B) MCF-7 and MDA-MB-231 cells were arrested in S phase as described in A. After 48 hours, cells were additionally treated with Rapamycin for 24 hours. Cells were collected and Western blot analysis was performed for cleaved PARP, P-Akt S473 phosphorylation and actin. Cell viability was determined as in Figure 2C. Error bars represent the standard deviation for experiments repeated 3 times. (C) Calu-1 cells were arrested in S phase as in A. After 48 hours, cells were treated with Rapamycin and LY294002 for 24 hours where indicated. Cells were then collected and Western blot analysis and cell viability assays were performed as in B. Error bars represent the standard deviation for experiments repeated 3 times.
Figure 5.
Figure 5.
Model for cell cycle-dependent sensitivity to rapamycin. (A) Rapamycin resistance. In most cells, the apoptotic effect of rapamycin is negated by a TGF-β-dependent late G1 cell cycle arrest. Additionally, a feedback dependent increase in Akt phosphorylation at Ser473 mitigates S-phase cytotoxicity of rapamycin. (B) Synthetic lethality. A synthetic lethality for rapamycin could be created via one of the 3 mechanisms: (a) in cells with defective TGF-β signaling, rapamycin treatment fails to arrest the cells in G1, and instead the cells progress into S-phase where rapamycin causes apoptosis; (b) feedback activation of AktS473 phosphorylation in S-phase is suppressed with LY294002, and in the absence of Akt-dependent survival signals, rapamycin induces apoptotic cell death; and lastly (c) in K-Ras mutant cancer cells, blockade of Gln utilization causes the cells to aberrantly arrest in S-phase. Importantly, in this case, S-phase arrest is not accompanied with an increase in AktS473 phosphorylation upon rapamycin treatment, and as a consequence, rapamycin induces apoptotic cell death in the absence of Akt inhibition.

Comment in

References

    1. Hung CM, Garcia-Haro L, Sparks CA, Guertin DA. mTOR-dependent cell survival mechanisms. Cold Spring Harb Perspect Biol 2012; 4:a008771; PMID:23124837 - PMC - PubMed
    1. Fingar DC, Blenis J. Target of rapamycin (TOR): an integrator of nutrient and growth factor signals and coordinator of cell growth and cell cycle progression. Oncogene 2004; 23:3151-71; PMID:15094765; http://dx.doi.org/ 10.1038/sj.onc.1207542 - DOI - PubMed
    1. Ward PS, Thompson CB. Metabolic reprogramming: a cancer hallmark even warburg did not anticipate. Cancer Cell 2012; 21:297-308; PMID:22439925; http://dx.doi.org/ 10.1016/j.ccr.2012.02.014 - DOI - PMC - PubMed
    1. Blagosklonny MV. Molecular damage in cancer: an argument for mTOR-driven aging. Aging 2011; 3:1130-41; PMID:22246147 - PMC - PubMed
    1. Foster DA. Phosphatidic acid signaling to mTOR: signals for the survival of human cancer cells. Biochim Biophys Acta 2009; 1791:949-55; PMID:19264150; http://dx.doi.org/ 10.1016/j.bbalip.2009.02.009 - DOI - PMC - PubMed

Publication types

MeSH terms