. 2015 Aug;19(8):1994-2005.
doi: 10.1111/jcmm.12586. Epub 2015 May 6.

MicroRNA-132/212 family enhances arteriogenesis after hindlimb ischaemia through modulation of the Ras-MAPK pathway

Affiliations

MicroRNA-132/212 family enhances arteriogenesis after hindlimb ischaemia through modulation of the Ras-MAPK pathway

Zhiyong Lei et al. J Cell Mol Med. 2015 Aug.

Abstract

Arteriogenesis is a complicated process induced by increased local shear-and radial wall-stress, leading to an increase in arterial diameter. This process is enhanced by growth factors secreted by both inflammatory and endothelial cells in response to physical stress. Although therapeutic promotion of arteriogenesis is of great interest for ischaemic diseases, little is known about the modulation of the signalling cascades via microRNAs. We observed that miR-132/212 expression was significantly upregulated after occlusion of the femoral artery. miR-132/212 knockout (KO) mice display a slower perfusion recovery after hind-limb ischaemia compared to wildtype (WT) mice. Immunohistochemical analysis demonstrates a clear trend towards smaller collateral arteries in KO mice. Although Ex vivo aortic ring assays score similar number of branches in miR-132/212 KO mice compared to WT, it can be stimulated with exogenous miR-132, a dominant member of the miR-132/212 family. Moreover, in in vitro pericyte-endothelial co-culture cell assays, overexpression of miR-132 and mir-212 in endothelial cells results in enhanced vascularization, as shown by an increase in tubular structures and junctions. Our results suggested that miR-132/212 may exert their effects by enhancing the Ras-Mitogen-activated protein kinases MAPK signalling pathway through direct inhibition of Rasa1, and Spred1. The miR-132/212 cluster promotes arteriogenesis by modulating Ras-MAPK signalling via direct targeting of its inhibitors Rasa1 and Spred1.

Keywords: Ras-MAPK; arteriogenesis; hindlimb ischaemia; miR-132/212.


Figures

Figure 1
Figure 1
miR-132/212 expression after hind-limb ischaemia. (A) miR-132 expression as measured by qPCR assays. N = 5, values in the graph are shown as mean ± SEM, *P < 0.05; **P < 0.01. (B) miR-212 expression as measured by qPCR assays. N = 5, values in the graph are shown as mean ± SEM, **P < 0.01; ***P < 0.001.
Figure 2
Figure 2
miR-132/212 knockout mice show slower blood flow recovery rate after hindlimb ischaemia. (A) Laser Doppler images of WT and miR-132/212 KO at 0, 4, 7 and 14 days after ligation of femoral artery. Low or no perfusion is displayed as dark blue, whereas the highest degree of perfusion is displayed as red. (B) Quantification of laser Doppler image (Ratio R/L) as shown in A (N = 10 for WT and 13 for KO. Values in the graph are shown as mean ± SEM, *P < 0.05. (C) Quantification of number of αSMA positive vessels as determined by αSMA staining on adductor muscle on day 14. (N = 10 for WT and 13 for KO. Values in the graph are shown as mean ± SEM). (D) Quantification of the diameter of αSMA positive vessels as determined by αSMA staining on adductor muscle on day 14 (N = 10 for WT and 13 for KO. Values in the graph are shown as mean ± SEM). (E) Quantitative analysis the percentage of arteries in different size range. Note the higher percentage in the small vessels (≦400 a.u.) but lower in the larger vessel in the miR-132/212 KO mice (N = 10 for WT and 13 for KO.
Figure 3
Figure 3
Effect of miR132 and miR212 in HUVECs angiogenesis in co-culture with pericytes. (A) Representative image from HUVECs and pericytes co-culture assay with miR-132 and 212 transfection. HUVECs labelled in green with GFP, pericytes in labelled with PKH26 in red. (B) Quantification of the HUVECs and pericytes co-culture assay with anti-miR-132 and 212 transfection (N = 3, values in the graph are shown as mean ± SEM, *P < 0.05; **P < 0.01).
Figure 4
Figure 4
Identification ofSpred1 and Spry1 as direct miR-132/212 targets by luciferase assay and in cultured HUVECs. (A) The position of predicted miR-132 and miR212 targets of Spred1 by Targetscan and mutant form of 3′UTR as indicated in red. (B) Luciferase assay of Spred1-3′UTR reporter in response to transfection with indicated scramble or microRNA mimics at final concentration of 25 nM. N ≥ 3, values in the graph are shown as mean ± SEM, **P < 0.01; ***P < 0.001. (C) Luciferase activity of wildtype and mutant Spred1-3′UTR in response to different dose of miR-132, N = 6 for WT; N = 3 for mutant. Values in the graph are shown as mean ± SEM *P < 0.05. (D) The position of predicted miR-132 and miR212 targets of Spred1 by Targetscan and mutant form of 3′UTR as indicated in red. (E) Luciferase assay of Spred1-3′UTR reporter in response to transfection with indicated scramble or microRNA mimics at final concentration of 25 nM. N ≥ 3, values in the graph are shown as mean ± SEM; **P < 0.05; ***P < 0.001. (F) Luciferase activity of wildtype and mutant Spred1-3′UTR in response to different final concentration of miR-132 mimics transfection, N = 6 for WT; N = 3 for mutants. Values in the graph are shown as mean ± SEM, *P < 0.05. (G) RASA1 expression after miR-132, miR212 overexpression and inhibition in HUVECs. The number above indicates the relative expression compared with sham normalized by β-Tubulin expression. (H) SPRED1 and SPRY1 expressions after miR-132, miR212 overexpression and inhibition in HUVECs. The number above indicates the relative expression compared with sham normalized by β-Tubulin expression.
Figure 5
Figure 5
miR-132/212 modulate Ras-MAPK signalling by suppressing Rasa1, Spred1 and Spry1 in HUVECs. (A) Experimental setting for quantitative measure of active ERK1/2 using Bio-plex phosopho-ERK1/2 assay. (B) A working model for miR-132/212 in modulation of Ras-MAPK pathway. (C) Quantification of Spred1, Spry1 or Rasa1 expression level after siRNA transfection against Spred1, Spry1 or Rasa1 in HUVECs, Values in the graph are shown as mean ± SEM, *** P < 0.001 n = 3. (D) Quantification of phosophorylated ERK1/2 level by Bio-plex pro phosopho-ERK1/2 set. Note the sustain ERK1/2 phosphorylation is prolonged after miR-132, 212 transfection or siRNA against Spred1, Spry1, Rasa1 or combinations of the three. (E) Modelling the decay of phosophorylated ERK1/2 level from D.
Figure 6
Figure 6
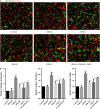
Knockdown targets of miR132 and miR212 Rasa1, Spred1 and Spry1 mimics effect of miR-132 and miR-212 in HUVECs pericytes neovascularization assay. (A) Representative image from HUVECs and pericytes co-culture assay after transfection with siRNAs against Spred1, Spry1, Rasa1 and combination of these three siRNA. (B) Quantification of the number of tubules, junctions and total tubule length in the HUVECs and pericytes co-culture assay after transfection with siRNAs against Spred1, Spry1 and Rasa1, Values in the graph are shown as mean ± SEM, *P < 0.05; **P < 0.01; n = 3.
Figure 7
Figure 7
Expression of miR-132/212 targets and phosophorylated ERK1/2 in ischaemia limb. (A) Spred1, Rasa1 and Spry1 expression as determined by Western blot, normalized by β-Actin. (B) Quantification Spred1, Rasa1 and Spry1 expression as determined by Western blot in B. (C) Phosophorylated ERK1/2 expression in the thigh WT and KO mice on 14 days after hindlimb ischaemia as determined by Western blot on day 14. (D) Quantification of phosophorylated ERK1/2 expression in the thigh WT and KO mice on 14 days after hindlimb ischaemia as determined by Western blot, normalized by β-Actin.

References

    1. Carmeliet P, Jain RK. Molecular mechanisms and clinical applications of angiogenesis. Nature. 2011;473:298–307. - PMC - PubMed
    1. Revencu N, Boon LM, Mendola A, et al. RASA1 mutations and associated phenotypes in 68 families with capillary malformation-arteriovenous malformation. Hum Mutat. 2013;34:1632–41. - PubMed
    1. Heil M, Eitenmuller I, Schmitz-Rixen T, et al. Arteriogenesis versus angiogenesis: similarities and differences. J Cell Mol Med. 2006;10:45–55. - PMC - PubMed
    1. Troidl K, Schaper W. Arteriogenesis versus angiogenesis in peripheral artery disease. Diabetes Metab Res Rev. 2012;28:27–9. - PubMed
    1. Shimpo M, Ikeda U, Maeda Y, et al. AAV-mediated VEGF gene transfer into skeletal muscle stimulates angiogenesis and improves blood flow in a rat hindlimb ischemia model. Cardiovasc Res. 2002;53:993–1001. - PubMed

Publication types

MeSH terms