. 2015 May 6;10(5):e0126283.
doi: 10.1371/journal.pone.0126283. eCollection 2015.

Assembly of a comprehensive regulatory network for the mammalian circadian clock: a bioinformatics approach

Affiliations

Assembly of a comprehensive regulatory network for the mammalian circadian clock: a bioinformatics approach

Robert Lehmann et al. PLoS One. .

Abstract

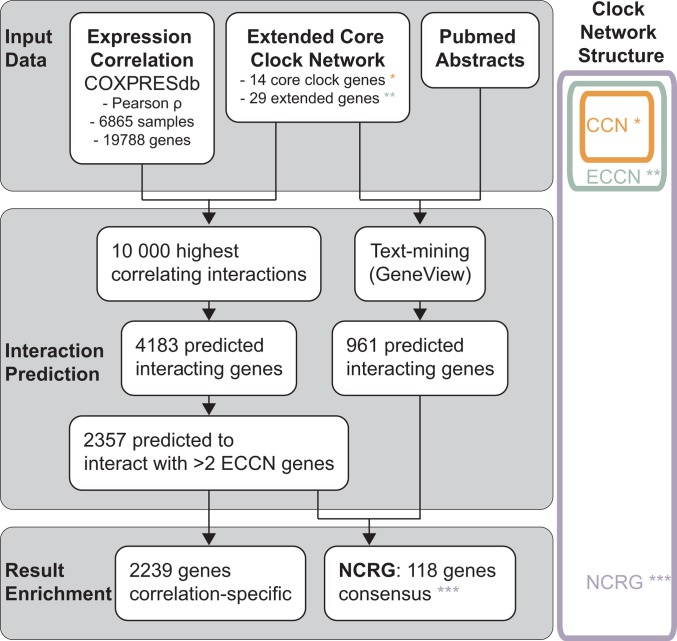
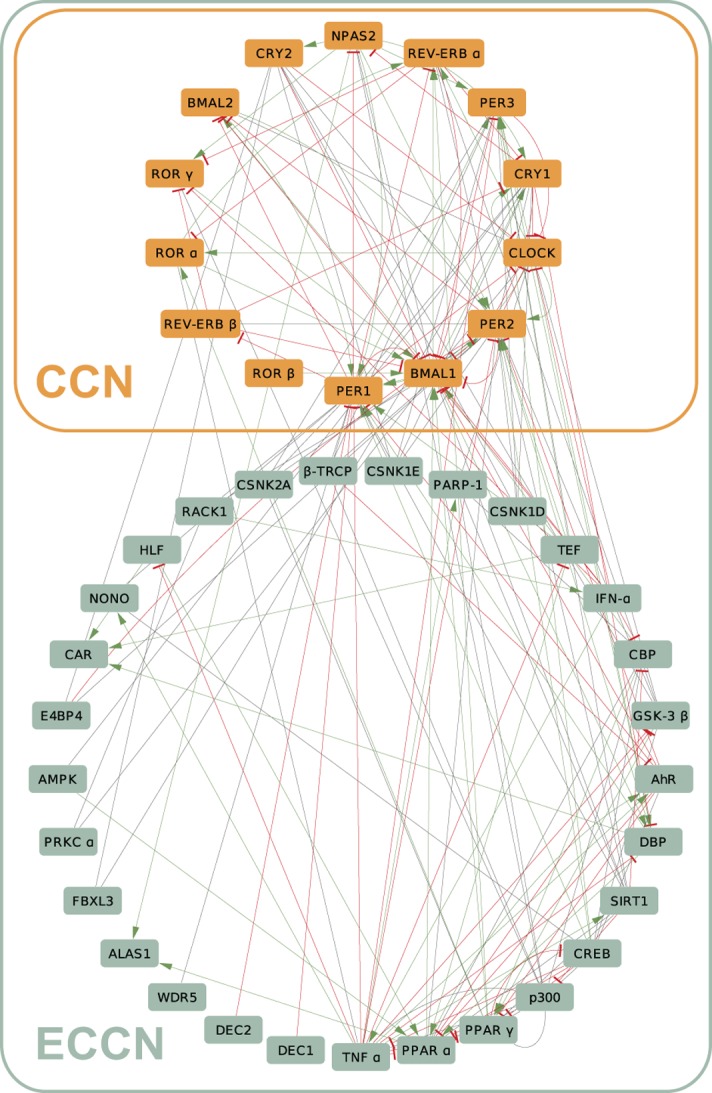
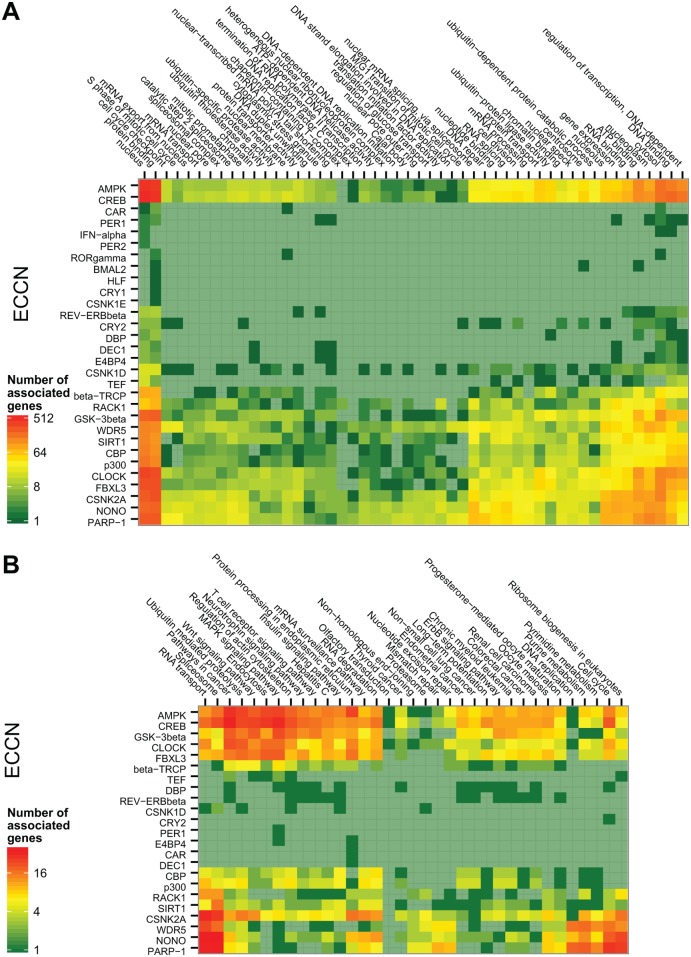
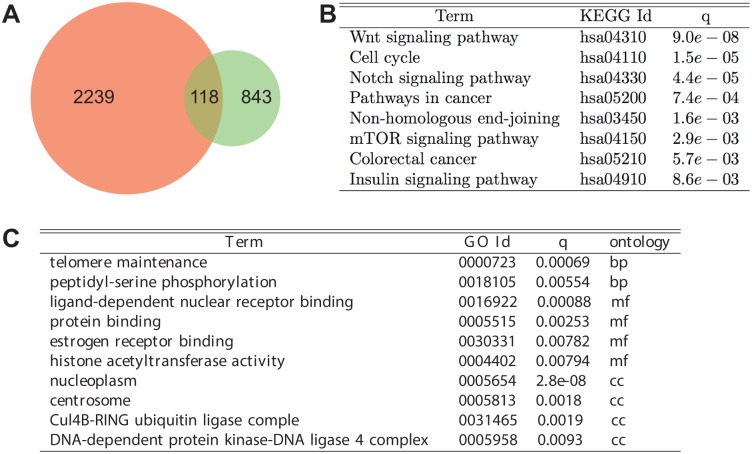
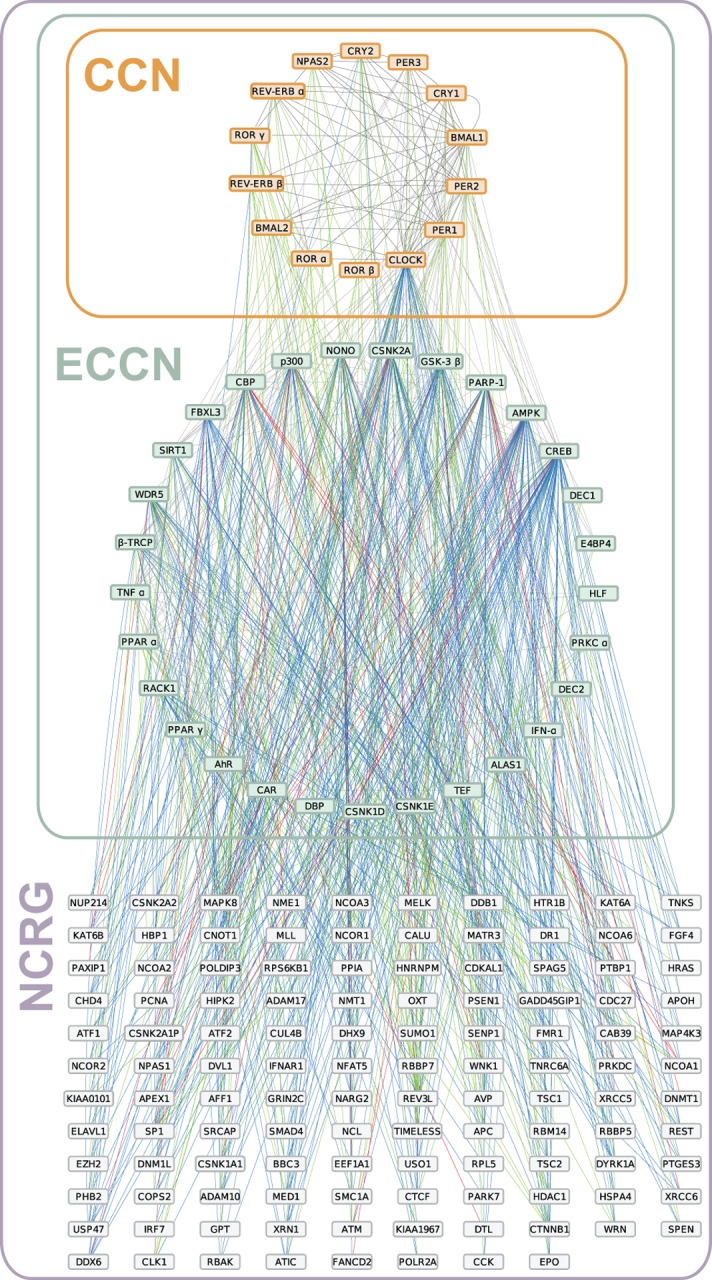
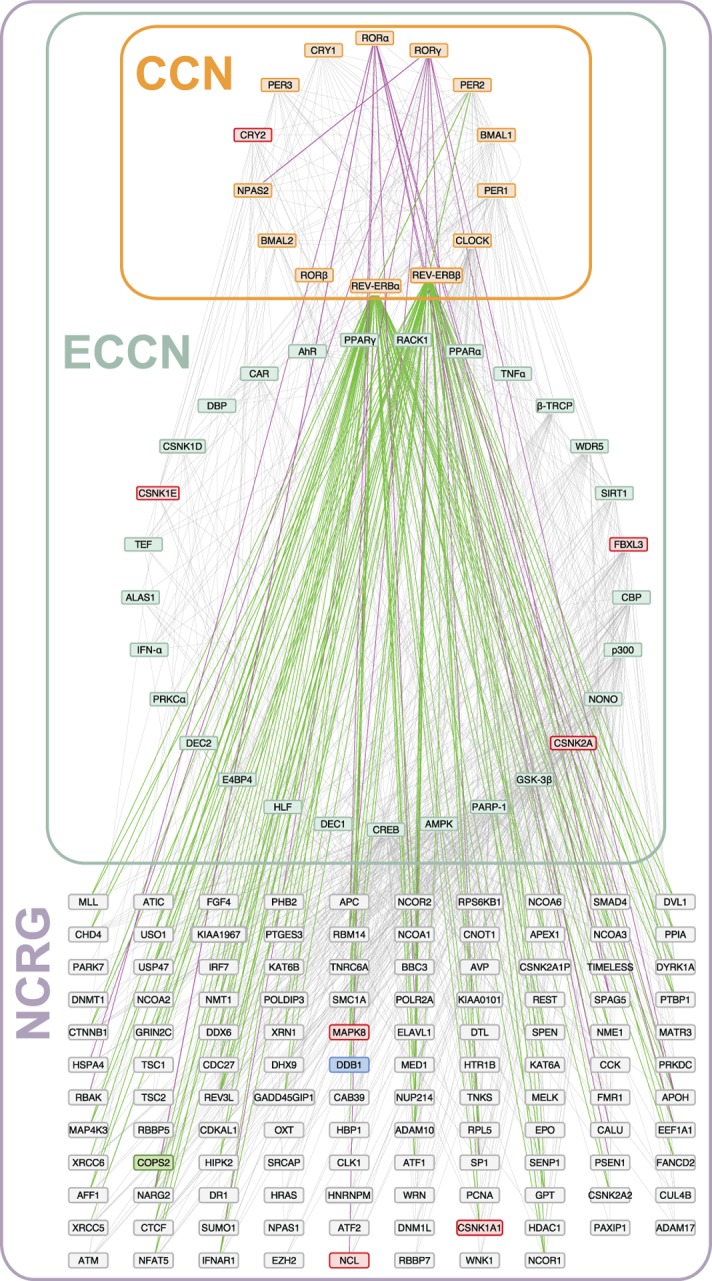
By regulating the timing of cellular processes, the circadian clock provides a way to adapt physiology and behaviour to the geophysical time. In mammals, a light-entrainable master clock located in the suprachiasmatic nucleus (SCN) controls peripheral clocks that are present in virtually every body cell. Defective circadian timing is associated with several pathologies such as cancer and metabolic and sleep disorders. To better understand the circadian regulation of cellular processes, we developed a bioinformatics pipeline encompassing the analysis of high-throughput data sets and the exploitation of published knowledge by text-mining. We identified 118 novel potential clock-regulated genes and integrated them into an existing high-quality circadian network, generating the to-date most comprehensive network of circadian regulated genes (NCRG). To validate particular elements in our network, we assessed publicly available ChIP-seq data for BMAL1, REV-ERBα/β and RORα/γ proteins and found strong evidence for circadian regulation of Elavl1, Nme1, Dhx6, Med1 and Rbbp7 all of which are involved in the regulation of tumourigenesis. Furthermore, we identified Ncl and Ddx6, as targets of RORγ and REV-ERBα, β, respectively. Most interestingly, these genes were also reported to be involved in miRNA regulation; in particular, NCL regulates several miRNAs, all involved in cancer aggressiveness. Thus, NCL represents a novel potential link via which the circadian clock, and specifically RORγ, regulates the expression of miRNAs, with particular consequences in breast cancer progression. Our findings bring us one step forward towards a mechanistic understanding of mammalian circadian regulation, and provide further evidence of the influence of circadian deregulation in cancer.


Conflict of interest statement

Competing Interests: The authors have declared that no competing interests exist.

Figures

Fig 1
Fig 1. Work flow used to establish a network of circadian regulated genes (NCRG).
Two independent data types were used to predict genes which interact with the human core clock network (CCN, orange) and the extended core clock network (ECCN, green). Co-expression data was used to find sets of genes with strongest (anti-) correlating expression with the 43 ECCN genes across a large number of independent experiments. A total of 2357 genes were found to interact with more than 2 ECCN genes. The GeneView text-mining pipeline was used to analyse published knowledge (approximately 22 million citations) about interacting genes. A total of 961 text-mining-predicted genes were found. The intersection of both methodologies resulted in 118 new genes, which together with the ECCN form a new network of circadian regulated genes (NCRG, purple).
Fig 2
Fig 2. The human core clock network (CCN) and the extended core clock network (ECCN).
The CCN (orange) contains the known core-clock elements (Per1,2,3, Cry1,2, Rev-Erbα,β, Rorα,β,γ, Bmal1,2, Clock and Npas). The ECCN (green) was obtained after an extensive collection of CCN-interacting genes followed by a detailed curation for direct interactions [21] and a further update to the recent literature. Activation (green lines), inhibition (red lines) and other sort of interactions (grey lines) are represented. The resulting clock network contains 43 elements and more than 200 regulatory relationships.
Fig 3
Fig 3. Correlation distributions for clock network gene pairs versus random gene pairs.
The cumulative Pearson ρ distributions of pairs of ECCN genes reported to interact but excluding CCN (ECCN, green), reported pairs of CCN genes (CCN, orange), and 43 randomly chosen genes versus all genes as background (BG, black) are shown for the Hsa2 data collection (A, B). Distributions are shown centred around 0 with the centred bin marked by the dashed red line. The Pearson ρ distributions of reported pairs of ECCN genes (green) is compared to not reported pairs (blue) for the data set Hsa2 (C, D). Comparison of Pearson ρ and mutual rank (E, F) between all possible pairs of ECCN genes (green) and all possible pairs of non-ECCN genes as background (black). All data were taken from the Hsa2 data collection.
Fig 4
Fig 4. Variation in functional annotation enrichment with increasing tightness between the predicted targets and the ECCN.
The significance of 28 enriched GO terms (A) and 16 KEGG terms (B) for genes connected to the CCN steadily decreases for most terms as the minimum number connections is increased (this number of connections between a gene and a gene set is here defined as "tightness"). As the minimum tightness between the predicted targets and the ECCN increases, the enrichment and rank of functional annotation changes. We observe an overall decrease in enrichment but little in rank. The greatest changes in rank occur between a tightness of 2 and 3. At a tightness of two and above, the rank of the majority of significant GO terms such as "mitotic cell cycle" and "nuclear mRNA splicing, via spliceosome", and KEGG terms such as "Spliceosome", "Ubiquitin mediated proteolysis" and "RNA degradation" remain largely stable suggesting a natural threshold on tightness at this point.
Fig 5
Fig 5. Homogenous functional spectrum of genes targeted by different ECCN genes.
The specific functions of genes interacting with each individual ECCN gene were counted and illustrated as heat map. Annotated KEGG pathways (A) and GO terms (B) found to be overrepresented amongst all predicted target genes in the preceding analysis were counted for each target gene, and these counts were then accumulated for each individual ECCN gene and represented as colours according to the legend. Rows and columns are ordered according to a hierarchical clustering.
Fig 6
Fig 6. Functional analysis of the consensus predicted ECCN target gene set.
Overlap between 2357 new ECCN elements (orange) based on expression pattern correlation and 961 genes obtained with text-mining methods (green) (A). This resulted in 118 new genes found by both methods. KEGG pathway annotation enrichment of the 118 consensus predicted genes (B) and corresponding GO enrichment (C).
Fig 7
Fig 7. Network representation of CCN/ECCN network together with the 118 predicted target genes (NCRG).
Boxes represent individual genes, which are connected by lines reflecting interactions that are known (grey), predicted by co-expression (blue), text-mining (green), or by both (red). The sub-networks are indicated by rectangles, the CCN (orange), the ECCN (green), and NCRG (purple).
Fig 8
Fig 8. Transcriptional regulation of the CCN/ECCN extension network of 118 genes by REV-ERB and ROR.
Regulatory interactions of REV-ERB α/β with NCRG genes (green lines) were derived from the locations of physical binding of these proteins in two ChIP-seq experiments [16, 17]. The ROR α/ γ interactions (purple lines) were adopted from the report of a third ChIP-seq experiment [22]. Genes with an observed phenotype in the genome-wide RNAi screen [28, 29] are shown with a coloured box, red indicating long period, blue a high amplitude, and green a short period.

References

    1. Lowrey PL, Takahashi JS. Genetics of circadian rhythms in Mammalian model organisms. Advances in genetics. 2011;74:175–230. 10.1016/B978-0-12-387690-4.00006-4 . - DOI - PMC - PubMed
    1. Albrecht U. Timing to perfection: the biology of central and peripheral circadian clocks. Neuron. 2012;74:246–60. 10.1016/j.neuron.2012.04.006 . - DOI - PubMed
    1. Bass J. Circadian topology of metabolism. Nature. 2012;491:348–56. 10.1038/nature11704 . - DOI - PubMed
    1. Kondratova AA, Kondratov RV. The circadian clock and pathology of the ageing brain. Nature reviews Neuroscience. 2012;13:325–35. 10.1038/nrn3208 . - DOI - PMC - PubMed
    1. Takahashi JS, Hong HK, Ko CH, McDearmon EL. The genetics of mammalian circadian order and disorder: implications for physiology and disease. Nature reviews Genetics. 2008;9:764–75. 10.1038/nrg2430 . - DOI - PMC - PubMed

Publication types

LinkOut - more resources