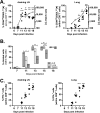
. 2015 May 6;11(5):e1004849.
doi: 10.1371/journal.ppat.1004849. eCollection 2015 May.

Human and Murine Clonal CD8+ T Cell Expansions Arise during Tuberculosis Because of TCR Selection

Affiliations

Human and Murine Clonal CD8+ T Cell Expansions Arise during Tuberculosis Because of TCR Selection

Cláudio Nunes-Alves et al. PLoS Pathog. .

Erratum in

Abstract

The immune system can recognize virtually any antigen, yet T cell responses against several pathogens, including Mycobacterium tuberculosis, are restricted to a limited number of immunodominant epitopes. The host factors that affect immunodominance are incompletely understood. Whether immunodominant epitopes elicit protective CD8+ T cell responses or instead act as decoys to subvert immunity and allow pathogens to establish chronic infection is unknown. Here we show that anatomically distinct human granulomas contain clonally expanded CD8+ T cells with overlapping T cell receptor (TCR) repertoires. Similarly, the murine CD8+ T cell response against M. tuberculosis is dominated by TB10.44-11-specific T cells with extreme TCRβ bias. Using a retro genic model of TB10.44-11-specific CD8+ Tcells, we show that TCR dominance can arise because of competition between clonotypes driven by differences in affinity. Finally, we demonstrate that TB10.4-specific CD8+ T cells mediate protection against tuberculosis, which requires interferon-γ production and TAP1-dependent antigen presentation in vivo. Our study of how immunodominance, biased TCR repertoires, and protection are inter-related, provides a new way to measure the quality of T cell immunity, which if applied to vaccine evaluation, could enhance our understanding of how to elicit protective T cell immunity.


Conflict of interest statement

The authors have declared that no competing interests exist.

Figures
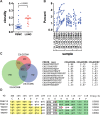
Fig 1
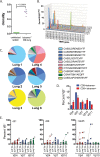
Fig 1. Human CD8+ T cells undergo clonal expansions in lung granulomas.
(a) Clonality of CD8+ TCR sequences obtained from pulmonary granulomas (n = 11) compared to PBMC from healthy donors (n = 26); p = 0.0002 by Mann-Whitney. (b) The frequency of the top ten clones in each sample. Clones shared between samples are connected with a line. (c) TCRVβ chains are shared among anatomically distinct granulomas from the same patient. A Venn diagram shows the overlap of unique TCRs from samples 23A, 23B, and 23C. The CDR3β amino acid sequences of the 10 most frequent clones that are shared by the 3 lesions are shown, along with their respective frequency in each lesion. (d) TCR selection suggested by distinct DNA sequences that encode the same CDR3β amino acid sequence. Sample 23LGCD8B contains five distinct recombination events encode the CDR3β amino acid sequence “CASSVDGGTEAFF.” Yellow shading, 3’ Vβ gene sequence; boxed sequence, D nucleotides; green shading, 5’ Jβ gene sequence; bold red letters indicate differences in the sequences. Other differences exist in the Vβ gene sequences. The respective frequency of each sequence is shown.
Fig 2
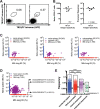
Fig 2. Clonal expansions of CD8+ T cells specific for the immunodominant antigen TB10.4.
(a) Clonality of CD8+ TCR sequences obtained from infected lung granulomas (n = 6) compared to splenocytes from uninfected mice (n = 9); p = 0.0004 by Mann-Whitney. (b,c) Frequency of TCR Vβ families (b) and CDR3βs (c) of TB10.44-11-specific CD8+ T cells from the lungs of C57BL/6J mice infected with M. tuberculosis for 9 weeks. Data were obtained by Next-generation sequencing of tetramer-purified T cells from 6 individual mice. (d) Frequency of TCR Vβ4 (TRBV2), Vβ5 (TRBV12), Vβ7 (TRBV29), Vβ10 (TRBV4) and Vβ11 (TRBV16) families of TB10.44-11-tetramer+CD8+T (red) or TB10.44-11-tetramer-CD8+T (blue) cells from the pulmonary LN of C57BL/6J mice infected with M. tuberculosis at 21 days post infection. (e) Frequency of TCR Vβ4 (TRBV2), Vβ7 (TRBV29) and Vβ10 (TRBV4) families of CD8+ T cells from the pulmonary LN or lung of C57BL/6J mice infected with M. tuberculosis at 21 days (left panel), 28 days (middle panel) or >25 weeks (right panel) post infection. Dotted lines connect data from individual mice, some of which are labeled (A through I) to highlight mice with biased Vβ family usage. Data were obtained by flow cytometric analysis of TB10.44-11-tetramer+CD8+ T cells (Tet+) or TB10.44-11-tetramer-CD8+ T cells (Tet-) from three independent experiments, each with 4–10 mice per group.
Fig 3
Fig 3. Precursor frequency of TB10.4-specific T cells.
(a,b) Frequency of TB10.44-11-specific CD8+ T cells in naïve C57BL/6J mice. (a) Represented are dot plots of dual tetramer staining in CD8+ T cells in the unbound (left) or bound (right) fractions after immunomagnetic enrichment using tetramers. (b) Quantification of TB10.44-11-specific CD8+ T cells in naïve C57BL/6J mice, either as the total number (left panel) or as the frequency among CD8+ T cells (right panel). Data are representative from two experiments with 6–10 mice. (c,d,e) Frequency of TB10.44-11-associated TCRβ DNA (c) or amino acid (d,e) sequences in the T cell repertoire of uninfected C57BL/6J mice. (c) The unique TB10.44-11-associated TCRβ DNA sequences from lung#2 were compared pairwise to the TCRβ repertoire of three uninfected mice (spleen A-C). The frequency of unique TCRβ DNA sequences from uninfected mice are on the y-axes (blue); from M. tuberculosis infected lung on the x-axes (red); and sequences detected in both samples are colored purple. The number of unique sequences in each class is indicated in parentheses. (d) A pairwise comparison of unique TB10.44-11-associated CDR3β amino acid sequences from lung#2 and uninfected spleen B. (e) The frequency distribution of unique CDR3β amino acid sequences in the uninfected TCR repertoire. ‘Uninfected’ consists of all sequences from uninfected C57BL/6 mice. ‘TB10-specific’ are the TB10-specific sequences found in the uninfected splenic repertoire; ‘shared sequences’ are TB10-specific sequences detected in more than 2 infected mice; ‘expanded sequences’ are all “shared sequences” with frequency >1% in at least one infected mouse. Box represents minimum and maximum, and bar and dot is the median frequency. NS, not significant; ****, p < 0.0001, by one-way ANOVA with Kruskal-Wallis post test.
Fig 4
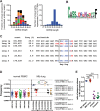
Fig 4. TB10.4-specific CD8+ T cells are selected during infection.
(a) Frequency distribution of CDR3β amino acid length of TB10.44-11-specific CD8+ T cells from the lungs of M. tuberculosis infected C57BL/6J mice. (b) Consensus analysis of the CDR3β amino acid sequence of TB10.44-11-specific CD8+ T cells with 14 amino acids in length. (c) VDJ DNA rearrangements for the public CDR3β CASSLDRENSDYTF found in four different C57BL/6J mice, showing Vβ (black), N (red), Dβ (blue), and Jβ (black) sequences. The count and frequency for each sequence in the respective lung is also shown. The box highlights the nucleotides that encode the conserved aspartic acid (Asp, “D”) and arginine (Arg, “R”) residues. (d) Frequency of human TCRs containing the “DREN” motif among normal PBMC or CD8+ T cells from TB patients. Each point represents a unique clonotype and their corresponding CDR3β amino acid sequences are shown for some. (e) Ratio of unique amino acid clones to nucleotide sequences in T cells from naïve and infected C57BL/6J mice. TCR sequences were analyzed from uninfected ‘B6 spleen’ (n = 3 mice); infected ‘Mtb lung’ (TB10.44-11-specific CD8+ T cells; n = 6 mice); or the following subsets of sequences: ‘frequent’ (>1% of the TB10-specific sequences) or ‘shared sequences’ (TB10.44-11-specific TCRs present in at least 2 mice). ****, p < 0.05 by one-way ANOVA and Holm-Sidak’s multiple comparison test.
Fig 5
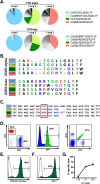
Fig 5. A retrogenic mouse model for TB10-specific CD8+ T cells.
(a) Frequency and amino acid sequences of CDR3α (top panel) and CDR3β (bottom panel) regions of TB10.44-11-specific CD8+ T cells from the lung of individual Vα2var mice infected with M. tuberculosis. Data were obtained by single-cell sorting and sequencing of 60–200 cells per mouse (n = 3). (b) Sequences of CDR3α (top panel) and CDR3β (bottom panel) amino acid sequences of the dominant clones of TB10.44-11-specific CD8+ T cells expanded in the lung of Vα2var mice infected with M. tuberculosis. Dashes are gaps introduced for purpose of sequence alignment. (c) VDJ rearrangement (CDR3β) of the dominant TB10.44-11-specific CD8+ clonotypes from the lung of Vα2var mice infected with M. tuberculosis, displaying Vβ (black), N (red), Dβ (blue), and Jβ (black) sequences. Boxed codon is the conserved arginine (Arg, “R”). (d,e) Flow-cytometry analysis of T cells from uninfected retrogenic mice expressing TCR3. (d) Represented are a dot plot of CD4 vs CD8 staining of CD3+ T cells (left panel), histograms of GFP expression within CD8+ T cells (middle panel), and a dot plot of Vα2 vs. Vβ11 staining in CD8+ T cells (right panel). Red, CD4+ T cells; blue, are colored in CD8+GFP- T cells; green, CD8+GFP+ T cells. The numbers represent: the frequency of CD4+ vs. CD8+ T cells among gated CD3+ T cells (left); the frequency of CD3+CD8+ cells that express GFP (middle); and the frequency of CD3+CD8+GFP+ cells that are Vα2+Vβ11+ (right). (e) Tetramer staining of CD8+GFP- T cells (dashed line) and CD8+GFP+ T cells (filled green histogram). The numbers represent the frequency of CD3+CD8+GFP+ cells that are stained by the tetramer. (f) IFNγ production by lung T cells from TCR3 retrogenic mice infected with M. tuberculosis. Lung cells were stimulated with TB10.44-11-peptide and analyzed by intracellular cytokine staining and flow cytometry. Represented are CD8+GFP+ T cells stimulated by TB10.44-11-peptide (filled green histogram) or left unstimulated (dashed line). The numbers represent the frequency of CD3+CD8+GFP+ cells that produce IFNγ after peptide stimulation. (g) Specific lysis of TB10.44-11-peptide pulsed EL4 targets by TCR3 retrogenic T cells at different effector to target ratios. Data are representative of >10 (d, e), >5 (f), and 3 (g) independent experiments.
Fig 6
Fig 6. Retrogenic T cell priming and acquisition of effector functions.
(a) Kinetic analysis of frequency (filled circles) and number (opened circles) of activated (CD44HiCD62LLo) Rg cells in the draining LN (left panel) and lung (right panel) following adoptive transfer into mice infected with M. tuberculosis. (b) Kinetic analysis of frequency of divided Rg cells in the draining LN, lung and spleen following adoptive transfer into mice infected with M. tuberculosis. (c) Kinetic analysis of frequency of IFNγ-producing Rg cells in the draining LN (left panel) and lung (right panel) following adoptive transfer into mice infected with M. tuberculosis. Data are representative from two (b) or three (a, c) independent experiments, each with 5 mice per group. (a,c) One way ANOVA with Dunnett’s post test to compare differences over time (vs. day 7 [a] or d11 [c]) time points. P<0.05 indicated by asterisks (phenotype or IFNγ) or hash marks (cell numbers). (b) One way ANOVA with Tukey’s post test to compare differences in proliferation between lung, LN and spleen; p<0.05 indicated by asterisks.
Fig 7
Fig 7. TAP1 and IFNγ are required for protection mediated by TB10-specific CD8+ T cells.
(a,b) Bacterial burden in the lung 21 days after adoptive transfer of in vitro stimulated Rg (a,b) or OT-I (a) CD8+ T cells into sub-lethally irradiated, M. tuberculosis-infected C57BL/6J (a,b) or TAP-1 deficient (b) recipients. (c) Bacterial burden in the lung 21 d after adoptive transfer of in vitro stimulated Rg, IFNγ-/- Rg, or OT-I CD8+ T cells into sub-lethally irradiated, M. tuberculosis-infected C57BL/6J recipients. (d) Survival curves after adoptive transfer of naïve Rg or IFNγ-/- Rg CD8+ T cells into M. tuberculosis-infected TCRα-/- recipients. Transfers used 106 cells/mouse in “b” and “c” or 105 cells/mouse in “d”. Statistical significance calculated using the method of the Log-rank (Mantel-Cox) test. Data are representative from two independent experiments, each with at least 5 mice per group. Other statistical testing done by one-way ANOVA and ad hoc post tests. NS, not significant; *, p < 0.05.
Fig 8
Fig 8. Differences in TCR affinity can lead to clonotypic dominance during infection.
(a) Flow-cytometry analysis of affinity of Rg T cells from uninfected retrogenic mice expressing TCR3 (open circles) or TCR4 (filled circles), based on the frequency of tetramer staining of Rg cells across multiple tetramer concentrations. (b,c) Kinetic analysis of frequency (b) and number (c) of TCR3 (open symbols) or TCR4 (filled symbols) Rg cells in the draining LN (left panels) and lung (right panels) following adoptive co-transfer into mice infected with M. tuberculosis. Data are representative from two (b, c) or three (a) independent experiments, each with 5 mice per group. (b, c) Two way ANOVA with Holm-Sidak’s multiple comparison test; *, p < 0.05).

Similar articles

Cited by

References

    1. Davis MM, Bjorkman PJ (1988) T-cell antigen receptor genes and T-cell recognition [published erratum appears in Nature 1988 Oct 20;335(6192):744]. Nature 334: 395–402. - PubMed
    1. Venturi V, Price DA, Douek DC, Davenport MP (2008) The molecular basis for public T-cell responses? Nature Reviews Immunology 8: 231–238. 10.1038/nri2260 - DOI - PubMed
    1. Jenkins MK, Chu HH, McLachlan JB, Moon JJ (2010) On the composition of the preimmune repertoire of T cells specific for Peptide-major histocompatibility complex ligands. Annual Review of Immunology 28: 275–294. 10.1146/annurev-immunol-030409-101253 - DOI - PubMed
    1. Plumlee CR, Sheridan BS, Cicek BB, Lefrancois L (2013) Environmental cues dictate the fate of individual CD8+ T cells responding to infection. Immunity 39: 347–356. 10.1016/j.immuni.2013.07.014 - DOI - PMC - PubMed
    1. Obar JJ, Khanna KM, Lefrancois L (2008) Endogenous naive CD8+ T cell precursor frequency regulates primary and memory responses to infection. Immunity 28: 859–869. 10.1016/j.immuni.2008.04.010 - DOI - PMC - PubMed

Publication types

MeSH terms