Case Reports
. 2015 May 6;10(5):e0123975.
doi: 10.1371/journal.pone.0123975. eCollection 2015.

Patient-specific detection of cerebral blood flow alterations as assessed by arterial spin labeling in drug-resistant epileptic patients

Affiliations
Case Reports

Patient-specific detection of cerebral blood flow alterations as assessed by arterial spin labeling in drug-resistant epileptic patients

Ilaria Boscolo Galazzo et al. PLoS One. .

Abstract

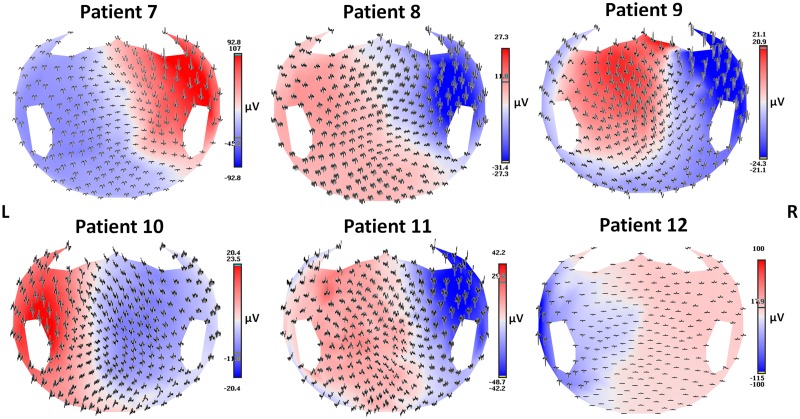
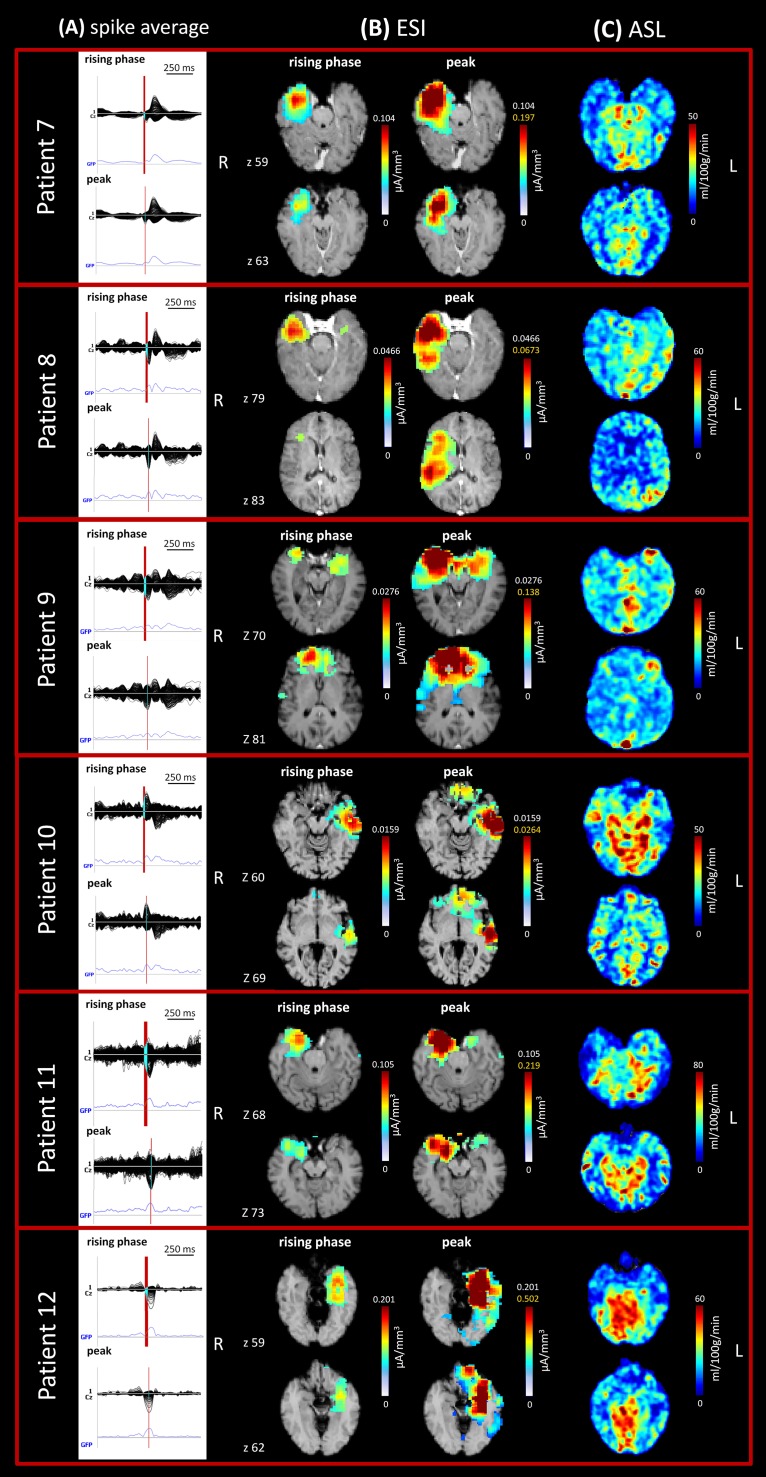
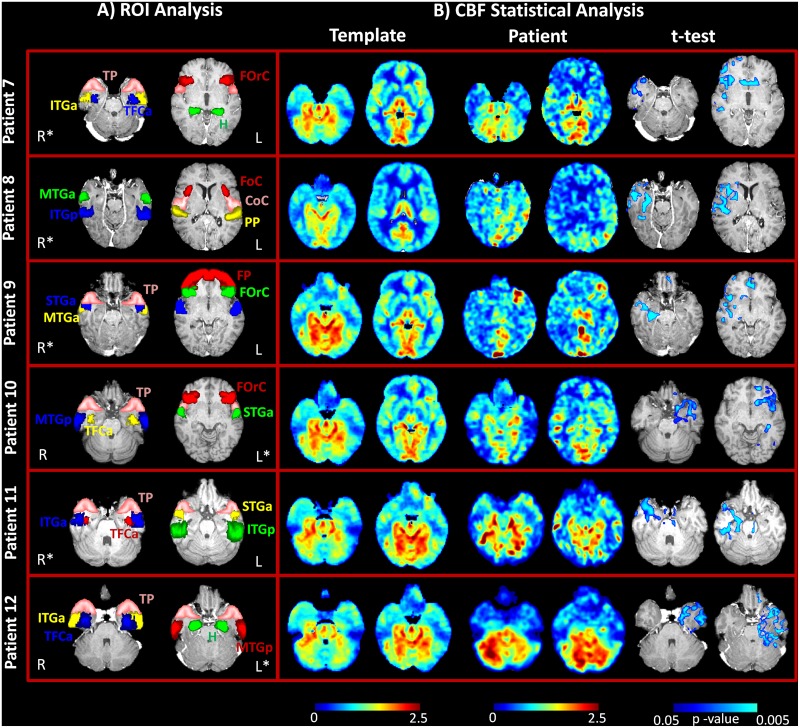
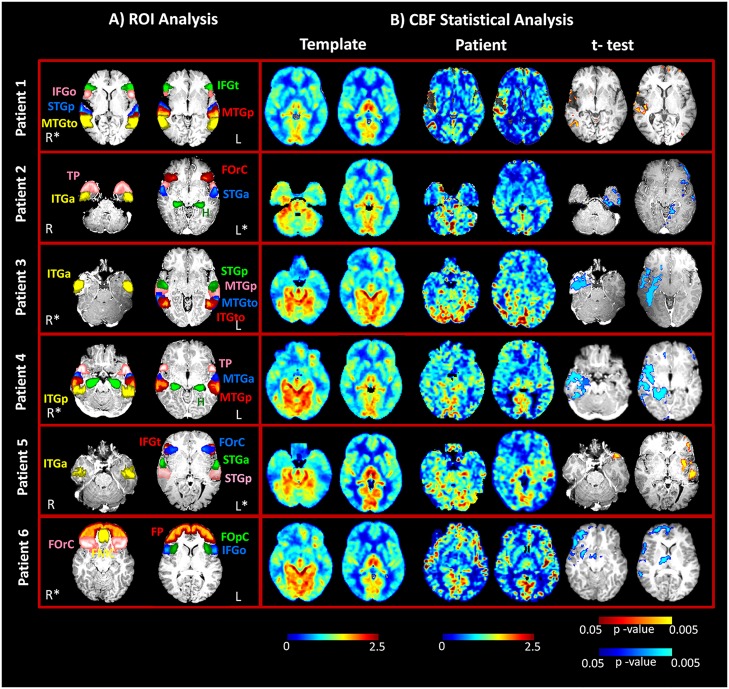
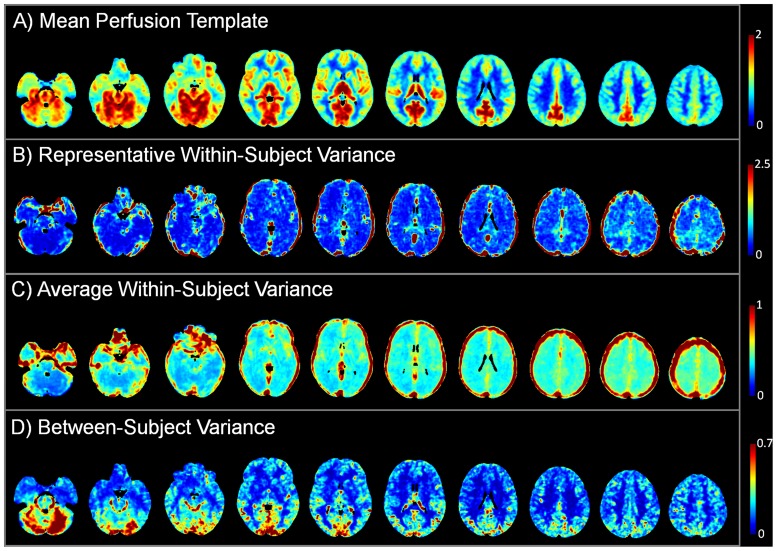
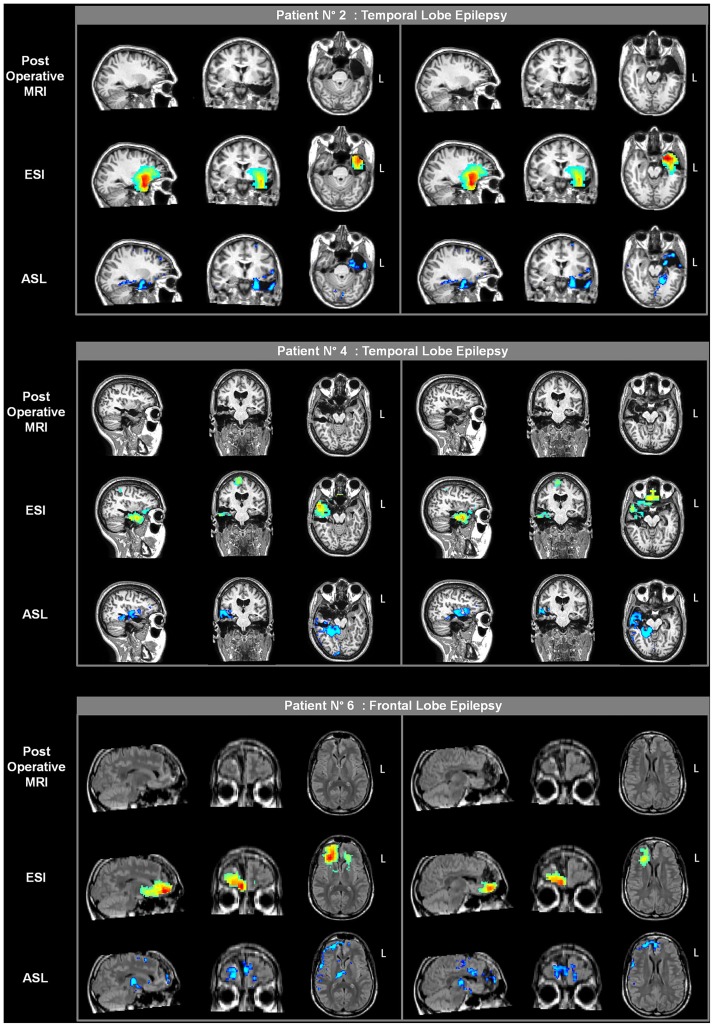
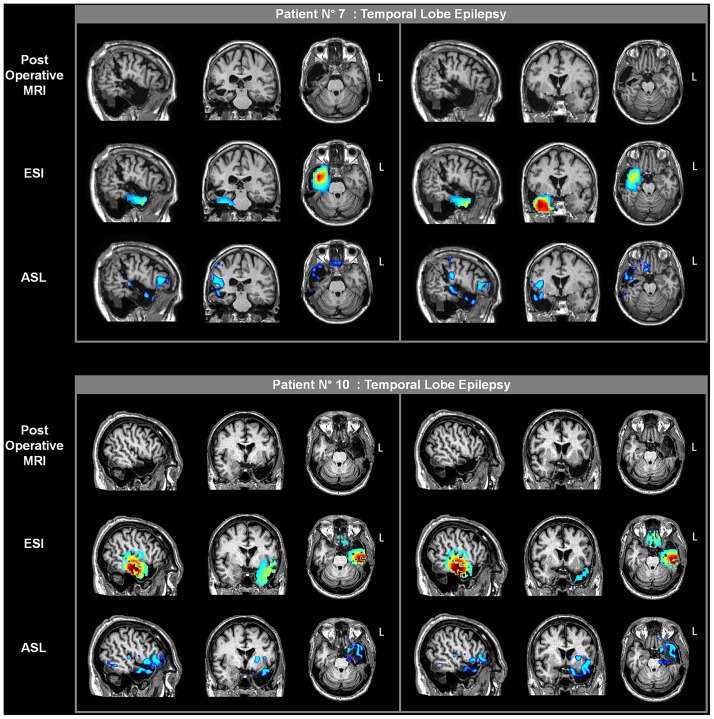
Electrophysiological and hemodynamic data can be integrated to accurately and precisely identify the generators of abnormal electrical activity in drug-resistant focal epilepsy. Arterial Spin Labeling (ASL), a magnetic resonance imaging (MRI) technique for quantitative noninvasive measurement of cerebral blood flow (CBF), can provide a direct measure of variations in cerebral perfusion associated with the epileptic focus. In this study, we aimed to confirm the ASL diagnostic value in the identification of the epileptogenic zone, as compared to electrical source imaging (ESI) results, and to apply a template-based approach to depict statistically significant CBF alterations. Standard video-electroencephalography (EEG), high-density EEG, and ASL were performed to identify clinical seizure semiology and noninvasively localize the epileptic focus in 12 drug-resistant focal epilepsy patients. The same ASL protocol was applied to a control group of 17 healthy volunteers from which a normal perfusion template was constructed using a mixed-effect approach. CBF maps of each patient were then statistically compared to the reference template to identify perfusion alterations. Significant hypo- and hyperperfused areas were identified in all cases, showing good agreement between ASL and ESI results. Interictal hypoperfusion was observed at the site of the seizure in 10/12 patients and early postictal hyperperfusion in 2/12. The epileptic focus was correctly identified within the surgical resection margins in the 5 patients who underwent lobectomy, all of which had good postsurgical outcomes. The combined use of ESI and ASL can aid in the noninvasive evaluation of drug-resistant epileptic patients.


Conflict of interest statement

Competing Interests: The authors have declared that no competing interests exist.

Figures

Fig 1
Fig 1. Average spike voltage maps.
Spike average (epochs of 1 s) of interictal activities visualized according to the projected location of the scalp electrodes in the six patients.
Fig 2
Fig 2. Imaging analysis results in the six patients (patients nos. 7–12) with focal epilepsy.
ESI and ASL images of the same anatomical space were acquired for each patient and two axial sections are shown (z coordinates in native space). (A) Spike average: 256-channel EEG traces with a duration of 1 s (spike average). The global field power is used for the onset (red line). (B) ESI results: EEG source imaging at 50% rising phase of the peak (up) and at the peak (down). The scale indicates the current density (CD) [μA/mm3]. (C) ASL results. The scale indicates the cerebral blood flow (CBF) values [ml/100g/min].
Fig 3
Fig 3. ASL imaging results in the new group of six patients (patients nos. 7–12) with focal epilepsy.
A) Regions of interest (ROIs) for the quantification of current density (CD) and cerebral blood flow (CBF) values at the same anatomical level in each subject. ROIs are superimposed over axial T1-weighted slices in MNI space. B) Statistical analysis results from the template-based comparison. CBF maps (normalized values) for the same axial slices reported in part A) are shown here for the control group (template) and patients, together with the statistical map. In all patients, only areas with a statistically significant decrease in perfusion as compared to the healthy subjects were detected (blue scale, FDR corrected, q < 0.05).
Fig 4
Fig 4. ASL imaging results in the six focal epilepsy patients described in the previous study (patients nos. 1–6).
A) Regions of interest for quantification of current density (CD) and cerebral blood flow (CBF) values at the same anatomical level in each subject. ROIs are superimposed over axial T1-weighted slices in MNI space. B) Statistical analysis results from the template-based comparison. CBF maps (normalized values) for the same axial slices reported in part A) are shown here for the control group (template) and patients, together with the statistical map. Areas with a statistically significant decrease in perfusion (hypoperfusion), as compared to the healthy subjects, were detected in four patients (blue scale, FDR corrected, q < 0.05). Conversely, areas with a statistically significant increase in perfusion (hyperperfusion), as compared to the healthy subjects, were detected in two patients (yellow scale, FDR corrected, q < 0.05).
Fig 5
Fig 5. Parameter estimates for the normal perfusion template, computed from the control group.
A) Mean CBF estimates expressed in normalized units. B) Within-subject variance, estimated from the temporal information given by the multiple repetitions, for a representative subject. C) Average within-subject variance in the control group. D) Between-subject variance estimated from the heteroscedastic model. Axial slices of interest are displayed in radiological convention.
Fig 6
Fig 6. Postoperative imaging in three patients from the previously described patient group (patients nos. 2, 4 and 6).
The presurgical ESI and ASL results are overlaid on the coregistered postoperative MRI scans of each patient. Two different sections are shown for each plane (sagittal, coronal and axial). The rising phase of activity and the statistical results from the one-versus-many analysis are presented for ESI and ASL, respectively.
Fig 7
Fig 7. Postoperative imaging in two patients of the new group (patients. nos. 7 and 10).
The presurgical ESI and ASL results are overlaid on the coregistered postoperative MRI scans for each patient. Two different sections are shown for each plane (sagittal, coronal and axial). The rising phase of activity and the statistical results from the one-versus-many analysis are presented for ESI and ASL, respectively.

References

    1. Vulliemoz S, Carmichael DW, Rosenkranz K, Diehl B, Rodionov R, Walker MC, et al. Simultaneous intracranial EEG and fMRI of interictal epileptic discharges in humans. Neuroimage 2011; 54: 182–190. 10.1016/j.neuroimage.2010.08.004 - DOI - PubMed
    1. Pittau F, Grouiller F, Spinelli L, Seeck M, Michel CM, Vulliemoz S. The Role of Functional Neuroimaging in Pre-Surgical Epilepsy Evaluation. Front Neurol. 2014; 5:31 10.3389/fneur.2014.00031 - DOI - PMC - PubMed
    1. Wiebe S, Blume WT, Girvin JP, Eliasziw M. A randomized, controlled trial of surgery for temporal-lobe epilepsy. N Engl J Med. 2001; 345: 311–318. - PubMed
    1. Téllez-Zenteno JF, Dhar R, Wiebe S. Long-term seizure outcomes following epilepsy surgery: a systematic review and meta-analysis. Brain 2005; 128: 1188 –1198. - PubMed
    1. Panzica F, Varotto G, Rotondi F, Spreafico R, Franceschetti S. Identification of the Epileptogenic Zone from Stereo-EEG Signals: A Connectivity-Graph Theory Approach. Front Neurol 2013; 4:175 10.3389/fneur.2013.00175 - DOI - PMC - PubMed

Publication types

LinkOut - more resources