. 2015 May 7:13:146.
doi: 10.1186/s12967-015-0511-3.

Fatty acid synthase overexpression: target for therapy and reversal of chemoresistance in ovarian cancer

Affiliations

Fatty acid synthase overexpression: target for therapy and reversal of chemoresistance in ovarian cancer

Dirk O Bauerschlag et al. J Transl Med. .

Abstract

Background: Fatty acid synthase (FASN) is crucial to de novo long-chain fatty acid synthesis, needed to meet cancer cells' increased demands for membrane, energy, and protein production.

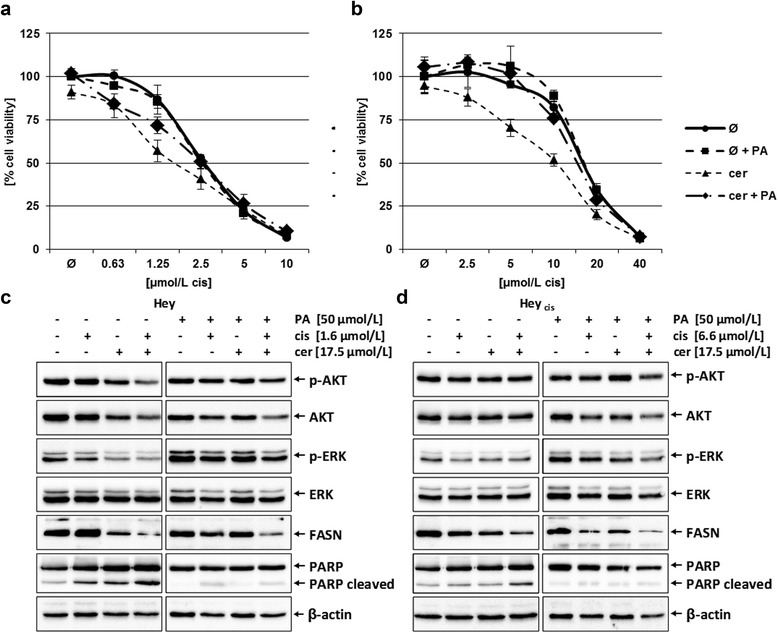
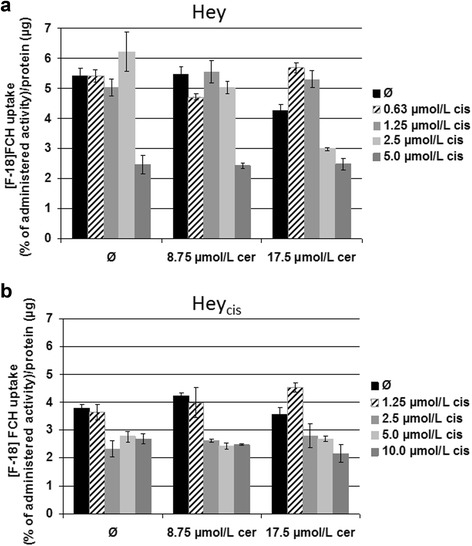
Methods: We investigated FASN overexpression as a therapeutic and chemosensitization target in ovarian cancer tissue, cell lines, and primary cell cultures. FASN expression at mRNA and protein levels was determined by quantitative real-time polymerase chain reaction and immunoblotting and immunohistochemistry, respectively. FASN inhibition's impact on cell viability, apoptosis, and fatty acid metabolism was assessed by 3-(4,5-dimethylthiazol-2-yl)-2,5-diphenyltetrazolium-bromide assay, cell death detection enzyme-linked immunosorbent assay, immunoblotting, and (18) F-fluoromethylcholine uptake measurement, respectively.

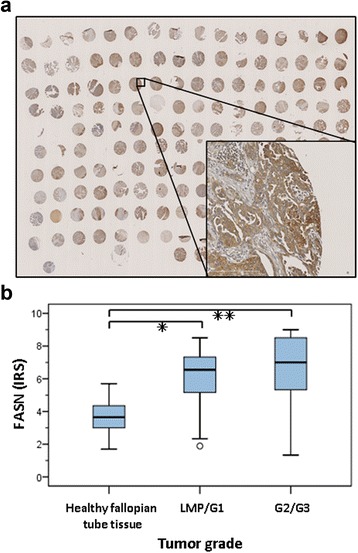
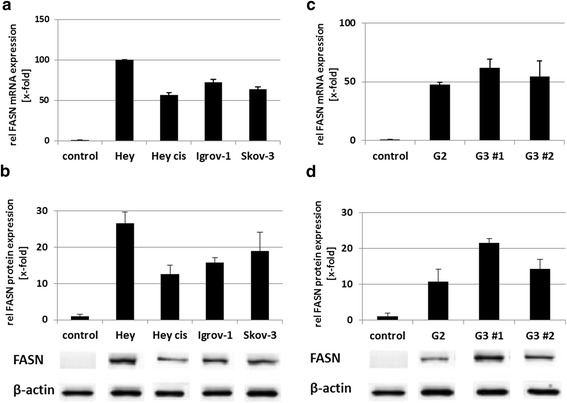
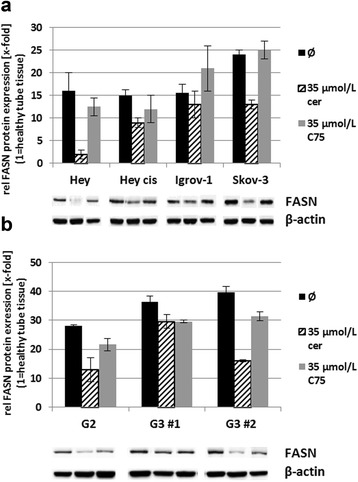
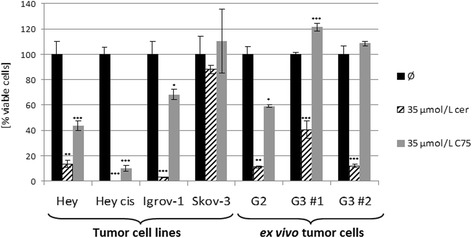
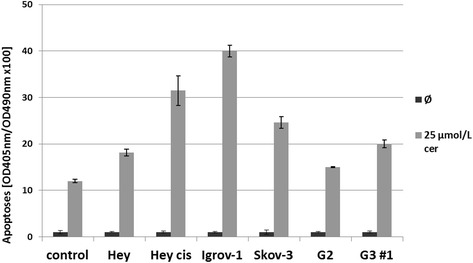
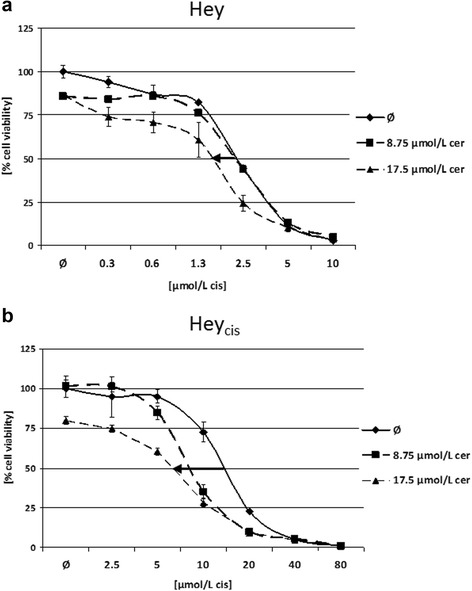
Results: Relative to that in healthy fallopian tube tissue, tumor tissues had 1.8-fold average FASN protein overexpression; cell lines and primary cultures had 11-fold-100-fold mRNA and protein overexpression. In most samples, the FASN inhibitor cerulenin markedly decreased FASN expression and cell viability and induced apoptosis. Unlike concomitant administration, sequential cerulenin/cisplatin treatment reduced cisplatin's half maximal inhibitory concentration profoundly (up to 54%) in a cisplatin-resistant cell line, suggesting platinum (re)sensitization. Cisplatin-resistant cells displayed lower (18) F-fluoro-methylcholine uptake than did cisplatin-sensitive cells, suggesting that metabolic imaging might help guide therapy.

Conclusions: FASN inhibition induced apoptosis in chemosensitive and platinum-resistant ovarian cancer cells and may reverse cisplatin resistance.


Figures

Figure 1
Figure 1
Immunhistochemical analyses of fasn protein expression in patient material. Immunhistochemical analyses of FASN protein expression in a TMA comprising formalin-fixed, paraffin-embedded samples of ovarian cancers of different grades (6 LMP, 9 G1, 42 G2, and 47 G3 tumors) and histological subtypes (serous papillary, mucinous, or endometrioid) from 104 patients versus in 12 healthy fallopian tissue samples. (a) Representative TMA slide immunohistochemically-stained with FASN antibody showed strong FASN expression in ovarian cancer. (b) Statistical evaluation of FASN expression applying the immunoreactive score (IRS), which incorporates protein staining intensity and the percentage of protein-positive cells. Statistically significant FASN overexpression was proven for LMP/G1 tumors or G2/G3 tumors vs. normal tissues (respectively *P < 0.005 and **P < 0.001, U test).
Figure 2
Figure 2
FASN mRNA and protein expression in cell lines and ex vivo tumor material. FASN mRNA and protein expression in the (cisplatin-resistant*) ovarian cancer cell lines, Hey, Heycis*, Igrov-1 and Skov-3 and in ex vivo tumor material relative (rel) to that in healthy fallopian tube tissue (control). (a) By qRT–PCR, all cell lines displayed FASN mRNA overexpression ranging from 56-fold to 100-fold. (b) By WB, FASN protein expression was enhanced in all cell lines (12-fold–27-fold). Representative immunoblots for FASN and β-actin (control) of each respective cell line are depicted below the graph. (c) By qRT-PCR, FASN mRNA expression was analyzed in primary cultures derived from moderately-differentiated and poorly-differentiated ovarian cancers (G2, G3 #1, and G3 #2) and healthy fallopian tube tissue (control). The cancer cells showed a median (min.–max.) 54-fold (47-fold–62-fold) FASN mRNA overexpression. (d) By WB, FASN protein expression was 11-fold– 22-fold stronger in the primary ovarian cancer cell cultures G2, G3 #1, and G3 #2. Representative immunoblots for FASN and β-actin (control) of each respective primary culture are depicted below the graph.
Figure 3
Figure 3
Effect of the FASN inhibitors cerulenin and C75 on FASN expression. Effect of the FASN inhibitors cerulenin and C75 on FASN expression of ovarian cancer cell lines and ex vivo tumor material. (a) Immunoblot and quantitative analyses of relative (rel) FASN protein expression of the four selected ovarian cancer cell lines Hey, Heycis, Igrov-1, and Skov-3 when untreated (Ø) or after treatment with cerulenin (cer) or C75. Treatment with 35 μmol/L cerulenin typically markedly reduced FASN protein expression, whereas treatment with 35 μmol/L C75 caused just a slight diminution or no diminution of such expression in the investigated cell lines. (b) Immunoblot and quantitative analyses of relative (rel) FASN protein expression of primary ovarian cancer cell cultures G2, G3 #1, and G3 #2 when untreated (Ø) or after treatment with cerulenin (cer) or C75. As in the cell lines, in two of three cases the inhibitory effect of cerulenin exceeded that of C75.
Figure 4
Figure 4
Effect of the FASN inhibitors cerulenin and C75 on cell viability. Effect of the FASN inhibitors cerulenin and C75 on cell viability of ovarian cancer cell lines and ex vivo tumor material. The four selected ovarian cancer cell lines, Hey, Heycis, Igrov-1, and Skov-3, and primary ovarian cancer cell cultures G2, G3 #1, and G3 #2 were treated with either 35 μmol/L cerulenin or 35 μmol/L C75. Cell viability was investigated by the MTT assay. Except in the multidrug-resistant cell line Skov-3, the growth of which was hardly affected by either FASN inhibitor, cerulenin (cer) achieved a stronger reduction of cell viability, ≥90% in the other illustrated ovarian cancer cell lines and in two of three primary cancer cell cultures. By contrast, C75 caused <50% inhibition in the Hey and Igrov-1 cell lines and the G2 cell culture and no inhibition in the G3 cell cultures, relative to untreated cells/controls (Ø) (***P < 0.001; **P < 0.01; *P < 0.05).
Figure 5
Figure 5
Effect of the FASN inhibitor cerulenin on apoptosis. Effect of cerulenin on apoptosis in ovarian cancer cell lines and ex vivo tumor material. CDDE was used to analyze programmed cell death in the four selected ovarian cancer cell lines, Hey, Heycis, Igrov-1, and Skov-3, and two primary ovarian cancer cell cultures G2 and G3 #1, after administration of 25 μmol/L cerulenin. Caspase activation was increased from 1.5- to 3.3-fold in the ovarian cancer cell lines and from 1.3- to 1.7-fold in the ex vivo cancer cells relative to that (caspase activation induced by cerulenin to 12x100) in healthy tube tissue cells (controls; Ø). Optical density (OD) = 405 nm (490-nm reference wavelength).
Figure 6
Figure 6
Effect of combined cerulenin/cisplatin treatment on cell viability. Effect of combined cerulenin/cisplatin treatment in the Hey (a) and cisplatin-resistant Heycis (b) cell lines. Cisplatin was given in various concentrations as a single agent or following administration of 8.75 μmol/L or 17.5 μmol/L cerulenin. As illustrated by the bold black arrows, sequential application of cerulenin for 6 h, followed by 72 h incubation in cisplatin-containing media shifted the cisplatin half maximum inhibitory concentration (IC50) from 2.3 μmol/L to 1.6 μmol/L (30% reduction; P = 0.004) in parental Hey cells and from 14.5 μmol/L to 6.6 μmol/L (54% reduction; P < 0.001) in the cisplatin-resistant Heycis cells.
Figure 7
Figure 7
Effect of PA supplementation to combined cerulenin/cisplatin treatment in the Hey (a, c) and cisplatin-resistant Heycis (b, d) cells analyzing cell viability and proliferation and apoptosis. (a, b) Cisplatin was given in various concentrations as a single agent or following administration of 17.5 μmol/L cerulenin in the absence or presence of 50 μmol/L PA. Cell viability was investigated by the MTT assay. The shifted cisplatin IC50 from 2.7 μmol/L to 1.8 μmol/L (33% reduction; P = 0.007) in parental Hey cells after sequential application of cerulenin for 6 h, followed by 72 h incubation in cisplatin-containing media was completely reversed by administration of PA (both cisplatin IC50 of 2.6 μmol/L; P = 0.02) (a). In the Heycis cell line the shifted IC50 from 16.8 μmol/L to 10.5 μmol/L (38% reduction; P = 0.003) was partly abrogated by administration of PA (shifted cisplatin IC50 from 17.1 μmol/L to 15.5 μmol/L (only 9% reduction; P = 0.03) (b). (c, d) Immunoblot analyses of phospho-AKT, AKT, phospho-ERK, ERK, FASN, PARP (total and cleaved) and β-actin (control) protein expression was investigated in in the Hey (c) and Heycis (d) cell lines after either single or combined cerulenin/cisplatin treatment in the absence or presence of PA with indicated concentrations. In the Hey cell line the slight dephosphorylation of AKT by combined treatment of cerulenin and cisplatin was less in the cells additionally treated with PA. In both the Hey and Heycis cell lines the reduction of the active pro-proliferative kinase phospho-ERK by drug treatment failed to appear in the additionally PA treated cells. Also, in both cell lines cerulenin diminished FASN protein expression in absence or presence of PA, but the significant induction of apoptosis (PARP cleavage) was prevented by adminstration of PA. (Quantitative analyses are provided in the Supplementary Materials – Additional file 2: Table S1.)
Figure 8
Figure 8
18 F-FCH uptake as a percentage of the administered activity normalized to protein content. 18 F-FCH uptake as a percentage of the administered activity normalized to protein content in the Hey (a) and cisplatin-resistant Heycis (b) cell lines. Cisplatin-resistant Heycis cells demonstrated lower mean 18 F-FCH uptake compared to parental Hey cells (5.42% ± 0.23% vs. 3.79% ± 0.14% of administered activity). At 2.5 μmol/L cisplatin, both tested cerulenin concentrations decreased 18 F-FCH uptake in cisplatin-resistant Heycis cells. For the parental Hey cells, this effect was only detectable at the higher cerulenin concentration. Treatment with cerulenin alone did not affect the cellular uptake of 18 F-FCH in any tested cell line. cis = cisplatin; cer = cerulenin.

References

    1. Eltabbakh GH, Awtrey CS. Current treatment for ovarian cancer. Expert Opin Pharmacother. 2001;2:109–24. doi: 10.1517/14656566.2.1.109. - DOI - PubMed
    1. du Bois A, Luck HJ, Meier W, Adams HP, Mobus V, Costa S, et al. A randomized clinical trial of cisplatin/paclitaxel versus carboplatin/paclitaxel as first-line treatment of ovarian cancer. J Natl Cancer Inst. 2003;95:1320–9. doi: 10.1093/jnci/djg036. - DOI - PubMed
    1. Jelovac D, Armstrong DK. Recent progress in the diagnosis and treatment of ovarian cancer. CA Cancer J Clin. 2011;61:183–203. doi: 10.3322/caac.20113. - DOI - PMC - PubMed
    1. Kuhajda FP, Pizer ES, Li JN, Mani NS, Frehywot GL, Townsend CA. Synthesis and antitumor activity of an inhibitor of fatty acid synthase. Proc Natl Acad Sci U S A. 2000;97:3450–4. doi: 10.1073/pnas.97.7.3450. - DOI - PMC - PubMed
    1. Kuhajda FP. Fatty-acid synthase and human cancer: new perspectives on its role in tumor biology. Nutrition. 2000;16:202–8. doi: 10.1016/S0899-9007(99)00266-X. - DOI - PubMed

Publication types

MeSH terms