. 2015 May 19;112(20):E2705-14.
doi: 10.1073/pnas.1503348112. Epub 2015 May 6.

Modulation of extrasynaptic NMDA receptors by synaptic and tonic zinc

Affiliations

Modulation of extrasynaptic NMDA receptors by synaptic and tonic zinc

Charles T Anderson et al. Proc Natl Acad Sci U S A. .

Abstract

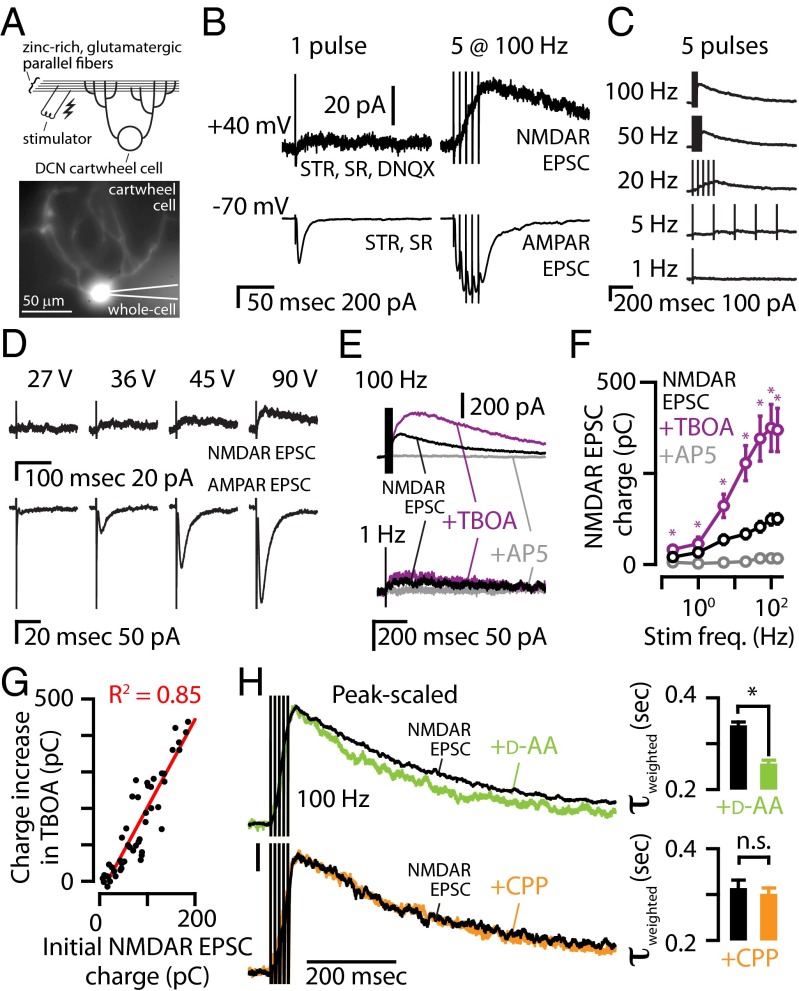
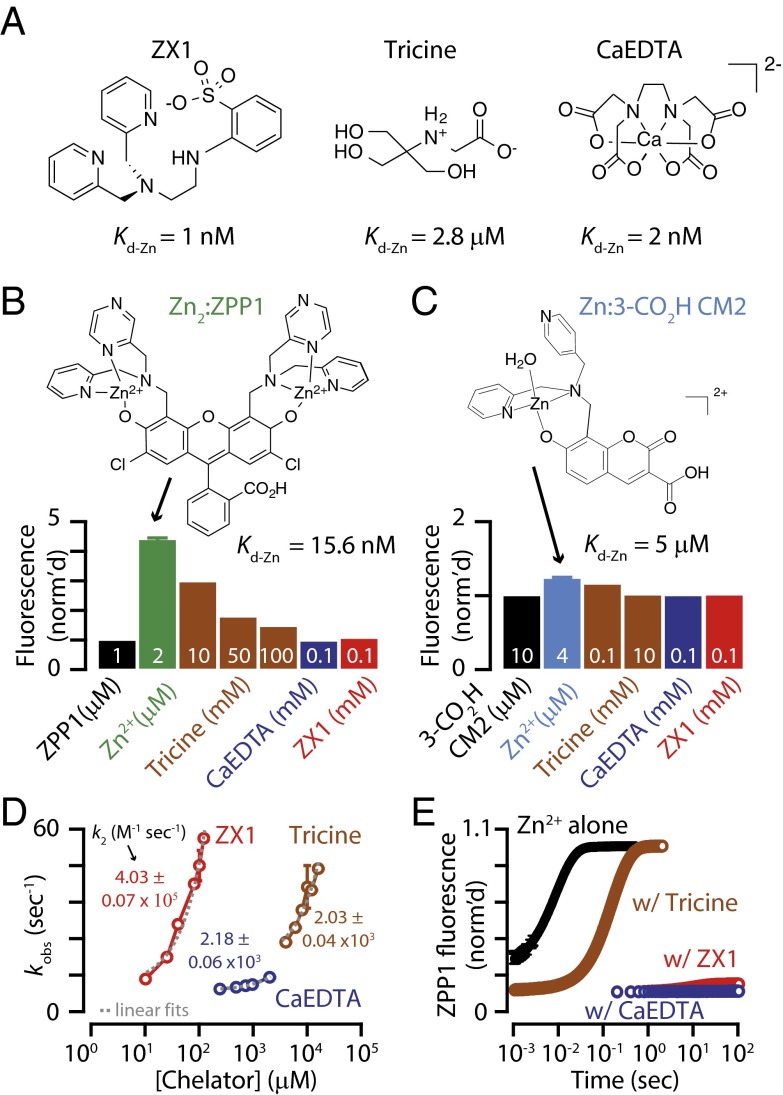
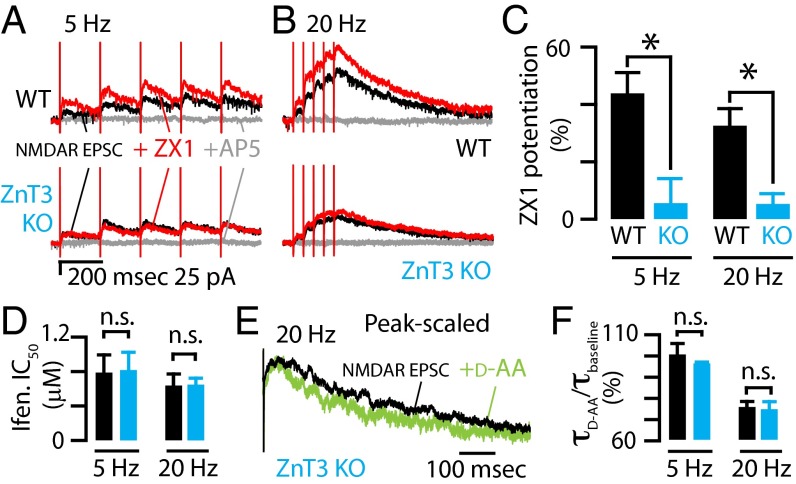
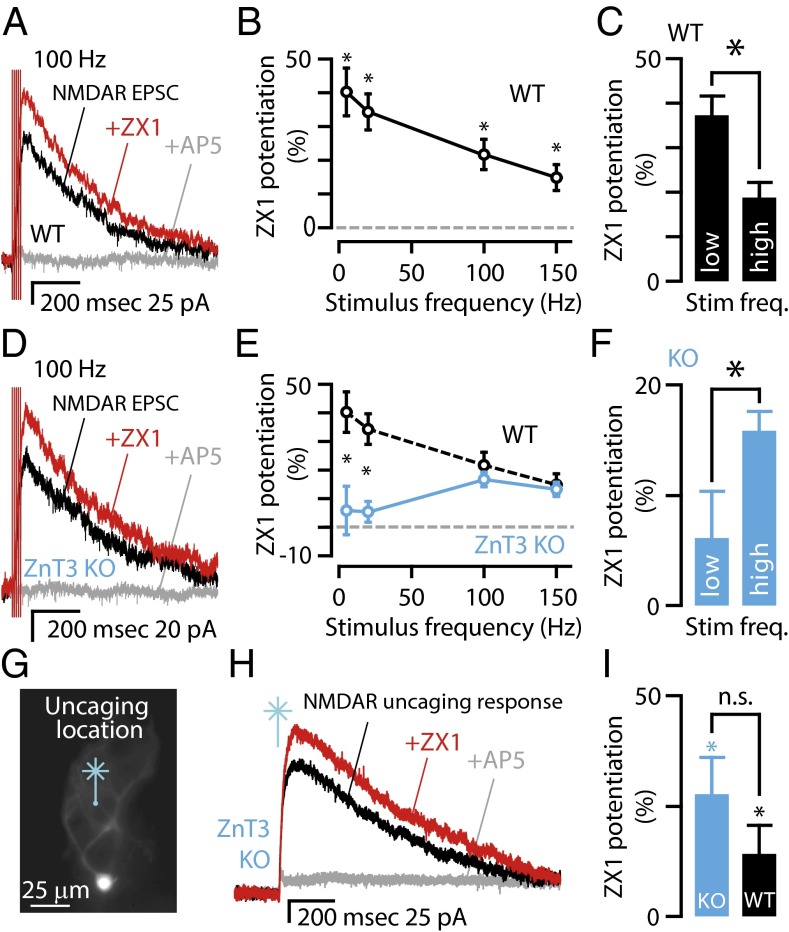
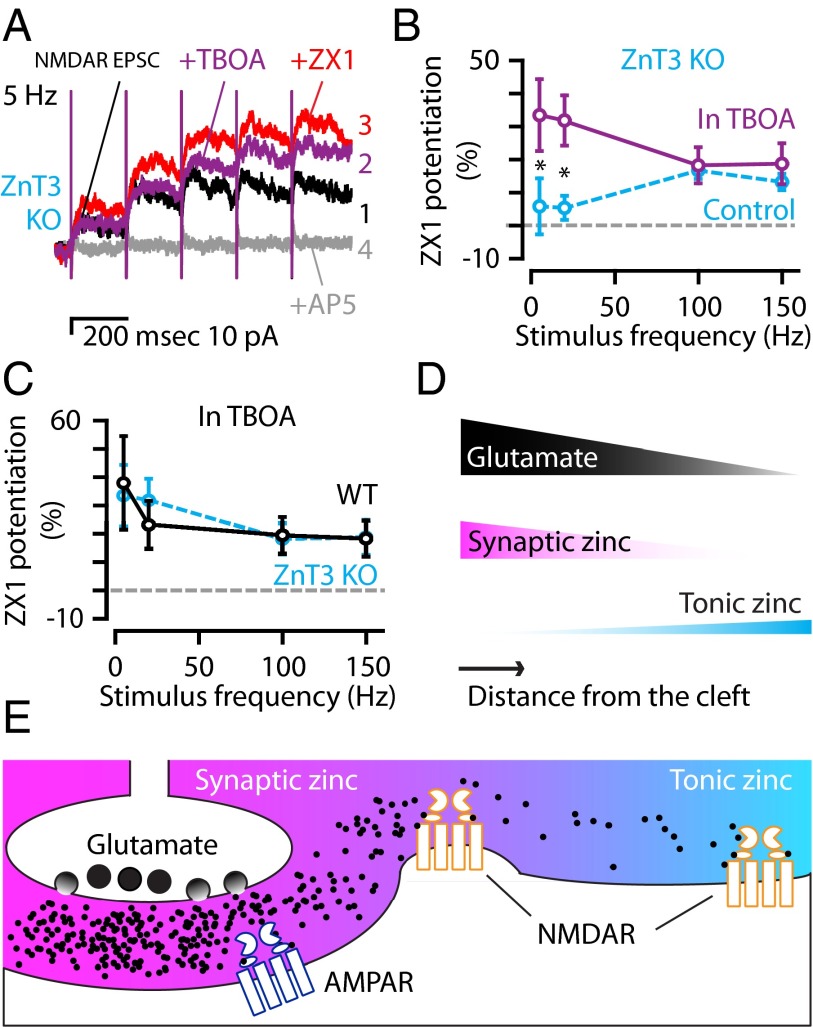
Many excitatory synapses contain high levels of mobile zinc within glutamatergic vesicles. Although synaptic zinc and glutamate are coreleased, it is controversial whether zinc diffuses away from the release site or whether it remains bound to presynaptic membranes or proteins after its release. To study zinc transmission and quantify zinc levels, we required a high-affinity rapid zinc chelator as well as an extracellular ratiometric fluorescent zinc sensor. We demonstrate that tricine, considered a preferred chelator for studying the role of synaptic zinc, is unable to efficiently prevent zinc from binding low-nanomolar zinc-binding sites, such as the high-affinity zinc-binding site found in NMDA receptors (NMDARs). Here, we used ZX1, which has a 1 nM zinc dissociation constant and second-order rate constant for binding zinc that is 200-fold higher than those for tricine and CaEDTA. We find that synaptic zinc is phasically released during action potentials. In response to short trains of presynaptic stimulation, synaptic zinc diffuses beyond the synaptic cleft where it inhibits extrasynaptic NMDARs. During higher rates of presynaptic stimulation, released glutamate activates additional extrasynaptic NMDARs that are not reached by synaptically released zinc, but which are inhibited by ambient, tonic levels of nonsynaptic zinc. By performing a ratiometric evaluation of extracellular zinc levels in the dorsal cochlear nucleus, we determined the tonic zinc levels to be low nanomolar. These results demonstrate a physiological role for endogenous synaptic as well as tonic zinc in inhibiting extrasynaptic NMDARs and thereby fine tuning neuronal excitability and signaling.

Keywords: NMDA receptors; glutamate spillover; ratiometric zinc sensors; zinc; zinc chelators; zinc dynamics.


Conflict of interest statement

The authors declare no conflict of interest.

Figures

Fig. 1.
Fig. 1.
In DCN cartwheel cells, short trains of parallel fiber stimulation evoke NMDAR EPSCs mediated by extrasynaptic NMDARs. (A) (Top) Cartoon showing experimental setup with stimulating electrode in the synaptic zinc-rich region of the DCN and a cartwheel cell. (Bottom) Epifluorescence showing the dendritic arbor of this cartwheel cell filled with Alexa-594 during whole-cell recording. (B) At −70 mV, a single electrical pulse caused a robust AMPAR EPSC, but at +40 mV the same pulse did not reveal a robust NMDAR EPSC. In the same cartwheel cell, five pulses delivered at 100 Hz caused AMPAR EPSC summation at −70 mV and a buildup of an NMDAR EPSC at +40 mV. AMPAR EPSCs were pharmacologically isolated with blockers of GABAARs (SR95531, SR, 20 μM) and GlyRs (strychnine, STR, 1 μM). NMDAR EPSCs were isolated by also blocking AMPARs (DNQX, 20 μM) and relieving the NMDAR magnesium block by changing the command potential to +40 mV. To confirm that the EPSCs were mediated by NMDARs, at the end of each experiment, the NMDAR antagonist AP5 (50 μM) was applied. (C) Example of isolated NMDAR EPSCs in response to increasing stimulus frequency. (D) Single electrical pulses elicited an AMPAR EPSC at lower stimulus intensity compared with the stimulus intensity required for eliciting an NMDAR EPSC. (E) Representative traces showing that TBOA (50 μM) potentiated the NMDAR EPSC following 100-Hz stimulus trains but had a smaller effect on the NMDAR EPSC following a 1-Hz stimulus train. (F) Group data showed that TBOA significantly potentiated the NMDAR EPSC (paired t tests, n = 7). (G) The increase in charge of the NMDAR EPSC in TBOA was significantly correlated with the initial NMDAR EPSC charge, P = 0.0001. (H) (Left) Peak-scaled NMDAR EPSCs following a five-pulse, 100-Hz train stimulus showed that d-AA (70 μM) sped the decay tau. (Right) Group data showing that d-AA significantly sped the decay tau (P = 0.01, paired t test, n = 4). (I) (Left) Peak-scaled NMDAR EPSCs following a five-pulse, 100-Hz train stimulus showed that CPP (1 μM) did not affect the decay tau. (Right) Group data showing that CPP did not significantly speed the decay tau (P = 0.16, paired t test, n = 5). Error bars represent SEM. Detailed values are given in SI Materials and Methods, Values for Main Figures.
Fig. 2.
Fig. 2.
Kinetics and zinc binding for extracellular chelators, ZX1, tricine, and CaEDTA. (A) Line drawings of extraceullar zinc chelators at pH 7.4. (B) Normalized fluorescence signals for addition of each chelator to 1 μM Zn2ZPP1 at pH 7.4 in buffer [50 mM piperazine-N,N’-bis(2-ethanesulfonic acid) (PIPES) and 100 mM KCl]. λex = 495 nm, λem = 500–650 nm. Integrated fluorescence signals were normalized to the fluorescence emission of 1 μM ZPP1; 10–100 mM tricine (Kd-Zn = 2.8 μM) attenuated, but did not abolish, zinc-induced fluorescence turn-on (ZPP1 Kd-Zn = 15.6 nM). The high-affinity chelators, ZX1 (Kd-Zn = 1 nM) and CaEDTA (Kd-Zn = 2 nM), can chelate zinc from ZPP1, as evidenced by complete fluorescence turn-off. (C) Normalized fluorescence signals for addition of chelators to 4 μM Zn(3-CO2H CM2) (a water molecule was added to complete the coordination sphere of zinc because the structure is unknown) at pH 7.4 in 50 mM PIPES and 100 mM KCl. λex = 355 nm, λem = 400–550 nm. Integrated fluorescence signals were normalized to the fluorescence of 10 μM 3-CO2H CM2; 10 mM tricine, and 100 μM each of ZX1 and CaEDTA, could completely remove zinc from this relatively low affinity sensor (Kd-Zn = 5 μM). (D) Plots of observed pseudo-first-order rate constants for the addition of chelator to a solution of 2 μM Zn(3-CO2H CM2) (with 8 μM excess 3-CO2H CM2) as measured by stopped flow fluorescence (λex = 355 nm, λem = 400–700 nm) at pH 7.0 in 50 mM PIPES and 100 mM KCl. Fluorescence turn-off reflects zinc binding by the chelators, ZX1, tricine, and CaEDTA. Varying [ZX1] from 10 to 120 μM yielded rapid turn-off kinetics with observed rates up to 57 s−1. Tricine concentrations nearly 100-fold higher resulted in similar rates, up to 47 s−1 for 16 mM tricine. Varying [CaEDTA] from 0.24 to 2 mM yielded relatively low rates up to 11.3 s−1. The second-order rate constants were derived from linear fits of kobs vs. [chelator]. (E) Rate and extent of fluorescence turn-on for a solution of 1 μM ZPP1 upon addition of 50 μM zinc, or 50 μM zinc + chelator (100 μM ZX1, 10 mM tricine, or 125 μM CaEDTA), as measured by stopped flow fluorescence (λex = 495 nm, λem = 495–700 nm) at pH 7.0 in 50 mM PIPES and 100 mM KCl. In the presence of excess zinc, ZPP1 turns on rapidly and completely (time to completion ∼0.02 s). When the same amount of zinc is added in the presence of excess tricine, the rate of zinc binding is diminished ∼30-fold (time to completion ∼0.6 s), but not prevented. Both ZX1 and CaEDTA premixed with zinc prevented turn-on of ZPP1, showing that only the higher-affinity zinc chelators can compete with nanomolar zinc-binding sites. Data are normalized to the fluorescence level of 1 μM of Zn2ZPP1. Error bars represent SD. Detailed values are given in SI Material and Methods, Values for Main Figures.
Fig. 3.
Fig. 3.
Synaptic (ZnT3-dependent) zinc inhibits extrasynaptic NMDARs. (A) (Top) A 5-Hz stimulus train was delivered to DCN parallel fibers while recording from a cartwheel cell to evoke pharmacologically isolated NMDAR EPSCs (in the presence of SR95531, strychnine, DNQX). The addition of the fast extracellular chelator ZX1 (100 μM) potentiated this NMDAR EPSC (red), and the addition of AP5 (gray) (50 μM) abolished the response. (Bottom) In a cartwheel cell from a ZnT3 KO mouse, the addition of ZX1 had no effect on this NMDAR EPSC. (B) Same experiment as in A, but with a 20-Hz stimulus train. (C) Quantification of the effect of zinc chelation showing that the peak amplitude of NMDAR EPSCs recorded from WT mice were significantly potentiated by ZX1 and that those from ZnT3 KO were not potentiated by ZX1 (n = 8 for WT; n = 6 for ZnT3 KO; WT vs. ZnT3 KO: 5 Hz, P = 0.008; 20 Hz, P = 0.01, t tests). (D) The IC50 of ifenprodil for NMDARs activated by different stimulus trains were not different between WT and ZnT3 KO (n = 5 for both; 5 Hz: P = 0.93; 20 Hz: P = 0.99, t tests). (E) Example trace showing that d-AA sped the decay kinetics of the NMDAR EPSC in ZnT3 KO mice. Traces were aligned to the last stimulus artifact of the train. (F) Group data showed that the effect of d-AA on the decay kinetics of NMDAR EPSCs was not different between WT and ZnT3 KO (τd-AAbaseline, 5 Hz: WT vs. KO, n = 4, P = 0.86, rank sum test; 20 Hz: WT vs. KO, P = 0.81, t test). Error bars represent SEM. Detailed values are given in SI Material and Methods, Values for Main Figures.
Fig. 4.
Fig. 4.
Novel ratiometric zinc probe detects changes in extracellular free zinc and reveals ZnT3-independent, low-nanomolar tonic zinc levels. (A) Chemical structure of the LZ9 ratiometric zinc sensor. This molecule features a zinc-sensitive green fluorophore (ZP1), linked to a zinc-insensitive red fluorophore (LRB) via a nine-residue polyproline linker. (B) (Top) Change in fluorescence intensity of a 1 µM solution of LZ9 in buffer (50 mM PIPES and 100 mM KCl, pH 7), when exciting ZP1 at 495 nm, upon addition of ZnCl2. (Bottom) Fluorescence intensity of the same solution when exciting LRB at 545 nm. (C) Blue and green light-emitting diode (LED) illumination were synchronized with the exposure times of a CCD camera: Every other frame used either blue or green excitation. A dual-band green/red Pinkel filter set with appropriate pass bands separated the two excitation and two emission colors (SI Materials and Methods). The resulting multiplexed movie was split into the zinc-sensitive orange channel (combined green and red emission) and the zinc-insensitive red channel, each with a 10-Hz frame rate. (D) Electrical stimulation of the molecular layer resulted in increased fluorescence from LZ9 that was restricted to the location of the zinc-rich parallel fibers. (E) Representative LZ9 fluorescence responses from a WT mouse showing that parallel fiber stimulation (100 pulses at 100 Hz) generates a ratiometric fluorescent signal that is attenuated by ZX1. (F) (Left) Representative LZ9 fluorescence responses from a WT and a ZnT3 KO mouse showing that parallel fiber stimulation (100 pulses at 100 Hz) does not generate a ratiometric fluorescent signal in the ZnT3 KO mouse, whereas the same stimulation generates a robust signal in the WT mouse. (Right) Mean fluorescence response from WT and ZnT3 KO mice (n = 11 for WT; n = 5 for KO, WT vs. ZnT3 KO, P = 0.0002, rank sum test). (G) Time course of LZ9 ratiometric response showing tonic fluorescence (Rtonic), minimum fluorescence (Rmin) following the addition of 4.5 mM EDTA (Kd-Zn = 40 fM), and maximum fluorescence (Rmax) following the addition of 5 mM ZnCl2. (H) Conversion of ratiometric signals into free zinc concentrations indicated that tonic zinc levels are not ZnT3-dependent (n = 5 for WT; n = 6 for ZnT3 KO; WT vs. ZnT3 KO, P = 0.6, t test). (I) Mean percent probe saturation by tonic zinc for LZ9 and Newport Green (NG) (n = 11 for LZ9; n = 4 for NG, P = 0.001, t test). Error bars represent SEM. Detailed values are given in SI Material and Methods, Values for Main Figures.
Fig. 5.
Fig. 5.
Synaptic zinc modulation of extrasynaptic NMDARs is frequency-dependent; a pool of ZnT3-independent zinc inhibits extrasynaptic NMDARs activated by high-frequency trains. (A) Representative traces from a WT mouse showing that NMDAR EPSCs (black trace) following a 100-Hz stimulus train were potentiated after zinc chelation by 100 μM ZX1 (red trace). AP5 (gray trace) abolished the response, indicating that it was due to NMDAR activation. (B) Average graph showing the frequency dependence of NMDAR EPSCs potentiation by zinc chelation in WT mice [n = 8, P < 0.006 for all frequencies vs. control (no ZX1) paired t tests]. (C) Group data showing that in WT mice the potentiation of NMDAR EPSCs by ZX1 is significantly larger for NMDARs activated by low-frequency trains (5 and 20 Hz) than for high-frequency trains (100 Hz and 150 Hz; n = 8, P = 0.0001, paired t test). (D) Representative traces from a ZnT3 KO mouse showing that NMDAR EPSCs (black trace) following a 100-Hz stimulus train were potentiated by 100 μM ZX1 (red trace); AP5 (gray trace) abolished the response. (E) Average graph showing the frequency dependence of NMDAR EPSC potentiation by zinc chelation in ZnT3 KO mice (n = 6, 5 Hz: P = 0.522; 20 Hz: P = 0.20; 100 Hz: P = 0.001; 150 Hz: P = 0.003, paired t tests). For comparison between WT and KO, WT data are replotted from B. The difference between WT and ZnT3 KO mice occurred only at low stimulus frequencies, indicated by asterisk [WT (n = 8) vs. KO (n = 6): 5 Hz: P = 0.008; 20 Hz: P = 0.01, t tests, the blue line designates ZnT3 KO]. (F) Group data showing that in ZnT3 KO mice the potentiation of NMDAR EPSCs by ZX1 is significantly smaller for NMDARs activated by low-frequency trains (5 and 20 Hz) than for high-frequency trains (100 Hz and 150 Hz; n = 6, low vs. high: P = 0.034, paired t test). (G) Epifluorescent image showing the location of glutamate uncaging (the site of UV laser flash) in the molecular layer onto the dendrites of a cartwheel cell in the presence of SR95531 (20 μM), strychnine (1 μM), DNQX (20 μM), and tetrodotoxin (TTX) to prevent action potentials (500 nM, sodium channel blocker). (H) Representative traces showing that the NMDAR current (black) was potentiated by the addition of ZX1 (red) and abolished by subsequent addition of AP5 (gray). (I) Group data showing that ZX1 increased NMDAR-mediated currents significantly in both ZnT3 KO and WT mice (paired t test for comparisons within genotypes; ZnT3 KO, P = 0.023, n = 5, WT, n = 11, P = 0.007. Wilcoxon rank-sum test for comparison between genotypes, P = 0.21). Error bars represent SEM. Detailed values are given in SI Material and Methods, Values for Main Figures.
Fig. 6.
Fig. 6.
The amount of glutamate spillover determines the relative strength of synaptic and tonic zinc modulation of extrasynaptic NMDARs; complementary modulation of extrasynaptic NMDARs by synaptic and tonic zinc. (A) Representative traces from a ZnT3 KO mouse showing control NMDAR EPSCs in response to 5-Hz stimulation (1: black trace) that were potentiated by the addition of TBOA (2: 50 μM, purple trace), and were further potentiated by zinc chelation with 100 μM ZX1 (3: red trace). AP5 abolished the response (4: gray trace). (B) Group data from ZnT3 KO mice showing that TBOA increased the effect of ZX1 only at low stimulus frequencies [ZX1 in TBOA (n = 9) vs. ZX1 alone (n = 6); 5 Hz: P = 0.033; 20 Hz: P = 0.005; 100 Hz: P = 0.399; 150 Hz: P = 0.214, t tests]. For comparison, the dotted line represents ZnT3 KO control data (replotted from Fig. 5E). (C) TBOA abolished the differences in the frequency dependence of zinc modulation between WT and ZnT3 KO mice [compared with ZnT3 KO: WT (n = 7), 5 Hz: P = 0.943; 20 Hz: P = 0.811; 100 Hz: P = 0.881; 150 Hz, P = 0.935, t tests, dotted line: ZnT3 KO data replotted from Fig. 6B in TBOA]. (D and E) Schematic illustrating the gradients of glutamate (black), synaptic zinc (magenta), and tonic zinc (cyan) as a function of the distance from synaptic terminals and their effects on extrasynaptic NMDARs. (E) During synaptic release, high levels of glutamate (black dots) near the cleft are accompanied by high levels of synaptic zinc; however, as glutamate moves farther from the cleft, the functional levels of synaptic zinc drop before the functional levels of glutamate. Thus, glutamate activates extrasynaptic NMDARs that are not modulated by coreleased synaptic zinc. These NMDARs are modulated by ZnT3-independent tonic zinc levels, which are lower close to the cleft, but higher at distances farther away from the synapse. Error bars represent SEM. Detailed values are given in SI Material and Methods, Values for Main Figures.

References

    1. Paoletti P, Vergnano AM, Barbour B, Casado M. Zinc at glutamatergic synapses. Neuroscience. 2009;158(1):126–136. - PubMed
    1. Besser L, et al. Synaptically released zinc triggers metabotropic signaling via a zinc-sensing receptor in the hippocampus. J Neurosci. 2009;29(9):2890–2901. - PMC - PubMed
    1. Kay AR, Tóth K. Is zinc a neuromodulator? Sci Signal. 2008;1(19):re3. - PMC - PubMed
    1. Frederickson CJ, Koh JY, Bush AI. The neurobiology of zinc in health and disease. Nat Rev Neurosci. 2005;6(6):449–462. - PubMed
    1. Kay AR. Evidence for chelatable zinc in the extracellular space of the hippocampus, but little evidence for synaptic release of Zn. J Neurosci. 2003;23(17):6847–6855. - PMC - PubMed

Publication types

LinkOut - more resources