. 2015 May 7:14:191.
doi: 10.1186/s12936-015-0706-3.

Defining the relationship between Plasmodium vivax parasite rate and clinical disease

Affiliations

Defining the relationship between Plasmodium vivax parasite rate and clinical disease

Katherine E Battle et al. Malar J. .

Abstract

Background: Though essential to the development and evaluation of national malaria control programmes, precise enumeration of the clinical illness burden of malaria in endemic countries remains challenging where local surveillance systems are incomplete. Strategies to infer annual incidence rates from parasite prevalence survey compilations have proven effective in the specific case of Plasmodium falciparum, but have yet to be developed for Plasmodium vivax. Moreover, defining the relationship between P. vivax prevalence and clinical incidence may also allow levels of endemicity to be inferred for areas where the information balance is reversed, that is, incident case numbers are more widely gathered than parasite surveys; both applications ultimately facilitating cartographic estimates of P. vivax transmission intensity and its ensuring disease burden.

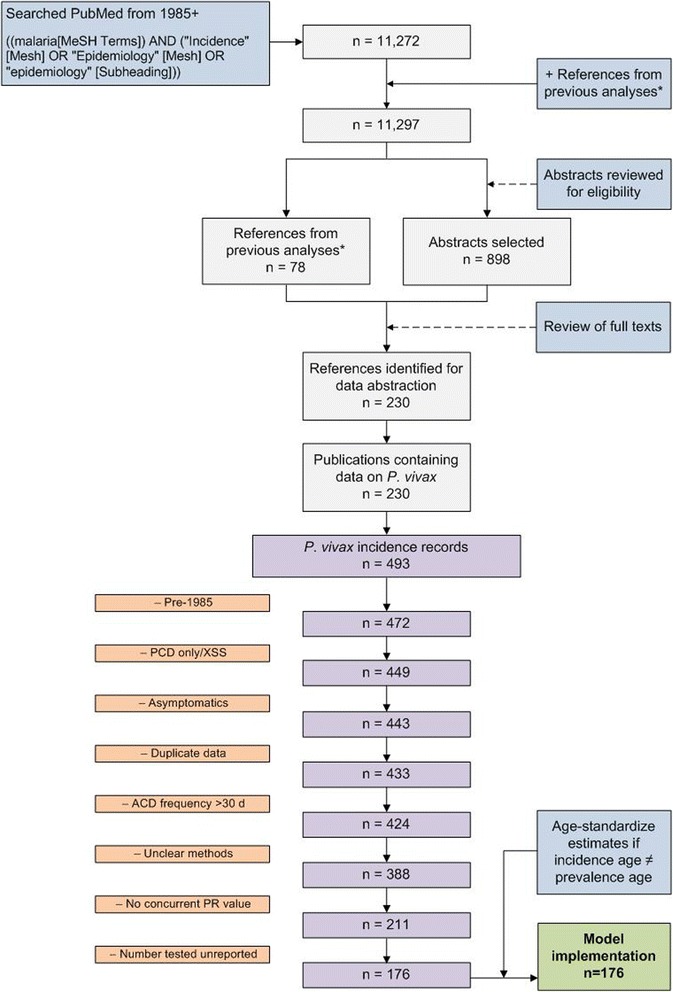
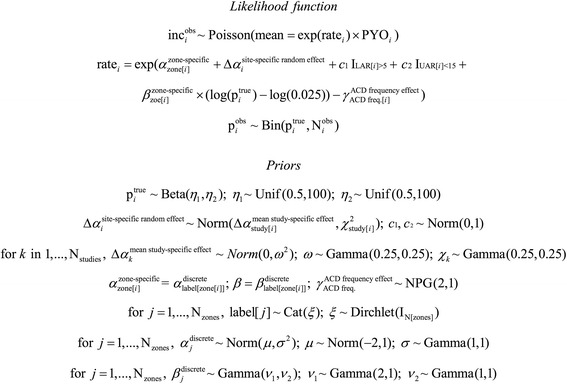
Methods: A search for active case detection surveys was conducted and the recorded incidence values were matched to local, contemporary parasite rate measures and classified to geographic zones of differing relapse phenotypes. A hierarchical Bayesian model was fitted to these data to quantify the relationship between prevalence and incidence while accounting for variation among relapse zones.

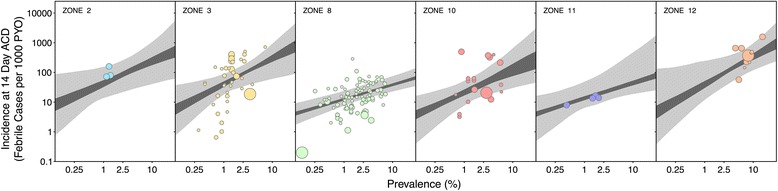
Results: The model, fitted with 176 concurrently measured P. vivax incidence and prevalence records, was a linear regression of the logarithm of incidence against the logarithm of age-standardized prevalence. Specific relationships for the six relapse zones where data were available were drawn, as well as a pooled overall relationship. The slope of the curves varied among relapse zones; zones with short predicted time to relapse had steeper slopes than those observed to contain long-latency relapse phenotypes.

Conclusions: The fitted relationships, along with appropriate uncertainty metrics, allow for estimates of clinical incidence of known confidence to be made from wherever P. vivax prevalence data are available. This is a prerequisite for cartographic-based inferences about the global burden of morbidity due to P. vivax, which will be used to inform control efforts.


Figures

Figure 1
Figure 1
The spatial distribution of Plasmodium vivax endemicity in 2010 overlaid by ACD study sites. The spatial distribution of P. vivax [19] is shown using the MBG point estimates of the annual mean PvPR (1 to 99 year-olds) within the spatial limits of stable transmission, displayed on a continuum of blue (low prevalence) to red (high prevalence). Areas within the stable limits that were predicted with high certainty (>0.9) to have a PvPR less than 1% were classed as unstable. Regions where Duffy negativity gene frequency is predicted to exceed 90% [42] are shown in hatching for additional context. The location of study sites of the incidence records used in the final analysis are shown as purple points.
Figure 2
Figure 2
Comparison of Plasmodium falciparum and Plasmodium vivax prevalence. Prevalence values, obtained from the mapped P. falciparum and P. vivax endemicity surfaces [19,24]. Data for P. falciparum has been standardized to the 1 to 99 years age range to reflect P. vivax data [36]. The shaded areas correspond to each species and show a smoothed approximation of the frequency distribution (a kernel density plot) of parasite prevalence within each geographic region. The black central bar represents the interquartile range and the white circles indicate the median values.
Figure 3
Figure 3
Schematic overview of the literature search procedure, results, and data exclusions to obtain clinical incidence records of use for model implementation. References from previous analyses* include those used by Patil et al. [14] and Griffin et al. [30].
Figure 4
Figure 4
The mathematical form of the model summarized in standard hierarchical Bayesian notation.
Figure 5
Figure 5
Violin plot of incidence (per 1,000 person-years observed). A) all data (n = 388) by region and B) data used in the analysis (n = 176) by region are shown with incidence on the logarithmic scale. The grey areas correspond to a smoothed approximation of the frequency distribution (a kernel density plot) of the incidence observed in each geographic region. The black central bar represents the interquartile range and the white circles indicate the median values.
Figure 6
Figure 6
Temporal distribution of records used in the analysis. The size of the point reflects the number of person-years observed included in the 176 records that had an age-matched concurrent PvPR measure with the incidence record.
Figure 7
Figure 7
The zone-specific prevalence-incidence relationships shown as point-wise 68% and 95% credible intervals. Zone 2 is Central America, zone 3 is South America, zone 8 is Monsoon Asia (India), zone 10 is Southeast Asia, zone 11 is northern Asia and Europe and Zone 12 is Melanesia. The 95% CrIs are shown in light grey and the 68% CrIs are shown in dark grey. The size of the point corresponds to the time period between each ACD visit (see Figure 8) and the colours of the zones correspond to those shown in Figure 9.
Figure 8
Figure 8
Pooled prevalence-incidence relationship for the entire dataset. To produce a pooled fit, the posterior of each zone was weighted by the number of observations from that zone. An errors-in-variables fit was used to allow for uncertainty in the independent variable as well as the dependent variable (ordinary linear regression would assume no uncertainty in the former). Point-wise 95% CrIs are shown in light grey and 68% CrIs are shown in dark grey. The colours of the zones match those shown in Figure 9.
Figure 9
Figure 9
Scatter plot of data used in analysis coloured by relapse zones. Panel A plots the data used in the analysis by the relapse zones on log scales. The points are coloured by the mean time to relapse predicted in each zone shown in panel B.

References

    1. Carter R, Mendis KN. Evolutionary and historical aspects of the burden of malaria. Clin Microbiol Rev. 2002;15:564–594. doi: 10.1128/CMR.15.4.564-594.2002. - DOI - PMC - PubMed
    1. Cibulskis RE, Aregawi M, Williams R, Otten M, Dye C. Worldwide incidence of malaria in 2009: estimates, time trends, and a critique of methods. PLoS Med. 2011;8 doi: 10.1371/journal.pmed.1001142. - DOI - PMC - PubMed
    1. Hay SI, Guerra CA, Tatem AJ, Atkinson PM, Snow RW. Urbanization, malaria transmission and disease burden in Africa. Nat Rev Microbiol. 2005;3:81–90. doi: 10.1038/nrmicro1069. - DOI - PMC - PubMed
    1. Hay SI, Guerra CA, Tatem AJ, Noor AM, Snow RW. The global distribution and population at risk of malaria: past, present, and future. Lancet Infect Dis. 2004;4:327–336. doi: 10.1016/S1473-3099(04)01043-6. - DOI - PMC - PubMed
    1. Hay SI, Okiro EA, Gething PW, Patil AP, Tatem AJ, Guerra CA, et al. Estimating the global clinical burden of Plasmodium falciparum malaria in 2007. PLoS Med. 2010;7 doi: 10.1371/journal.pmed.1000290. - DOI - PMC - PubMed

Publication types

LinkOut - more resources