. 2015 May 6;35(18):7030-40.
doi: 10.1523/JNEUROSCI.2371-14.2015.

Audio-vocal interaction in single neurons of the monkey ventrolateral prefrontal cortex

Affiliations

Audio-vocal interaction in single neurons of the monkey ventrolateral prefrontal cortex

Steffen R Hage et al. J Neurosci. .

Abstract

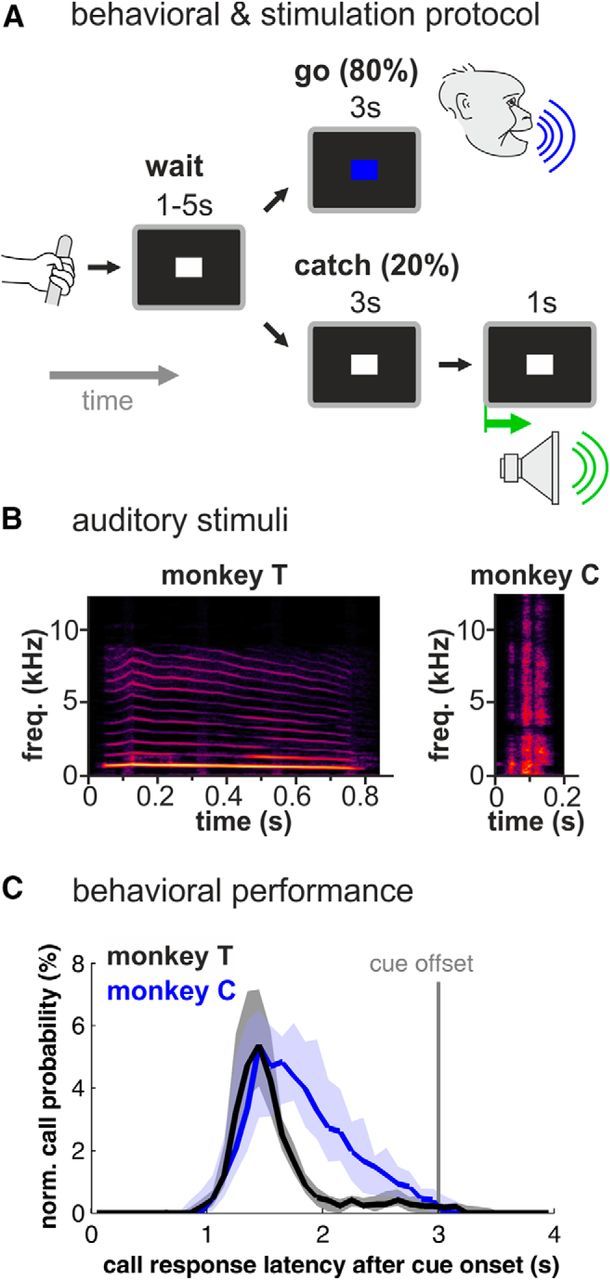
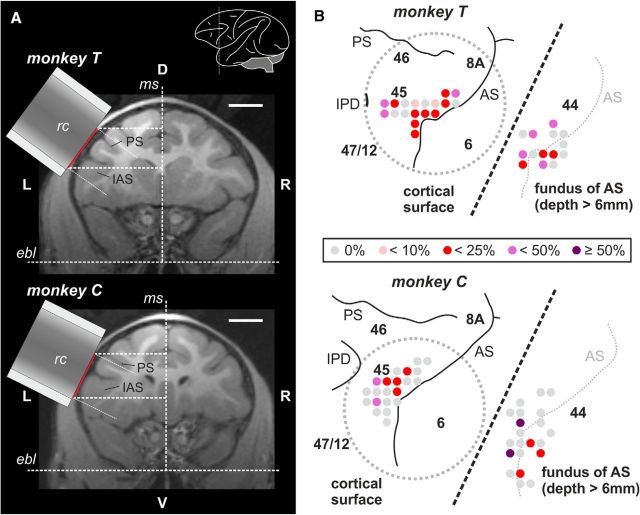
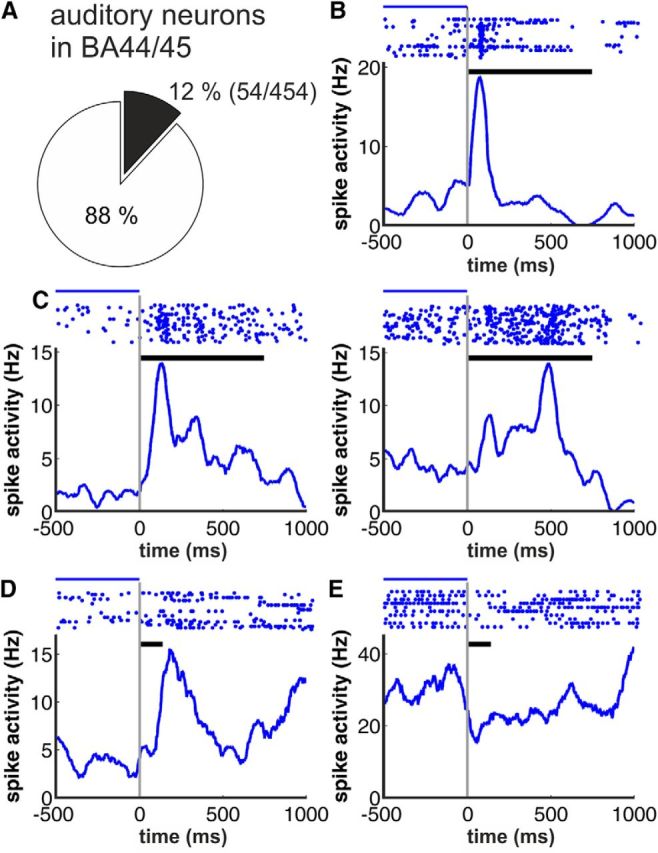
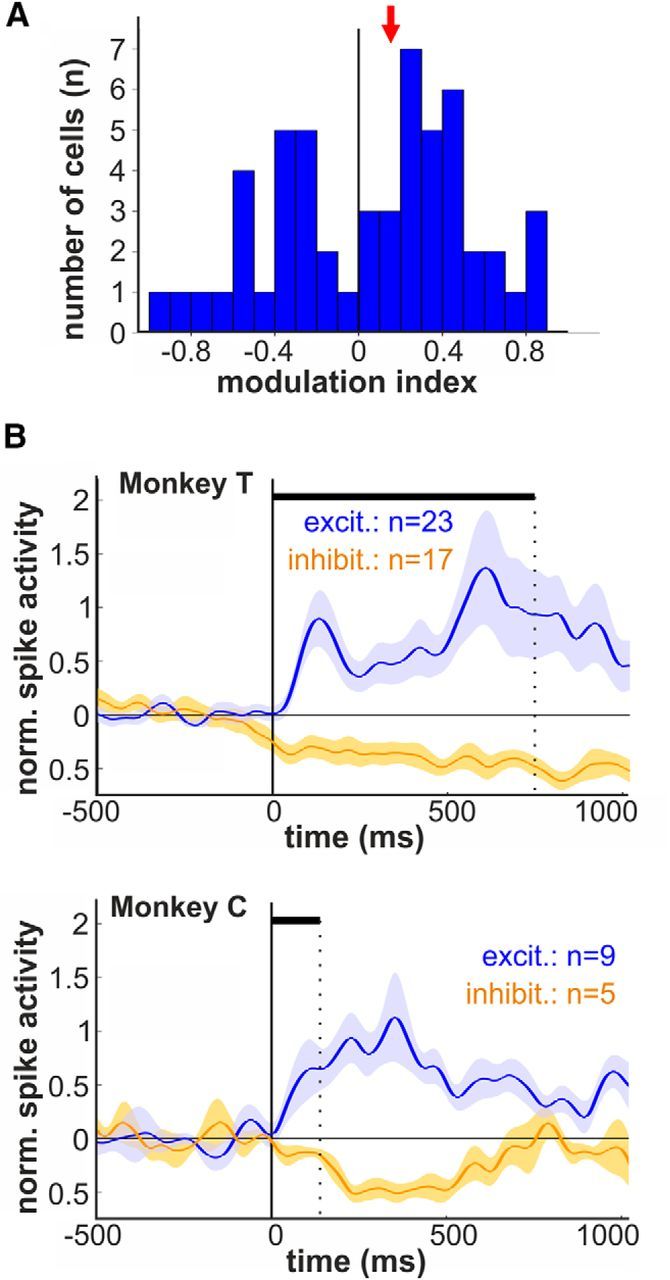
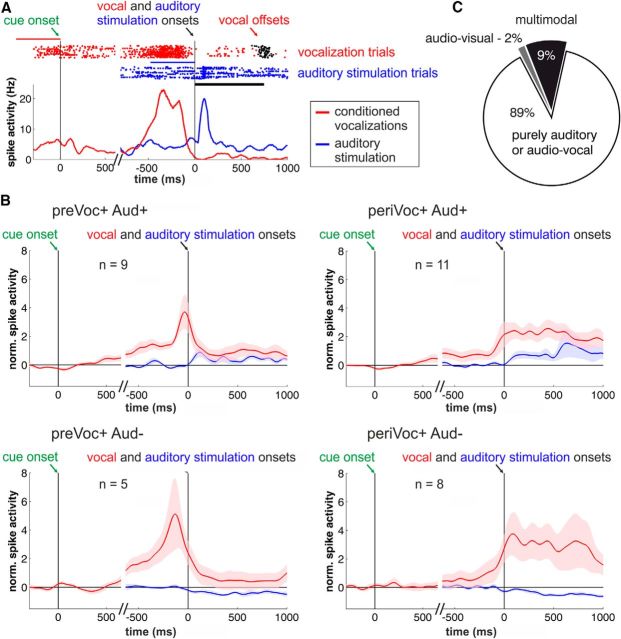
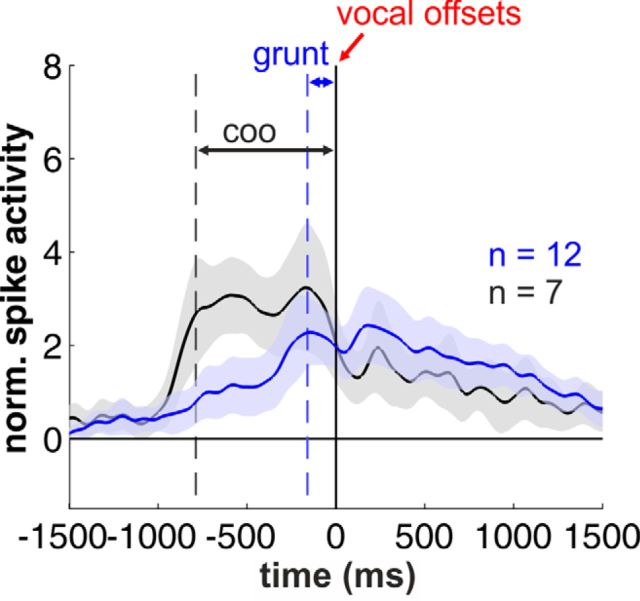
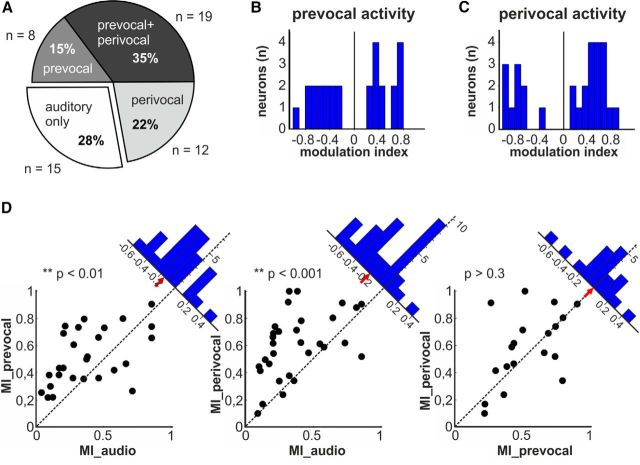
Complex audio-vocal integration systems depend on a strong interconnection between the auditory and the vocal motor system. To gain cognitive control over audio-vocal interaction during vocal motor control, the PFC needs to be involved. Neurons in the ventrolateral PFC (VLPFC) have been shown to separately encode the sensory perceptions and motor production of vocalizations. It is unknown, however, whether single neurons in the PFC reflect audio-vocal interactions. We therefore recorded single-unit activity in the VLPFC of rhesus monkeys (Macaca mulatta) while they produced vocalizations on command or passively listened to monkey calls. We found that 12% of randomly selected neurons in VLPFC modulated their discharge rate in response to acoustic stimulation with species-specific calls. Almost three-fourths of these auditory neurons showed an additional modulation of their discharge rates either before and/or during the monkeys' motor production of vocalization. Based on these audio-vocal interactions, the VLPFC might be well positioned to combine higher order auditory processing with cognitive control of the vocal motor output. Such audio-vocal integration processes in the VLPFC might constitute a precursor for the evolution of complex learned audio-vocal integration systems, ultimately giving rise to human speech.

Keywords: audio-vocal integration; cognitive control; monkey homolog of human Broca's area; prefrontal cortex; vocal motor control; vocalization.


Figures

Figure 1.
Figure 1.
Behavioral and auditory stimulation protocol and behavioral performance. A, Monkeys were trained in a go/nogo protocol to vocalize in response to a colored cue and were stimulated acoustically at the end of catch trials (20% of all trials) that required the monkey to withhold vocalization. B, Spectrograms of the coo and grunt vocalization that were used as acoustical stimuli. Spectral intensity is represented by different shades of color with black as the lowest and yellow as the highest intensity. C, Probability of the occurrence of call onsets within each 100 ms bin for both monkeys during go trials normalized for 31 (monkey T) and 27 recording sessions (monkey C); shaded areas indicate first and third quartiles.
Figure 2.
Figure 2.
Recording areas. A, MR images (frontal sections) of monkey T and monkey C used to reconstruct the position of the center of the recording chamber (rc). Red lines indicate the position of the craniotomy. Scale bar, 10 mm. Inset, Lateral view of the left hemisphere indicating the approximate position of the frontal section. B, Proposed location of recording sites inside each recording chamber in the prefrontal cortex as reconstructed from MR images (without recording wells; gray dotted circles: position of craniotomy). For better inspection, recording sites within the fundus of the inferior AS (depth > 6 mm; predominantly BA44) are depicted offset on the right side of each chamber (separated by oblique dotted line). The proportion of auditory units in relation to all neurons recorded at a specific recording site is color coded. AS, arcuate sulcus; ebl, ear bar level; IAS inferior arcuate sulcus; IPD, inferior precentral dimple; ms, mid-sagittal plane; PS, principal sulcus.
Figure 3.
Figure 3.
Examples for acoustic responses. A, Proportion of neurons showing auditory responses in BA44/45 (54 of 454 recorded neurons). B–E, Example neurons showing different types of activity in response to coo (monkey T) and grunt vocalization (monkey C). Top, Neuronal responses are plotted as dot-raster histograms (each dot represents an action potential). Bottom, Spike-density functions (activity averaged over all trials and smoothed by a 100 ms Gaussian kernel). Phasic (B), sustained (C), and long-latency responses (D) and suppressed activity after call onset (E) were observed. Example neurons in B and C were recorded in monkey T, whereas neurons depicted in D and E stem from monkey C, respectively; black horizontal bars between dot-raster histograms indicate the duration of the coo and grunt vocalization used as acoustical stimulus for monkey T and C, respectively. Blue lines indicate from where the baseline firing rate was estimated.
Figure 4.
Figure 4.
Modulation indices and population responses for excited and inhibited auditory activity. A, Distribution of the modulation indices indicating the magnitude of excitation and suppression during auditory stimulation (red arrow, median modulation index). B, Average normalized activity (population responses) for auditory neurons showing increased and suppressed responses separately for monkey T and C, respectively.
Figure 5.
Figure 5.
Audio-vocal activity in PFC neurons. A, Example neuron showing a phasic response during auditory stimulation and ramping neuronal activity before voluntary vocalizations. Top, Raster plot. Bottom, Represents the corresponding spike-density histogram averaged and smoothed with a Gaussian kernel (100 ms) for illustration. The blue and red lines indicate in which trial period the baseline firing rate was estimated (blue for auditory and red for vocal responses). B, Averaged and normalized population responses of auditory neurons subdivided into neurons showing increased (Aud+) or suppressed (Aud−) responses during auditory stimulation (blue curves) with an additional significant increase in neuronal activity before vocal output (preVoc+) or during conditioned vocal output (periVoc+; red curves). There are no significant differences in firing rates due to the visual cue stimuli. Vocalization-correlated activity is triggered by vocal onset and auditory response by the onset of the auditory stimuli (right, top and bottom); visual response by go-cue onset (left, top and bottom). C, Fractions of auditory neurons that also showed visual (1/54 neurons) as well as visual and prevocal and/or perivocal activity (multimodal neurons 5/54).
Figure 6.
Figure 6.
Postvocal activity in periVoc+ neurons. Averaged and normalized population responses of periVoc+ neurons separated for monkey T (coo vocalizations) and monkey C (grunt calls). There are no significant differences in firing rates after call offset.
Figure 7.
Figure 7.
Pre vocal and perivocal activity of auditory neurons. A, Fractions of auditory neurons that also showed prevocal (8/54), perivocal (12/54), or both types of activation (19/54). B, C, Distribution of the modulation indices of auditory neurons showing significant modulation before conditioned vocal output (B) and/or during conditioned vocal output (C). D, Scatter plots of auditory neurons as a function of their absolute values of their modulation indices. Each dot represents one neuron with its corresponding absolute value of its modulation index in response to auditory stimulation (MI_audio) and before (MI_prevocal) and during self-produced vocalizations (MI_perivocal). Insets indicate the distance of the dot to the bisection line. Positive values were assigned to dots below the line (modulation index on abscissa higher than on the ordinate) and negative values to dots above the line (modulation index on abscissa lower than on the ordinate). Red arrows mark the median distance to the bisection line.

References

    1. Ackermann H, Hage SR, Ziegler W. Brain mechanisms of acoustic communication in humans and nonhuman primates: an evolutionary perspective. Behav Brain Sci. 2014;37:529–546. doi: 10.1017/S0140525X13003099. - DOI - PubMed
    1. Amunts K, Zilles K. Architecture and organization principles of Broca's region. Trends Cogn Sci. 2012;16:418–426. doi: 10.1016/j.tics.2012.06.005. - DOI - PubMed
    1. Amunts K, Lenzen M, Friederici AD, Schleicher A, Morosan P, Palomero-Gallagher N, Zilles K. Broca's region: novel organizational principles and multiple receptor mapping. PLoS Biol. 2010;8:e1000489. doi: 10.1371/journal.pbio.1000489. - DOI - PMC - PubMed
    1. Andics A, Gácsi M, Faragó T, Kis A, Miklósi A. Voice-Sensitive Regions in the Dog and Human Brain Are Revealed by Comparative fMRI. Curr Biol. 2014;24:574–578. doi: 10.1016/j.cub.2014.01.058. - DOI - PubMed
    1. Brumm H, Voss K, Köllmer I, Todt D. Acoustic communication in noise: regulation of call characteristics in a New World monkey. J Exp Biol. 2004;207:443–448. doi: 10.1242/jeb.00768. - DOI - PubMed

LinkOut - more resources