Comparative Study
. 2015 May 6;35(18):7095-105.
doi: 10.1523/JNEUROSCI.5265-14.2015.

Unilateral prefrontal lesions impair memory-guided comparisons of contralateral visual motion

Affiliations
Comparative Study

Unilateral prefrontal lesions impair memory-guided comparisons of contralateral visual motion

Tatiana Pasternak et al. J Neurosci. .

Abstract

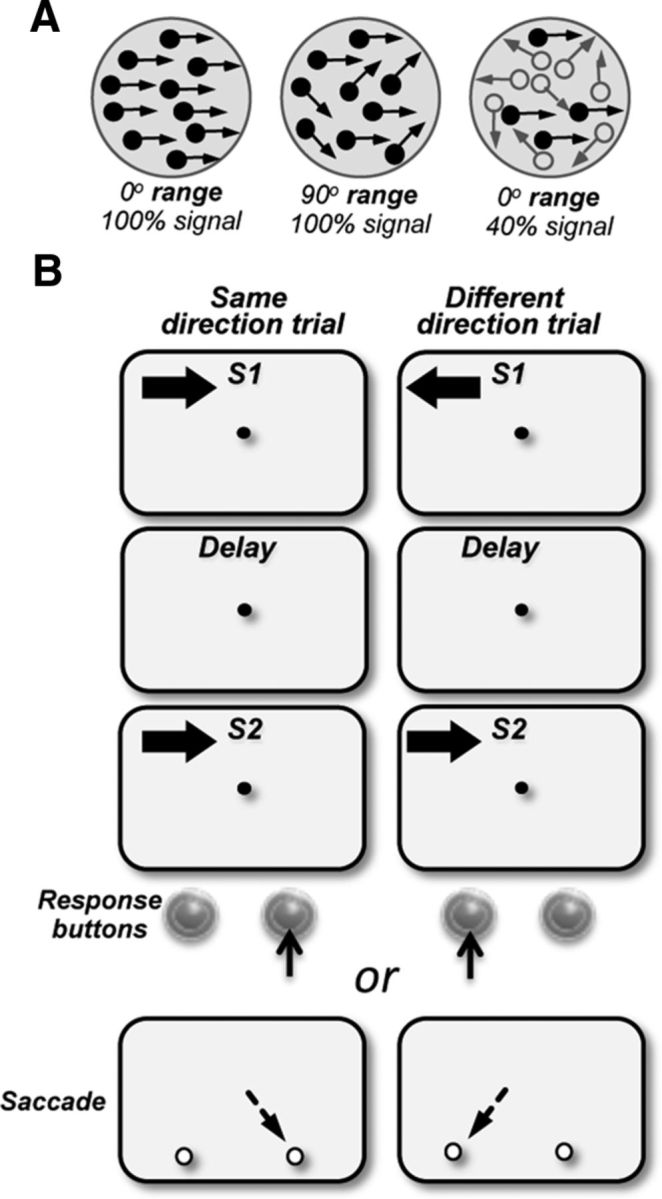
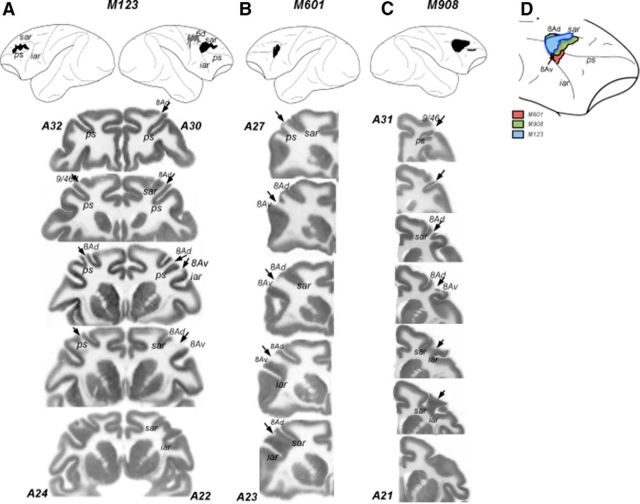
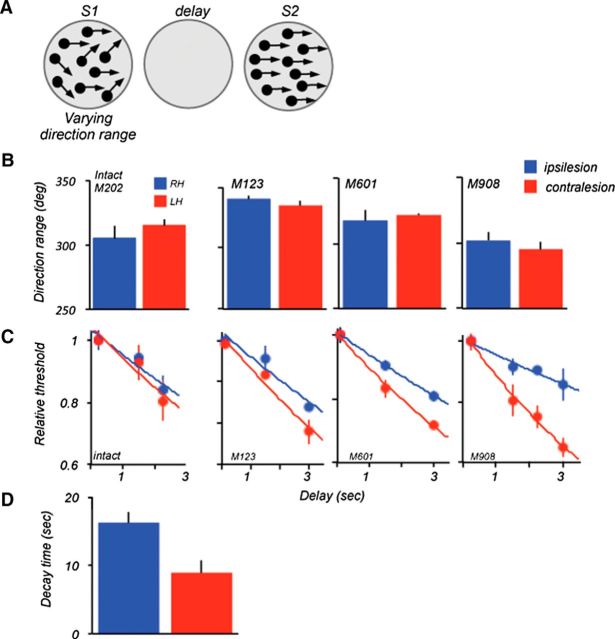
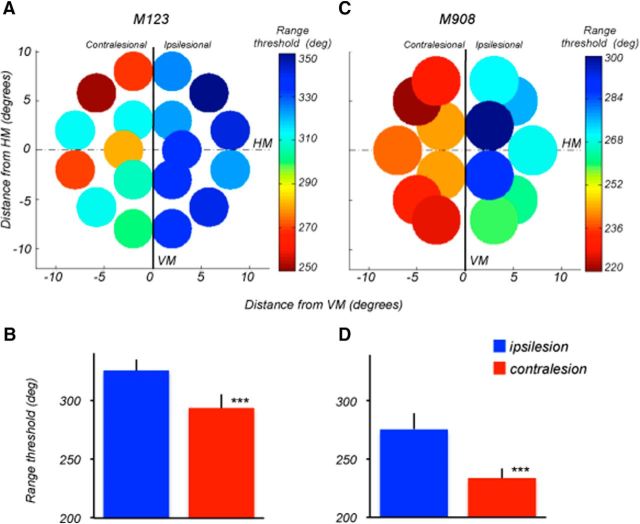
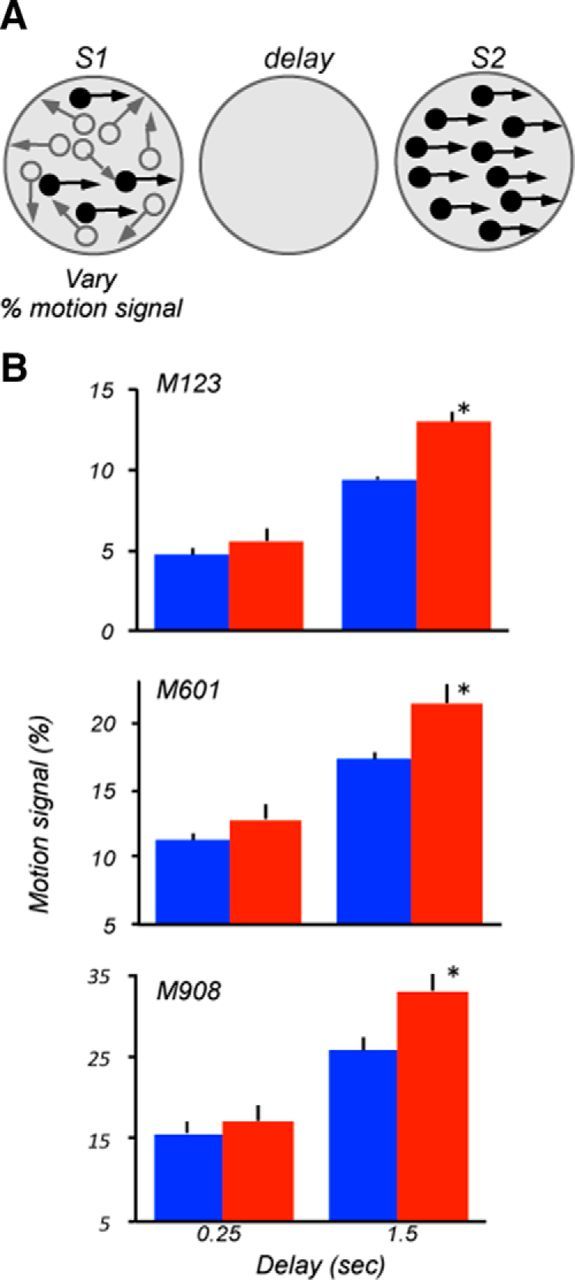
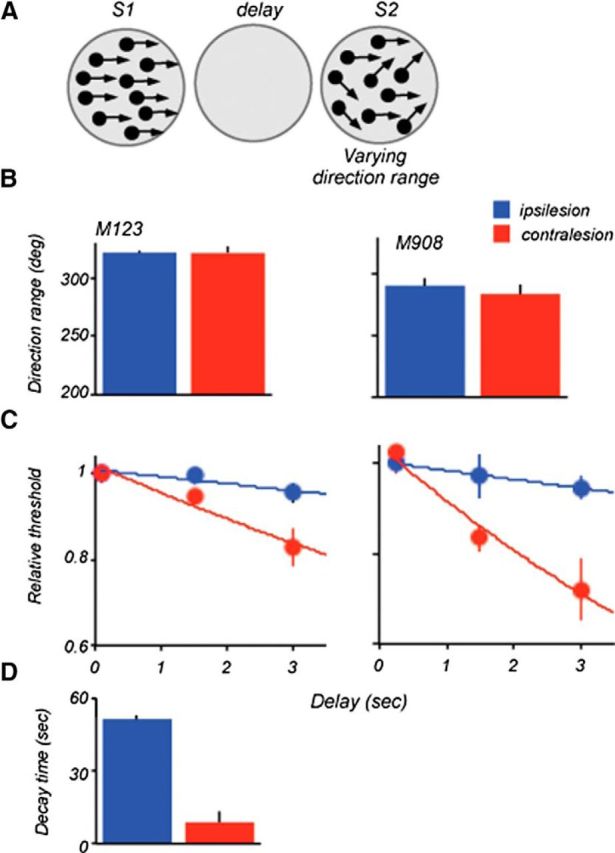
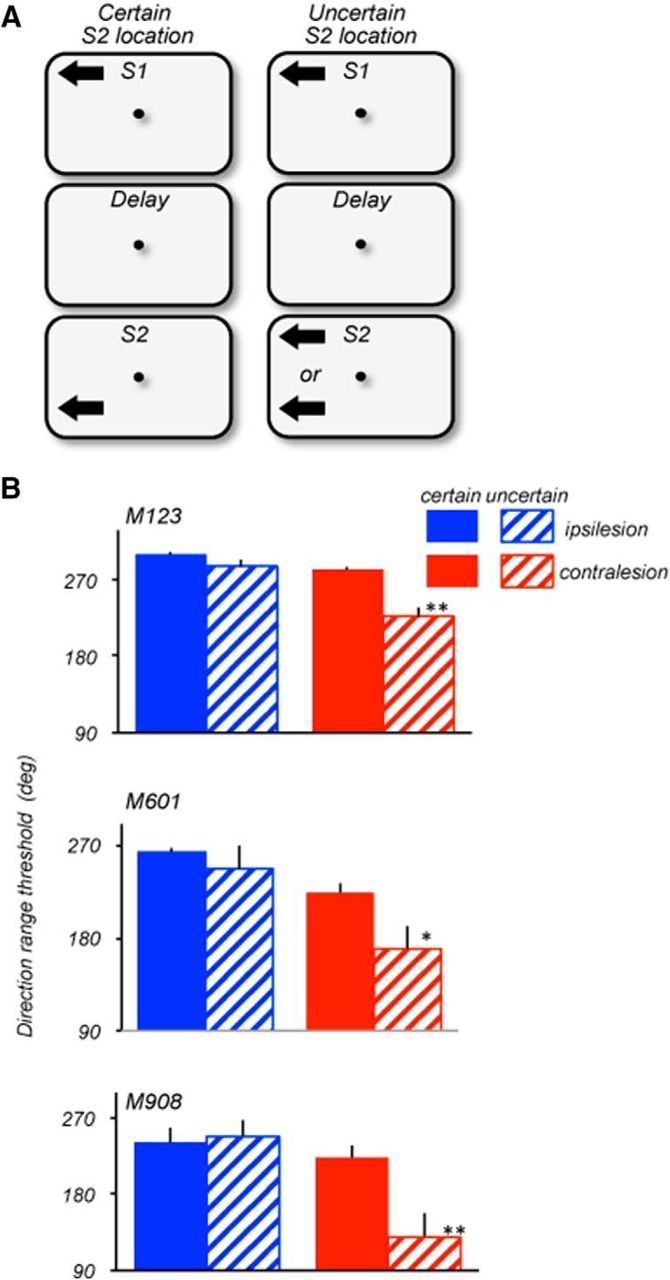
The contribution of the lateral prefrontal cortex (LPFC) to working memory is the topic of active debate. On the one hand, it has been argued that the persistent delay activity in LPFC recorded during some working memory tasks is a reflection of sensory storage, the notion supported by some lesion studies. On the other hand, there is emerging evidence that the LPFC plays a key role in the maintenance of sensory information not by storing relevant visual signals but by allocating visual attention to such stimuli. In this study, we addressed this question by examining the effects of unilateral LPFC lesions during a working memory task requiring monkeys to compare directions of two moving stimuli, separated by a delay. The lesions resulted in impaired thresholds for contralesional stimuli at longer delays, and these deficits were most dramatic when the task required rapid reallocation of spatial attention. In addition, these effects were equally pronounced when the remembered stimuli were at threshold or moved coherently. The contralesional nature of the deficits points to the importance of the interactions between the LPFC and the motion processing neurons residing in extrastriate area MT. Delay-specificity of the deficit supports LPFC involvement in the maintenance stage of the comparison task. However, because this deficit was independent of stimulus features giving rise to the remembered direction and was most pronounced during rapid shifts of attention, its role is more likely to be attending and accessing the preserved motion signals rather than their storage.

Keywords: cortical damage; direction discrimination; motion perception; prefrontal cortex; visual attention; working memory.


Figures

Figure 1.
Figure 1.
Visual stimuli and the behavioral task. A, Direction range stimuli (left and middle dot fields): stimuli consisted of random dots displaced in directions chosen from a predetermined distribution. The width of the distribution of directions that determined the range of directions within which, individual dots moved was varied between 0° (all dots moving in the same direction) and 360° (dots moving in all directions). Motion signal thresholds (left and right dot fields): stimuli consisted of a proportion of dots moving in the same direction in a field of dots moving in random directions (signal dots, filled circles; noise dots, open circles). B, Behavioral task: the animals maintained fixation on a target at the center of the display and reported whether the two stimuli, S1 and S2, separated by a delay moved in the same or in different directions by pressing one of the two response buttons (M123 and M601) or making a saccade to one of the two targets (M908, M202) which appeared after the offset of the fixation target. S1 and S2 were 4°–5° diameter and moved at 10°–15°/s. In separate blocks of trials, stimuli were presented in the upper visual field on either side of the vertical meridian, in the ipsilesional and contralesional quadrants. On each trial, the direction of S1 was chosen at random from a set of eight directions; S2 moved either in the same or opposite direction as S1.
Figure 2.
Figure 2.
Lesion reconstructions. Top, Damage from both surgical lesions and unintended damage are shown for all three animals; these have been reconstructed from histological sections and projected onto a lateral view of the macaque brain. Both hemispheres are shown for M123 (A); only the hemispheres with damage are shown for M601 (B) and M908 (C). Black areas indicate areas of damage to LPFC, and gray areas indicate damage to the dorsal premotor cortex. Numbers correspond to anteroposterior (AP) distance (mm) from the interaural plane. The lines delineate the region represented in the coronal sections shown below. Bottom, Coronal sections/slices showing damage. AC, Cytochrome oxidase stained histological sections showing the damage in in the three animals. Discontinuities in the gray matter are the damaged regions devoid of neurons and indicated by the arrows. Numbers correspond to AP distance from the interaural plane. For M123, the two hemispheres shown in a single section are in slightly different AP coordinates. The estimates of AP coordinates are based on the Paxinos et al. (2000) stereotaxic atlas. D, Comparison of lesions in the three monkeys shown on the lateral view of the right hemisphere. The lesions were transferred onto the same hemisphere to visualize the extent of overlap between the damage in individual animals. The diagram only shows the lesions in the prearcuate region. ps, Principal sulcus; sar, superior arcuate; iar, inferior arcuate.
Figure 3.
Figure 3.
Lesion effects on direction range thresholds: S2 at 0° range. A, Stimulus configuration during the task. Thresholds were measured by varying direction range during S1. The comparison S2 always moved coherently. The stimuli were placed in the following locations: M123 and M601, ±8° from VM, 2° above HM; M908 and M202 (intact), ±5° from VM, 5° above HM. B, Range thresholds measured at short delays (100 ms delay for M123 and M601; 250 ms delay for M908 and the intact animal M202). There was no difference between ipsilesional and contralesional thresholds for the three animals (M123, p > 0.3; M601, p > 0.6; M908, p > 0.4, t test). The thresholds for the intact monkey were also similar for the two hemifields (p > 0.4, t test). C, Effect of delay on range thresholds in the two hemifields. For each animal, individual thresholds were normalized relative to thresholds measured at the shortest delay and fitted with an exponential function. The data were analyzed with the ANCOVA (see Materials and Methods). D, Comparison of average decay times (tau) computed by fitting an exponential to the ipsilesional and contralesional data for the three lesioned monkeys. The decay time was shorter for the contralesional dataset (ipsi, 16.4 ms ±1.5; contra, 8.8 ms, ±1.6; p = 0.026, two-tailed t test). HM, Horizontal meridian; VM, vertical meridian.
Figure 4.
Figure 4.
Mapping of direction range thresholds. A, C, Range thresholds for M123 and M908 measured at multiple locations in the ipsilesional and contralesional visual fields. Delay between S1 and S2: 1.5 s. For M123, stimuli were 4° diameter, moving at 15°/s. For M908, stimuli were 5° diameter, moving at 10°/s. Threshold values are color-coded (blue-green, higher thresholds, yellow-red, lower thresholds). Note, the superiority of nearly all thresholds measured in ipsilateral hemifields of both monkeys. B, D, Average range thresholds for M123 (B) and M908 (D) computed by combining all values measured within the ipsilesional (blue column) and contralesional (red column) hemifields. In both animals, contralesional thresholds were significantly poorer (M123 and M908, p < 0.000001, two-tail t test). Error bars are SD. HM, Horizontal meridian; VM, vertical meridian.
Figure 5.
Figure 5.
Lesion effects on motion signal thresholds. A, Stimulus configuration used during the task. Thresholds for discriminating directions were measured by varying the proportion of dots moving in the same direction in the field of dots moving in random directions. Stimulus parameters and locations were identical to those used to measure range thresholds (Fig. 3). B, Motion signal thresholds measured at short and longer delays for the three lesioned monkeys. At the shorter delay, all three animals showed similar ipsilesional and contralesional thresholds (M123, p = 0.12; M601, p = 0.3; M908, p = 0.61; two-tailed t test). However, at the longer delay, all three monkeys showed weaker thresholds for contralesional stimuli (M123, p = 0.008; M601, p = 0.04; M908, p = 0.014).
Figure 6.
Figure 6.
Lesion effects on direction range thresholds: S1 at the 0° range. A, Stimulus configuration used during the task. Thresholds were measured by varying direction range during S2. B, Range thresholds measured at the shortest delay in M123 and M908. Stimulus size and locations were identical to those used for data in Figure 4. In both animals, ipsilesional and contralesional thresholds were nearly identical. C, Effect of delay on range thresholds. Individual thresholds were normalized relative to thresholds measured at the shortest delay and fitted with an exponential function. D, Comparison of average decay times (tau) computed by fitting an exponential to the ipsilesional and contralesional data for the two lesioned monkeys. The estimated decay time was shorter for the contralesional dataset (ipsi, 51 ms ±1.3; contra, 10.6 ms, ±2.7; p = 0.005, two-tailed t test).
Figure 7.
Figure 7.
Effects of location uncertainty on ipsilesional and contralesional range thresholds. A, Stimulus configuration during certain (left) and uncertain (right) locations of S2. Stimulus speed: 15°/s (M123 and M601); 10°/s (M908). On trials with certain S2 locations, S1 and S2 always appeared at the same locations within the same hemifield and were separated by 16° (M123; S1: ±8°/8°; S2 ± 8°/−8°), 12deg (M601; S1: ±6°/6°; S2 ± 6°/−6°) and 5° (M908; S1: ±5°/5°; S2 ± 5°/0°). On trials with uncertain locations of S2, S1 always appeared at the same location in the upper quadrant, while S2 appeared with 50% probability at the same location as S1 or in a separate location within the same hemifield. On trials with separated S1 and S2, the distance between them was identical to trials with certain S2 locations (see above). All thresholds were measured with 1.5 s delay between S1 and S2. B, Ipsilesional (blue) and contralesional (red) range thresholds measured in blocks of trials with certain (solid) and uncertain (striped) locations of S2. All three animals showed no significant difference in performance between certain and uncertain blocks of trials with ipsilesional stimuli (M123, p = 0.16; M601, p = 0.26; M908, p = 0.8; two-tailed t test). However, in the contralesional hemifield, the range thresholds were poorer when the location of S2 was uncertain (M123, p = 0.006; M601, p = 0.045; M908, p = 0.018; two-tailed t test). The Welch two-sample t test for the data pooled for the three monkeys also showed a significant effect of uncertainty for the contralesional (p = 0.00015) but not for the ipsilesional hemifield (p = 0.126).

Similar articles

Cited by

References

    1. Barbas H. Anatomic organization of basoventral and mediodorsal visual recipient prefrontal regions in the rhesus monkey. J Comp Neurol. 1988;276:313–342. doi: 10.1002/cne.902760302. - DOI - PubMed
    1. Barceló F, Suwazono S, Knight RT. Prefrontal modulation of visual processing in humans. Nat Neurosci. 2000;3:399–403. doi: 10.1038/73975. - DOI - PubMed
    1. Bartus RT, Levere TE. Frontal decortication in rhesus monkeys: a test of the interference hypothesis. Brain Res. 1977;119:233–248. doi: 10.1016/0006-8993(77)90103-2. - DOI - PubMed
    1. Bisley JW, Pasternak T. The multiple roles of visual cortical areas MT/MST in remembering the direction of visual motion. Cereb Cortex. 2000;10:1053–1065. doi: 10.1093/cercor/10.11.1053. - DOI - PubMed
    1. Bisley JW, Zaksas D, Pasternak T. Microstimulation of cortical area MT affects performance on a visual working memory task. J Neurophysiol. 2001;85:187–196. - PubMed

Publication types

LinkOut - more resources