. 2015 May 6;35(18):7272-86.
doi: 10.1523/JNEUROSCI.4747-14.2015.

Myelin loss and axonal ion channel adaptations associated with gray matter neuronal hyperexcitability

Affiliations

Myelin loss and axonal ion channel adaptations associated with gray matter neuronal hyperexcitability

Mustafa S Hamada et al. J Neurosci. .

Abstract

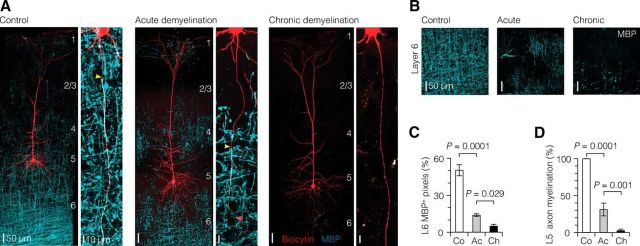
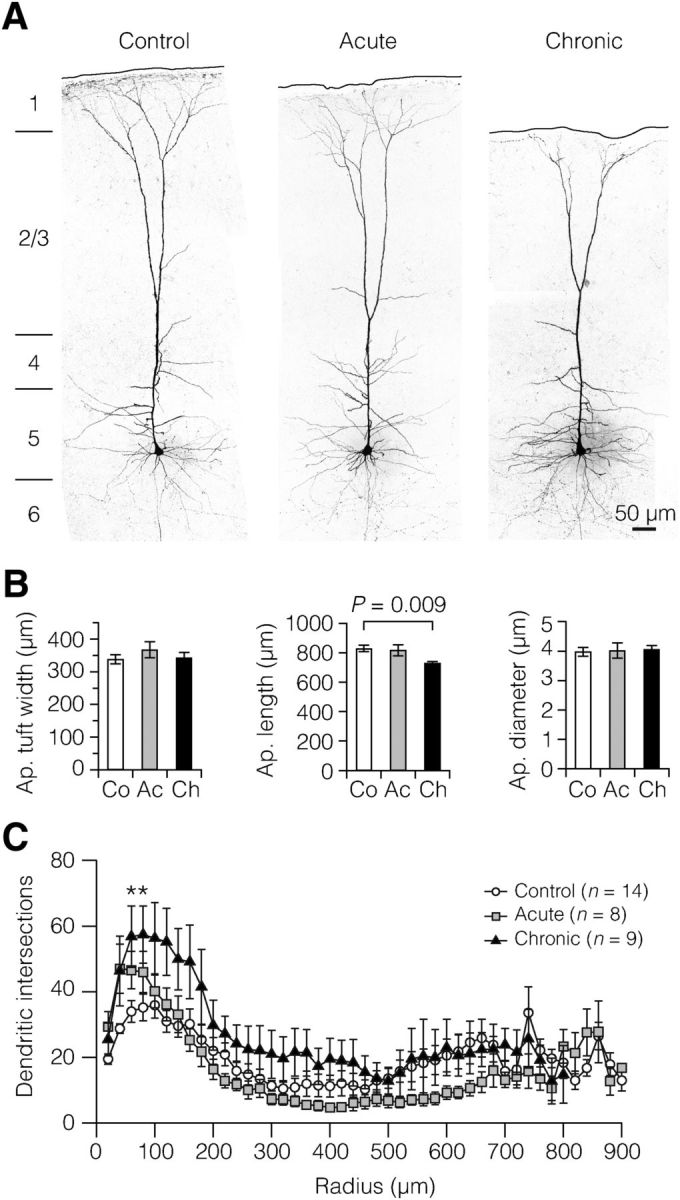
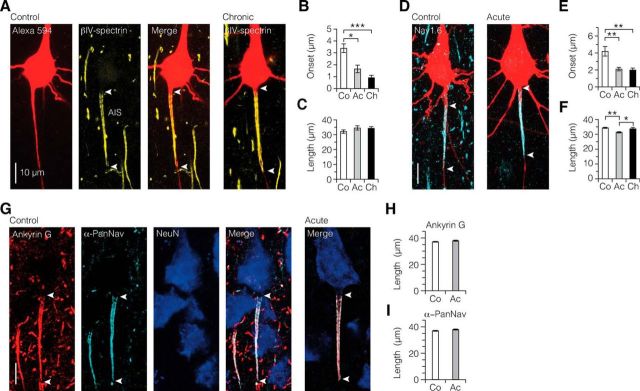
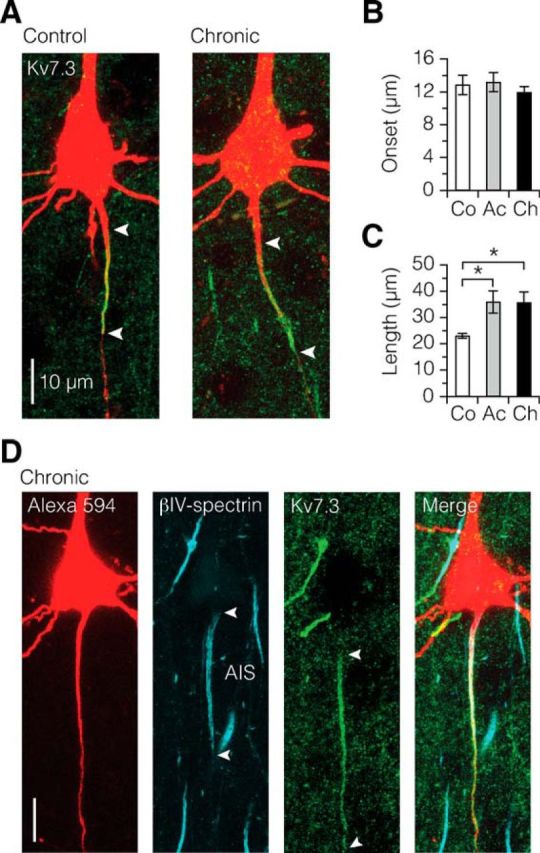
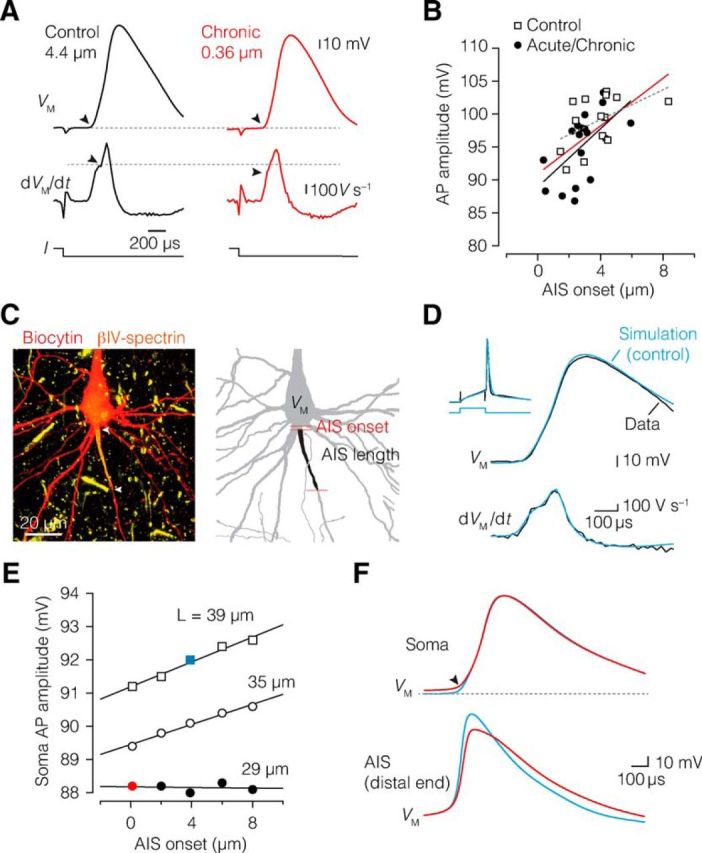
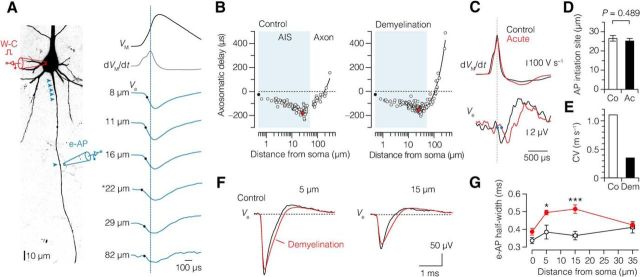
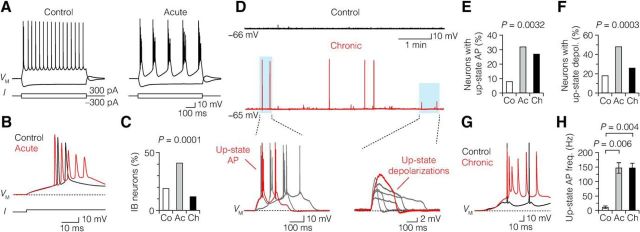
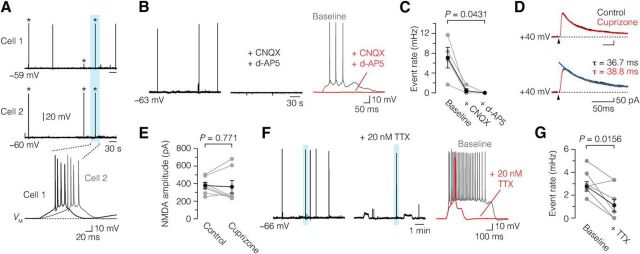
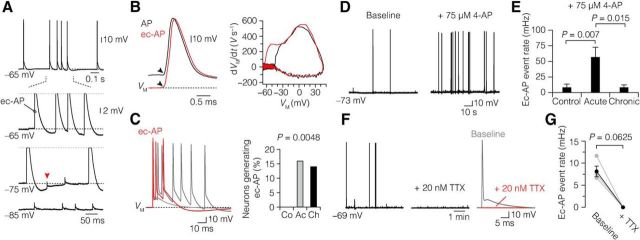
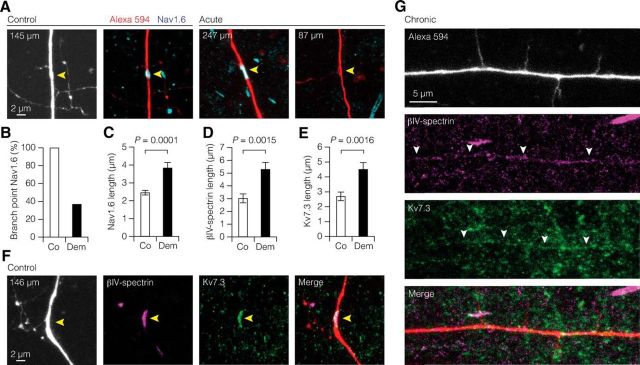
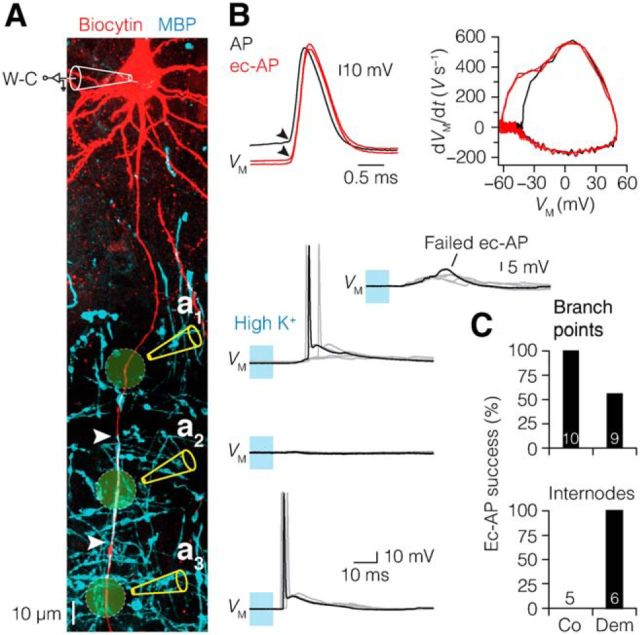
Myelination and voltage-gated ion channel clustering at the nodes of Ranvier are essential for the rapid saltatory conduction of action potentials. Whether myelination influences the structural organization of the axon initial segment (AIS) and action potential initiation is poorly understood. Using the cuprizone mouse model, we combined electrophysiological recordings with immunofluorescence of the voltage-gated Nav1.6 and Kv7.3 subunits and anchoring proteins to analyze the functional and structural properties of single demyelinated neocortical L5 axons. Whole-cell recordings demonstrated that neurons with demyelinated axons were intrinsically more excitable, characterized by increased spontaneous suprathreshold depolarizations as well as antidromically propagating action potentials ectopically generated in distal parts of the axon. Immunofluorescence examination of demyelinated axons showed that βIV-spectrin, Nav1.6, and the Kv7.3 channels in nodes of Ranvier either dissolved or extended into the paranodal domains. In contrast, while the AIS in demyelinated axons started more closely to the soma, ankyrin G, βIV-spectrin, and the ion channel expression were maintained. Structure-function analysis and computational modeling, constrained by the AIS location and realistic dendritic and axonal morphologies, confirmed that a more proximal onset of the AIS slightly reduced the efficacy of action potential generation, suggesting a compensatory role. These results suggest that oligodendroglial myelination is not only important for maximizing conduction velocity, but also for limiting hyperexcitability of pyramidal neurons.

Keywords: Kv7.3; Nav1.6; axon; axon initial segment; demyelination; node of Ranvier.


Figures

Figure 1.
Figure 1.
Graded demyelination of L5 axons in the somatosensory cortex. A, Left, z-projected overview images of the morphology of thick-tufted L5 neurons in the somatosensory cortex (biocytin fill, red) overlaid with immunofluorescence staining for MBP (cyan). Right, Higher-magnification z-projected images show the progressive demyelination of primary L5 axons. Yellow arrowheads indicate the onset of myelin. B, Confocal images of L6 region immunolabeled for MBP expression showing the progressive loss of myelin with increasing cuprizone dosage and treatment duration. C, Quantification of MBP immunofluorescence in L6 region. Control, n = 10; acute, n = 18; chronic, n = 10. D, Bar plot of the extent of myelination of single L5 axons. Control, n = 10; acute, n = 14; chronic, n = 16. One-way ANOVA followed by Bonferroni's post hoc test. Co, Control; Ac, acute; Ch, chronic. Data are presented as mean ± SEM..
Figure 2.
Figure 2.
Chronic demyelination reduces the apical dendrites of L5 neurons. A, Examples of z-projected confocal images of the morphology and whole-cell recorded thick-tufted L5 neurons in the somatosensory cortex. B, Quantification of dendritic morphology showed that chronic demyelination reduces, probably as a result of cortical shrinkage, the apical dendritic length, as determined by the distance between tuft and soma. Apical tuft width: control (Co), n = 16 neurons; acute (Ac), n = 10; chronic (Ch), n = 12. Apical length: Co, n = 17; Ac, n = 10; Ch, n = 12. Apical diameter: Co, n = 17; Ac, n = 8; Ch, n = 12. C, Sholl-plot analysis of dendritic segments within 20 μm distance from the soma. Note the larger number of basal dendritic intersections in the chronic demyelinated group between 60 and 80 μm from the soma. One-way ANOVA followed by Bonferroni's post hoc test, *p = 0.019 (60 μm), *p = 0.026 (80 μm). Data are presented as mean ± SEM.
Figure 3.
Figure 3.
Demyelination-induced ion channel reorganization in the AIS. A, Single fluorescence channels and merged image of z-projected confocal scans of the soma and AIS morphology (Alexa Fluor 594 fill, red) and immunofluorescence labeling of βIV-spectrin (yellow). White arrowheads indicate the onset and extent of βIV-spectrin immunofluorescence identifying the AIS. B, C, Bar plots showing more proximal onset, but maintained length of expression of the AIS βIV-spectrin immunofluorescence. Kruskal–Wallis followed by Dunn post hoc test. Onset: *p = 0.042, ***p = 0.0003. Control, n = 8; acute, n = 13; chronic, n = 16. D–F, Nav1.6 immunofluorescence labeling (cyan) is significantly more proximal in its onset and changed in length in demyelinated axons. Onset: control versus acute, **p = 0.0025; control versus chronic, **p = 0.0043. Length: control versus acute, **p = 0.0023; acute versus chronic, *p = 0.039. Control, n = 14; acute, n = 23; chronic, n = 17. G–I, Confocal images of triple immunofluorescence of ankyrin G, α-PanNav, and NeuN. For both ankyrin G and α-PanNav expression, length was maintained in acute demyelination. Mann–Whitney test. Ankyrin G, p = 0.1647; α-PanNav, p = 0.099. Control, n = 44 AISs; acute, n = 63 AISs.
Figure 4.
Figure 4.
Kv7.3 ion channel expression continues into the first internode in demyelination. A–C, Kv7.3 immunofluorescence labeling (green) reveals a more extensive distribution of signal in demyelinated axons. Length: control versus acute, *p = 0.0375; control versus chronic, *p = 0.0396. Control, n = 8; acute, n = 10; chronic, n = 16. Data are presented as mean ± SEM. D, Confocal z projection of triple immunolabeling of a chronically demyelinated L5 neuron, showing the diffuse expression of Kv7.3 into the formerly myelinated first internode independently of βIV-spectrin coexpression. This diffuse expression of Kv7.3 was found in both acute (n = 3 neurons) and chronic demyelinated (n = 4 neurons) group with expression length range of 44–82 μm.
Figure 5.
Figure 5.
AIS relocation and length reduction impairs AP initiation. A, Neurons with proximal AIS onset generate APs with significantly lower amplitude. Top, Single AP from a control (black) and chronically demyelinated neuron (red) after a current injection (bottom), showing reduced AP amplitude in chronic demyelinated neuron with a more proximal AIS onset. Middle, Differentiated voltage, dVM/dt, of the same traces, with a decreased initial peak (black arrowheads) reflecting a reduced current flow from the AIS during the onset of somatic voltage waveform. Control (black): onset, 4.4 μm; AP amplitude, 103.1 mV; dVM/dt, 390.5 V s−1. Chronic (red): onset, 0.36 μm; AP amplitude, 93.0 mV; dVM/dt, 358.8 V s−1. B, AIS onset significantly correlated with AP amplitude in control (dotted gray line, closed circles; Spearman's ρ = 0.589, p = 0.021, n = 15) and demyelinated neurons (black line, open squares; Spearman's ρ = 0.623, p = 0.004, n = 19). The combined data were fit with a linear function y = 1.8x + 90.9 (red line). Spearman's rank correlation (ρ). C, Left, Confocal projection of the morphology of a thick-tufted L5 neuron labeled for biocytin and βIV-spectrin. Right, 3D reconstruction of the same cell used for computational modeling. D, Overlaid and aligned AP voltage waveforms from the experimental data (black) and simulated neuron (blue) for voltage (top) and time derivative (bottom). The inset shows the 6 ms, ∼1 nA current step, and voltage responses. Note the high degree of similarity between experiment and simulation. E, Adjusting the AIS onset distance (x-axis) and length of the AIS in the model (open and closed circles and open squares) revealed that the length of the AIS had more impact on the somatic AP amplitude compared with AIS onset changes. F, Examples of overlaid and aligned voltage traces of the simulated somatic AP waveform (top) and the AIS (bottom) corresponding to control parameters (blue) and reduced AIS onset and length values as shown in E. Note the broader local AIS AP.
Figure 6.
Figure 6.
Maintained AIS initiation site, increased half-width, and reduced conduction velocity of axonal APs in demyelinated L5 axons. A, z-projected confocal image of a L5 pyramidal neuron illustrating the experimental design of whole-cell (W-C) configuration combined with e-AP recording. Locations of the recording sites for this example are indicated by blue arrowheads. e-AP traces (blue) from one typical recording aligned to the peak of the somatic dVM/dt (black). Black dots indicate the time when 20% of the local e-AP maximum is reached. Asterisk (*) indicates the onset of AP. B, Pooled AP latency plotted versus axonal distance of the recording location in control (left, n = 30 neurons) and demyelinated axons (right, n = 26 acute and 2 chronic neurons). Red data point indicates the average initiation site. C, Top, Time derivative of APs from control (black) and acute demyelinated (red) L5 neurons aligned at peak amplitude. Bottom, e-APs recorded ∼160 μm from the soma of respective neurons. Note the onset delay of the e-AP in the demyelinated axon due to reduction of conduction velocity as a consequence of myelin loss. Closed blue circles indicate the 20% onset of the local e-AP maxima. D, Location of AP initiation is maintained in demyelinated L5 axons. Student's t test. Control, 26.6 ± 1.5 μm, n = 10; acute, 25.3 ± 1.3 μm, n = 12. E, Bar plot showing the decreased conduction velocity (CV) in demyelinated neurons. Control, 1.1 m s−1; demyelination (acute and chronic), 0.35 m s−1. F, Average e-APs recorded at 5 and 15 μm from the soma from control (black) and pooled demyelinated neurons (red, acute, and chronic). Note the broader e-AP half-widths of demyelinated neurons. 0 μm: control, n = 11; n = 14 acute and 9 chronic. 5 μm: control, n = 10; n = 8 acute and 9 chronic. 15 μm: control, n = 10; n = 10 acute and 9 chronic. 35 μm: control, n = 10; n = 10 acute and 9 chronic. G, Plot shows the average half-width of the Na+ component of the e-AP plotted against the location distance. Student's t test, *p = 0.02, ***p = 0.0002. Co, Control; Ac, acute; Dem, demyelination (acute and chronic). Data are presented as mean ± SEM.
Figure 7.
Figure 7.
Demyelination increases burst firing and up-state-like depolarizations in L5 neurons. A, Suprathreshold current injection (bottom) induced burst firing in control (left) and acute demyelinated (right) neuron. B, Overlaid voltage traces in A on an expanded time scale. Note the increase in number of APs in an acute demyelinated neuron (red) in response to the same stimulus, compared with control (black). C, Bar plot showing a significant increase in IB neurons in acute demyelination. χ2 Test. D, Voltage traces of baseline activity at RMP (VM) from chronic demyelinated L5 neurons (middle, red), showing the occurrence of spontaneous up-state APs and depolarizations (blue area), compared with control neuron (top, black). Bottom, Overlaid voltage traces of up-state APs and depolarizations (middle, blue area). E, Bar plot showing a significantly increased subpopulation of acute and chronic demyelinated L5 neurons generating up-state APs. χ2 Test. Control, n = 5 of 61; acute, n = 25 of 79; chronic, n = 27 of 99. F, Subpopulations of neurons with subthreshold up-state depolarizations increased in acute and chronic neurons. χ2 Test. Control, n = 11 of 61; acute, n = 38 of 79; chronic, n = 26 of 99. G, H, Overlaid and aligned up-state AP voltage traces from control (black) and demyelinated neurons (red) on an expanded time scale. Note the high firing frequency of the demyelinated (245.1 Hz) neurons compared with control (23.4 Hz). One-way ANOVA followed by Bonferroni's post hoc test. Control, n = 4 neurons; acute, n = 19 neurons; chronic, n = 24 neurons. Co, control; Ac, acute; Ch, chronic. Data are presented as mean ± SEM.
Figure 8.
Figure 8.
Glutamate-receptor and sodium channel dependence of demyelination-induced spontaneous up-state AP events. A, Top, Simultaneous baseline current-clamp recording from two chronic demyelinated L5 pyramidal neurons (Cell 1 and Cell 2) shows correlated up-state AP events, indicative of a network-driven mechanism. Bottom, Temporally correlated up-state AP events (blue area) on an expanded time, showing the multiple APs of such events. Asterisk (*) indicates synchronous events. B, C, Voltage traces of spontaneous up-state AP events in response to bath application of CNQX (20 μm) and d-AP5 (50 μm). Bath application of CNQX alone reduced the up-state AP event rate (baseline, 7.1 ± 2.1 mHz; with CNQX, 0.42 ± 0.42 mHz). Coapplication of CNQX and d-AP5 led to a complete block of the spontaneous events (0.0 mHz, n = 4 chronic neurons). Friedman followed by Dunn post hoc test. D, E, Top, Overlaid and aligned traces of basal NMDA currents, evoked by lateral stimulation in control condition (black) and during bath application of 100 μm cuprizone (red, n = 7 control neurons). Bottom, Same current traces on an expanded time scale fitted with double-exponential fit (blue lines). NMDA currents were recorded in the presence of 20 μm CNQX and 2 μm gabazine (SR 95531). Bath application of cuprizone did not affect the NMDA current amplitude or the decay time constant (τ). Black arrows indicate extracellular stimulus artifacts. F, G, 20 nm TTX significantly reduced the event rate of up-state AP events in demyelinated L5 neurons (baseline, 2.8 ± 0.4 mHz; with TTX, 1.1 ± 0.5 mHz, n = 2 acute and 6 chronic neurons). Paired Wilcoxon test. Data are presented as mean ± SEM.
Figure 9.
Figure 9.
Ectopic AP generation in demyelinated L5 axons. A, Top, Spontaneous generation of ectopic AP (ec-AP) at resting potential. Bottom, Hyperpolarizing the membrane potential blocks invasion of the ec-APs into the soma and AIS, revealing an axonal spikelet (red arrowhead). B, Left, Ec-AP waveform (red) has a distinctive abrupt voltage deflection from VM compared with the normal AP (black), which is preceded by a slow depolarizing ramp before reaching voltage threshold in the AIS (black arrowheads). Right, Phase plot of dVM/dt versus VM of the same APs highlighting the longer interval between the AIS and somatic peaks of the ec-APs. C, Left, Three voltage traces of ectopic AP from demyelinated (acute and chronic) neurons overlaid and aligned at onset. Right, Bar plot of the percentage of ec-AP-generating neurons. χ2 Test, p = 0.0048. Control, n = 0 of 61; acute, n = 13 of 79; chronic, n = 14 of 99. D, E, Current-clamp baseline recording of 4-AP-induced ec-AP generation from an acute demyelinated L5 neuron. Note the ∼7-fold increase in ec-AP rate in acute demyelinated neurons (baseline, 4.2 ± 3.5 mHz; with 4-AP, 56.7 ± 16 mHz, n = 8) compared with control (baseline, 0 mHz; with 4-AP, 8.1 ± 5.7 mHz, n = 10) and chronic group (baseline, 0.3 ± 0.3 mHz; with 4-AP, 8.2 ± 4.4 mHz, n = 10). Kruskal–Wallis test followed by Dunn post hoc test. F, G, Blocking of Na+ persistent current with 20 nm TTX prevented ec-AP generation (baseline, 8.13 ± 1.2 mHz; with TTX, 0.0 mHz). Paired Wilcoxon test. Acute, n = 2; chronic, n = 2. Data are presented as mean ± SEM.
Figure 10.
Figure 10.
Heterogeneous redistribution of ion channels in demyelinated L5 branch points and internodes. A, z-projected confocal images of double immunofluorescence labeling of a primary L5 axon (Alexa Fluor 594 fill) and Nav1.6 (cyan) at branch points in control and demyelinated axons. Yellow arrowheads indicate branch point location. B, Bar graph showing the loss of Nav1.6-positive branch points of L5 axons. Nav1.6-positive branch points: control, 17 of 17, 6 axons; demyelination, n = 13 of 35, 18 axons; χ2 test, p < 0.0001. C–E, Bar plots of increased nodal expression length of Nav1.6, βIV-spectrin, and Kv7.3 around nodes of demyelinated L5 axons. Nav1.6: control, n = 18 nodes, 6 axons; demyelination, n = 24 nodes, 12 axons. βIV-spectrin: control, n = 15 nodes, 5 axons; demyelination, n = 26 nodes, 9 axons. Kv7.3: control, n = 19 nodes, 6 axons; demyelination, n = 25 nodes, 8 axons. Mann–Whitney test. Co, Control; Dem, demyelination (acute and chronic). Data are presented as mean ± SEM. F, z-projected confocal images of a branch point in control L5 axons filled with Alexa Fluor 594 and immunolabeled with βIV-spectrin (magenta) and Kv7.3 (green). G, Confocal z-projected images of a L5 axon double immunolabeled with βIV-spectrin and Kv7.3. Note the loss of focal expression at axonal branch points but diffuse coexpression of βIV-spectrin and Kv7.3 in the internodal regions (white arrowheads).
Figure 11.
Figure 11.
Enhanced susceptibility of demyelinated internodes to ectopic AP initiation. A, Left, Confocal z-projected image of an acute demyelinated L5 pyramidal neuron co-immunolabeled for biocytin and MBP, illustrating the experimental setup of whole-cell (W-C) recording and local high-[K+] application (10 ms pulse, yellow areas) at fluorescently identified branch points and internodes. White arrows indicate myelinated internode. Right, Examples of overlaid voltage traces (5 consecutive trials) of K+-evoked APs at second branch point (a1), myelinated internode (a2), and demyelinated internode (a3). Inset, Overlaid voltage traces of high-[K+] application failing to evoke ectopic AP (ec-AP) at distal branch point. B, Left, Overlaid AP waveforms of a somatic initiated AP (black) and K+-evoked ec-APs (red, Aa1 and Aa3) from the same neuron temporally aligned at voltage threshold. Note the antidromic waveform of the K+-evoked ec-APs with a voltage threshold (black arrowhead) at VM compared with the normal somatic-initiated AP, which is preceded by a slow depolarizing ramp before reaching voltage threshold in the AIS (black arrowhead). Right, Phase plot of dVM/dt versus VM of the same APs, further highlighting the antidromic nature of the K+-evoked ec-APs by showing the longer interval between the AIS and somatic peaks (red), compared with the control AIS-initiated AP (black). C, Bar plots quantifying the success rate of K+-evoked ec-AP. Ec-APs were evoked at all control axon branch points (n = 10 of 10, 5 axons), but only at some branch points of demyelinated axons (n = 9 of 16, 9 axons). χ2 Test, p = 0.01. Ec-APs were evoked at all demyelinated internodes (n = 6 internodes, 5 axons), but never at myelinated internodes (n = 5 internodes, 4 axons). χ2 Test, p = 0.0009.

References

    1. Baker M, Bostock H. Ectopic activity in demyelinated spinal root axons of the rat. J Physiol. 1992;451:539–552. doi: 10.1113/jphysiol.1992.sp019178. - DOI - PMC - PubMed
    1. Battefeld A, Tran BT, Gavrilis J, Cooper EC, Kole MH. Heteromeric Kv7.2/7.3 channels differentially regulate action potential initiation and conduction in neocortical myelinated axons. J Neurosci. 2014;34:3719–3732. doi: 10.1523/JNEUROSCI.4206-13.2014. - DOI - PMC - PubMed
    1. Beltramo R, D'Urso G, Dal Maschio M, Farisello P, Bovetti S, Clovis Y, Lassi G, Tucci V, De Pietri Tonelli D, Fellin T. Layer-specific excitatory circuits differentially control recurrent network dynamics in the neocortex. Nat Neurosci. 2013;16:227–234. doi: 10.1038/nn.3306. - DOI - PubMed
    1. Boggs JM. Myelin basic protein: a multifunctional protein. Cell Mol Life Sci. 2006;63:1945–1961. doi: 10.1007/s00018-006-6094-7. - DOI - PMC - PubMed
    1. Bostock H, Sears TA. The internodal axon membrane: electrical excitability and continuous conduction in segmental demyelination. J Physiol. 1978;280:273–301. doi: 10.1113/jphysiol.1978.sp012384. - DOI - PMC - PubMed

Publication types

MeSH terms

LinkOut - more resources