. 2015 May 7:6:7052.
doi: 10.1038/ncomms8052.

JMJD1A is a signal-sensing scaffold that regulates acute chromatin dynamics via SWI/SNF association for thermogenesis

Affiliations

JMJD1A is a signal-sensing scaffold that regulates acute chromatin dynamics via SWI/SNF association for thermogenesis

Yohei Abe et al. Nat Commun. .

Abstract

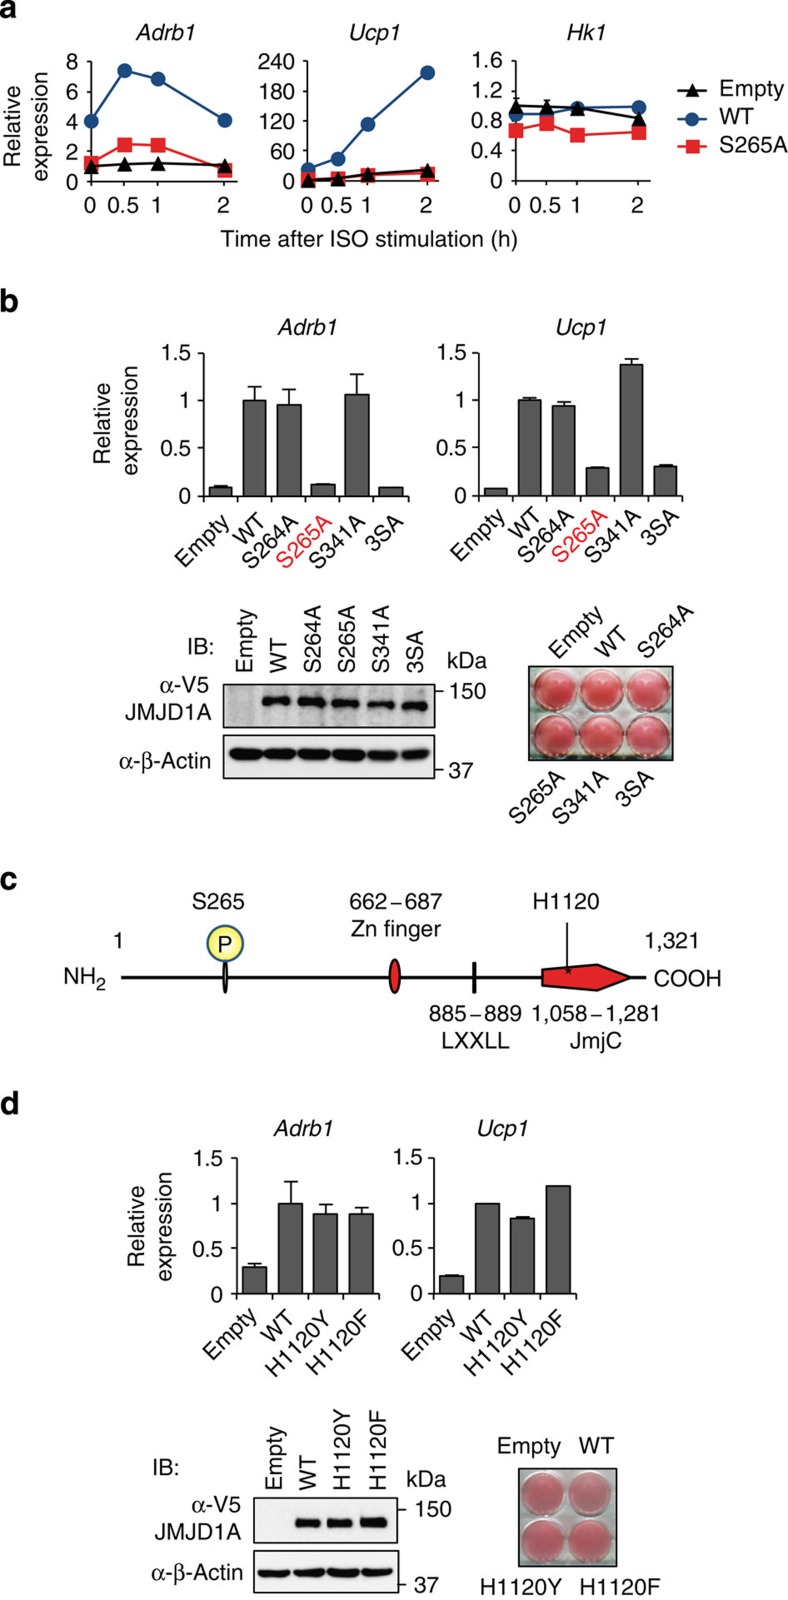
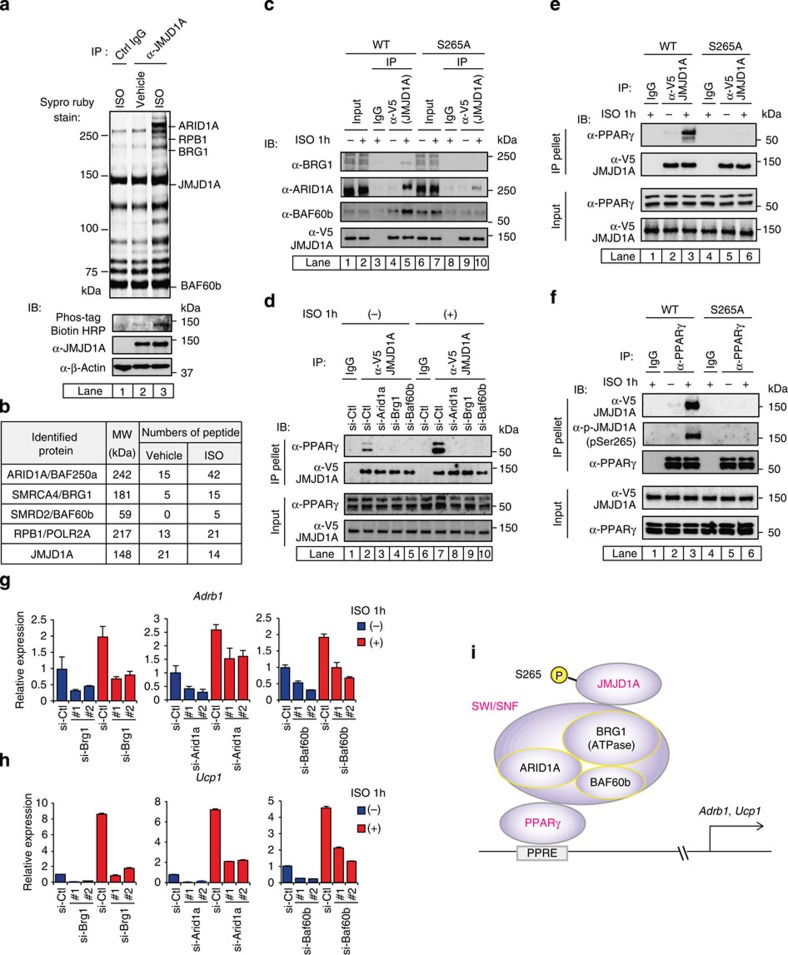
Histone 3 lysine 9 (H3K9) demethylase JMJD1A regulates β-adrenergic-induced systemic metabolism and body weight control. Here we show that JMJD1A is phosphorylated at S265 by protein kinase A (PKA), and this is pivotal to activate the β1-adrenergic receptor gene (Adrb1) and downstream targets including Ucp1 in brown adipocytes (BATs). Phosphorylation of JMJD1A by PKA increases its interaction with the SWI/SNF nucleosome remodelling complex and DNA-bound PPARγ. This complex confers β-adrenergic-induced rapid JMJD1A recruitment to target sites and facilitates long-range chromatin interactions and target gene activation. This rapid gene induction is dependent on S265 phosphorylation but not on demethylation activity. Our results show that JMJD1A has two important roles in regulating hormone-stimulated chromatin dynamics that modulate thermogenesis in BATs. In one role, JMJD1A is recruited to target sites and functions as a cAMP-responsive scaffold that facilitates long-range chromatin interactions, and in the second role, JMJD1A demethylates H3K9 di-methylation.


Figures

Figure 1
Figure 1. β-Adrenergic-dependent genomic localization of JMJD1A.
(a) Genome-wide distribution of JMJD1A binding sites in ISO (1 μM for 2 h) treated iBATs. Ups, upstream; dws, downstream; ISO, isoproterenol. (b) Table depicting TF binding motifs enriched at constituent enhancers within JMJD1A binding regions relative to genomic background and associated Z-scores. (c,d) JMJD1A ChIP-seq and transcriptional microarray analysis performed in iBATs at day 8 of differentiation (day 8). Heatmap represents top 10,000 high SICER scored JMJD1A binding sites under ISO-plus condition (1 μM for 2 h). Colour intensity represents Z-score of JMJD1A binding sites under ISO-minus versus those under ISO-plus condition. The higher the (red/yellow) contrast it becomes, the higher ISO-induced JMJD1A recruitment to the given binding sites relative to ISO-minus. For reference, a colour intensity scale is included (c, left panel). Venn diagram showing the top 2,000 sites annotated ISO-induced JMJD1A binding and the number of ISO-induced genes >20.8-fold by ISO (1 μM for 1 h; c, right panel). The overlapping genes were listed in d. (e) Genome browser shots showing the ISO-induced JMJD1A recruitments on selected genomic regions analysed by ChIP-seq in iBATs (day 8) treated with ISO (1 μM) or vehicle for 2 h (left panel). mRNA levels of Adrb1 and Ucp1 in iBATs (day 8) after ISO (1 μM) treatment at the indicated time points. Data were presented as fold change relative to 0 h (mean±s.e.m.) of three technical replicates (error bars are too tiny to see; right panel).
Figure 2
Figure 2. JMJD1A is phosphorylated at serine 265 by PKA.
(a) Post-translational modifications of JMJD1A identified by mass spectrometry. JMJD1A protein in ISO-treated HeLa cells were immunoprecipitated with anti-hJMJD1A antibody (IgG-F0026), separated by SDS–PAGE gel, stained with SYPRO Ruby and then subjected to in-gel digestion for mass spectrometry (left panel). MS/MS spectrum of the P-JMJD1A fragment from K263 to K274, m/z=672.312 (Z=2) is shown in the right panel. (b) The PKA consensus site is conserved in various species. (c) In vitro PKA kinase assay. WT, S264, S265A or S264A/S265A mutated JMJD1A (a.a. 1–300) recombinant GST-fusion proteins were PKA-treated and subjected to Phos-tag SDS–PAGE followed by immunoblot (IB) analysis with anti-GST antibody. (d) ISO-induced JMJD1A phosphorylation at S265. Whole-cell lysates from WT- or S265A-hJMJD1A expressing iBATshs (day 8) treated with ISO (10 μM for 1 h) were subjected to immunoprecipitation (IP) using anti-mJMJD1A (IgG-F0618) followed by IB analysis with anti-P-S265-JMJD1A. (e) IB analysis showing PKA-mediated phosphorylation of native JMJD1A at S265. iBATs (day 8) were pretreated with PKA inhibitor H89 (20 μM) for 20 min and then treated with ISO (10 μM) for 1 h. Whole-cell lysates were subjected to IP using anti-mJMJD1A (IgG-F0618) and IB analysis with anti-P-S265-JMJD1A. Uncropped images of the blots (ce) are shown in Supplementary Fig. 11.
Figure 3
Figure 3. Phosphorylation of JMJD1A at S265 is crucial for β-adrenergic-induced gene transcriptions.
(a) ISO-induced Adrb1 and Ucp1 mRNA levels in iBATshs stably expressing WT- or S265A-hJMJD1A or empty vector were measured by RT-qPCR. The mRNA values are depicted relative to mRNA in iBATshs transduced with empty vector on day 8 of differentiation before ISO treatment (0 h), which are arbitrarily defined as 1. (b) Adrb1 and Ucp1 mRNA levels in WT or serine to alanine mutants (S264A, S265A, S341A or, 3SA) JMJD1A expressing iBATshs measured by RT-qPCR after 1 h ISO treatment (top panel). 3SA represents all three mutations of S264A, S265A and S341A. Data were presented as fold change relative to WT-hJMJD1A-iBATshs after normalized to cyclophilin. Immunoblot (IB) analysis for WT and various mutant JMJD1A proteins and Oil Red O (ORO) staining (bottom panel). (c) Schematic representation of the domain architecture of hJMJD1A. Phosphorylation site at S265 and Fe(II) binding site at H1120 are shown. (d) Comparable ISO-induced gene expressions of Adrb1 and Ucp1 in WT and demethylase dead JMJD1A mutants expressing iBATshs. RT-qPCR was performed to quantify mRNA levels of Adrb1 and Ucp1 genes in WT-, H1120Y- or H1120F-hJMJD1A- iBATshs treated with ISO for 1 h (top panel). Data were presented as fold change relative to WT-hJMJD1A-iBATshs. IB analysis and ORO in the indicated iBATs (bottom panel). Data are presented as mean±s.e.m. of three technical replicates (a,b,d) (error bars are too tiny to see in some figures). Uncropped images of the blots (b,d) are shown in Supplementary Fig. 11.
Figure 4
Figure 4. Phosphorylation of JMJD1A triggers the interaction with SWI/SNF and PPARγ.
(a,b) JMJD1A-associated proteins were immunoprecipitated with anti-mJMJD1A antibody (IgG-F0231) from 3T3-L1 cells treated with ISO (10 μM for 1 h), separated by SDS–PAGE gel, stained with SYPRO Ruby and then subjected to in-gel digestion for mass spectrometry (a, top panel). Identified proteins were shown in b and Supplementary Fig. 4a. P-JMJD1A protein was demonstrated by immunoblot (IB) analysis using anti-phospho-S265-JMJD1A antibody (a, bottom panel). (c) Nuclear extracts from either WT- or S265A-hJMJD1A-iBATshs were treated with either ISO (10 μM for 1 h) or vehicle and subjected to immunoprecipitation (IP) with anti-V5 antibody and followed by IB analysis with anti-BRG1, anti-ARID1A or anti-BAF60b. (d) ISO-dependent JMJD1A association with PPARγ via ARID1A, BRG1 and BAF60b. WT-hJMJD1A-iBATshs were subjected to IP with anti-V5 and followed by IB with anti-PPARγ antibody (IgG-A3409). (e,f) S265 phosphorylation is crucial for JMJD1A binding to PPARγ. WT or S265A-hJMJD1A-iBATshs were pre-cultured in 0.1% bovine serum albumin containing DMEM for 6 h then treated with ISO (10 μM for 1 h) or vehicle and nuclear extracts from each cells were subjected IP with anti-V5 antibody followed by IB with anti-PPARγ antibody (e). The same extracts were also subjected IP with anti-PPARγ antibody followed by IB with either anti-V5 antibody or anti-P-S265-JMJD1A antibody (f). (g,h) JMJD1A and SWI/SNF complex interaction was functionally linked to gene expressions. Adrb1 and Ucp1 mRNA levels were quantified by RT-qPCR in WT-hJMJD1A-iBATshs transfected with control short interfering RNA (siRNA) or two independent siRNAs specifically targeting Arid1a, Brg1 or Baf60b under either ISO-plus (1 μM for 1 h) or minus condition. Data were presented as fold change relative to control siRNA transfected cells under ISO-minus condition. Error bars represent mean±s.e.m. of three technical replicates. The experiments were performed at least three times and the most representative one is shown. (i) Schematic drawing of JMJD1A–SWI/SNF–PPARγ complex. P-JMJD1A at S265 induces forming a complex with SWI/SNF chromatin remodeler and TF PPARγ recruited to PPRE (Fig. 1b). PPRE, PPAR-responsive element. Uncropped images of the blots (a,cf) are shown in Supplementary Figs 11 and 12.
Figure 5
Figure 5. Co-localization of JMJD1A–SWI/SNF-PPARγ across Adrb1 and Ucp1 genomic regions.
(a) ChIP-seq profiles for H3K4me3, H3K27ac, BRG1, ARID1A, PPARγ and JMJD1A and formaldehyde-assisted isolation of regulatory element (FAIRE)-seq open chromatin profile on Adrb1 and Ucp1 genomic regions. iBATs (day 8) were treated with 1 μM ISO or vehicle for 2 h and subjected to ChIP-seq or FAIRE-seq analysis. Light pink shadows highlight the enhancers from H3K27ac ChIP-seq data. JMJD1A, SWI/SNF components (ARID1A and BRG1) and PPARγ co-localized at distal enhances of Adrb1 and Ucp1. Scale bars, 5 kb. (bh) ChIP–qPCR of ISO-induced binding of JMJD1A (b), ARID1A (c), BRG1 (d), PPARγ (e), H3ac (f), H3K27ac (g), C/EPBα (h), C/EBPβ (h) or C/EBPδ (h) on enhancers each of Adrb1 and Ucp1. Vertical axis represents % input. The experiments in bh were performed at least three times and the representative one is shown. Error bars represent mean±s.e.m. of three technical replicates.
Figure 6
Figure 6. P-JMJD1A mediates PKA-induced enhancer–promoter interaction at the Adrb1 locus.
(ad) 3C-qPCR analysis of the interaction frequency of the restriction fragments with the anchor point fixed near the Adrb1 gene. The grey shadows in a highlight the regions containing E1 and E2 enhancer elements and anchor point. Crosslinked chromatin samples were prepared from differentiated iBATs (day 8) treated with 1 μM ISO or vehicle for 1 h (a), treated with 1 μM ISO for the indicated time periods (b), from WT- and S265A-hJMJD1A iBATshs treated with 20 μM FSK or vehicle for 20 min (c) or from differentiated iBATs transfected with control or two independent Brg1 siRNA treated with 20 μM FSK or vehicle for 20 min (d). Time course of ISO-induced JMJD1A phosphorylation was determined by immunoprecipitation (IP) followed by immunoblot (IB) analysis (b, bottom panel). Uncropped images of the blots are shown in Supplementary Fig. 13. Error bars represent±s.e.m. of three independent experiments. Student's t-test was performed for comparisons in a and analysis of variance were performed followed by Tukey's post hoc comparison in bd. *P<0.05 and ***P<0.001 were considered statistically significant. (e) A schematic model. See the discussion for details.
Figure 7
Figure 7. Looping of two enhancers to the Adrb1 promoter synergistically enhances Adrb1 gene expression.
(a) Luciferase reporter activity driven by Adrb1 promoter and two enhancer elements. iBATs were transfected with the indicated luciferase reporter plasmids (left panel) and cultured with differentiation medium containing 5 μg ml−1 insulin plus 125 μM indomethacin or only insulin for 2 days, then the luciferase activity was measured (right bottom panel). Mutated PPRE consensus sequence in Pro+mut E1 plasmid is shown (top right panel). Data were normalized to Renilla internal control. Error bars represent±s.e.m. of three independent experiments. Analysis of variance were performed followed by Tukey's test, and *P<0.05, **P<0.01 and ***P<0.001 were considered statistically significant. (bd) ISO-induced RNA Pol II recruitment and histone acetylation mark at the vicinity of Adrb1 and Ucp1 genes. ChIP–qPCR analysis of Pol II (b), H3ac (c) and H3K27ac (d) in iBATs at day 8 of differentiation treated with 1 μM ISO for 0, 1 or 2 h at Adrb1 gene (b, top panel). Genome browser shot of the Adrb1 gene from Fig. 5a and the positions of the sets of primers used for the Pol II ChIP–qPCR are denoted (b, top panel). Data are normalized to precipitated DNA (fold enrichment). Error bars represent±s.e.m. of three technical replicates. PPRE, PPAR-responsive element; RLU, relative light unit.
Figure 8
Figure 8. P-S265-JMJD1A induces enhancer–promoter interaction in response to β-adrenergic signalling in brown adipose tissue of mice in vivo.
(a,b) Immunoblot (IB) analyses for P-JMJD1A proteins in the brown adipose tissue from 14-week-old C57BL/6J mice treated with ISO (10 mg kg−1, by subcutaneous (s.c.) injection) for 4 h (a) or 12-week-old C57BL/6J mice placed at 25 or 4 °C for 6 h (b). Whole-cell extracts from brown adipose tissue were subjected to immunoprecipitation (IP) followed by IB analysis. (ce) Dynamic changes in higher-order chromatin conformation of the Adrb1 locus in brown adipose tissue of ISO-induced and cold-exposed mice. 3C-qPCR analysis was performed with the anchor point fixed near the Adrb1 gene in brown adipose tissue of Jmjd1a+/+ mice injected with ISO (10 mg kg−1, by s.c. injection) for 4 h (c) or exposed to 28 or 4 °C for 6 h (d), or Jmjd1a+/+ and Jmjd1a−/− mice exposed to 28 or 4 °C for 6 h (e) as described in Fig. 6a–d. Error bars represent±s.e.m. of three independent experiments. Student's t-test was performed for comparisons in c and d, and analysis of variance were performed followed by Tukey's post hoc comparison in e. *P<0.05 was considered statistically significant. (fh) IB analysis for ADRB1 and ADRB3 proteins in brown adipose tissue from Jmjd1a+/+ or Jmjd1a−/− mice injected with ISO (10 mg kg−1, by s.c. injection) for indicated hours (f), from WT mice placed at 28 or 4 °C for 6 h (n=3 mice per group; g), and brown adipose tissue from Jmjd1a+/+ and Jmjd1a−/− mice exposed to 4 °C for 6 h (n=3 mice per group; h). Uncropped images of the blots (a,b,fh) are shown in Supplementary Fig. 13.

References

    1. Altarejos J. Y. & Montminy M. CREB and the CRTC co-activators: sensors for hormonal and metabolic signals. Nat. Rev. Mol. Cell Biol. 12, 141–151 (2011). - PMC - PubMed
    1. Kozak U. C. et al.. An upstream enhancer regulating brown-fat-specific expression of the mitochondrial uncoupling protein gene. Mol. Cell. Biol. 14, 59–67 (1994). - PMC - PubMed
    1. Nedergaard J. et al.. UCP1: the only protein able to mediate adaptive non-shivering thermogenesis and metabolic inefficiency. Biochim. Biophys. Acta 1504, 82–106 (2001). - PubMed
    1. Kooistra S. M. & Helin K. Molecular mechanisms and potential functions of histone demethylases. Nat. Rev. Mol. Cell Biol. 13, 297–311 (2012). - PubMed
    1. Yamane K. et al.. JHDM2A, a JmjC-containing H3K9 demethylase, facilitates transcription activation by androgen receptor. Cell 125, 483–495 (2006). - PubMed

Publication types

MeSH terms