Multiple sclerosis patient-derived CSF induces transcriptional changes in proliferating oligodendrocyte progenitors
- PMID: 25948622
- PMCID: PMC4628566
- DOI: 10.1177/1352458515573094
Multiple sclerosis patient-derived CSF induces transcriptional changes in proliferating oligodendrocyte progenitors
Abstract
Background: Cerebrospinal fluid (CSF) is in contact with brain parenchyma and ventricles, and its composition might influence the cellular physiology of oligodendrocyte progenitor cells (OPCs) thereby contributing to multiple sclerosis (MS) disease pathogenesis.
Objective: To identify the transcriptional changes that distinguish the transcriptional response induced in proliferating rat OPCs upon exposure to CSF from primary progressive multiple sclerosis (PPMS) or relapsing remitting multiple sclerosis (RRMS) patients and other neurological controls.
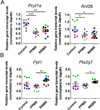
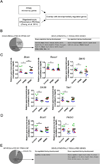
Methods: We performed gene microarray analysis of OPCs exposed to CSF from neurological controls, or definitive RRMS or PPMS disease course. Results were confirmed by quantitative reverse transcriptase polymerase chain reaction, immunocytochemistry and western blot of cultured cells, and validated in human brain specimens.
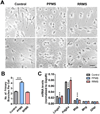
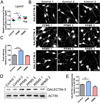
Results: We identified common and unique oligodendrocyte genes for each treatment group. Exposure to CSF from PPMS uniquely induced branching of cultured progenitors and related transcriptional changes, including upregulation (P<0.05) of the adhesion molecule GALECTIN-3/Lgals3, which was also detected at the protein level in brain specimens from PPMS patients. This pattern of gene expression was distinct from the transcriptional programme of oligodendrocyte differentiation during development.
Conclusions: Despite evidence of morphological differentiation induced by exposure to CSF of PPMS patients, the overall transcriptional response elicited in cultured OPCs was consistent with the activation of an aberrant transcriptional programme.
Keywords: Cerebrospinal fluid; differentiation; gene expression; oligodendrocyte progenitor cells.
© The Author(s), 2015.
Figures


Similar articles
-
Cerebrospinal fluid derived from progressive multiple sclerosis patients promotes neuronal and oligodendroglial differentiation of human neural precursor cells in vitro.Neuroscience. 2013 Oct 10;250:614-21. doi: 10.1016/j.neuroscience.2013.07.022. Epub 2013 Jul 19. Neuroscience. 2013. PMID: 23876320
-
CXCL10 and CXCL13 chemokines in patients with relapsing remitting and primary progressive multiple sclerosis.J Neurol Sci. 2017 Sep 15;380:22-26. doi: 10.1016/j.jns.2017.06.048. Epub 2017 Jun 30. J Neurol Sci. 2017. PMID: 28870573
-
Characteristic cerebrospinal fluid cytokine/chemokine profiles in neuromyelitis optica, relapsing remitting or primary progressive multiple sclerosis.PLoS One. 2013 Apr 18;8(4):e61835. doi: 10.1371/journal.pone.0061835. Print 2013. PLoS One. 2013. PMID: 23637915 Free PMC article.
-
Primary progressive multiple sclerosis: cerebrospinal fluid considerations.Mult Scler. 2004 Jun;10 Suppl 1:S31-4; discussion S34-5. doi: 10.1191/1352458504ms1028oa. Mult Scler. 2004. PMID: 15218807 Review.
-
Immunological differences between classical phenothypes of multiple sclerosis.J Neurol Sci. 2015 Feb 15;349(1-2):10-4. doi: 10.1016/j.jns.2014.12.035. Epub 2015 Jan 2. J Neurol Sci. 2015. PMID: 25586536 Review.
Cited by
-
People with Primary Progressive Multiple Sclerosis Have a Lower Number of Central Memory T Cells and HLA-DR+ Tregs.Cells. 2023 Jan 29;12(3):439. doi: 10.3390/cells12030439. Cells. 2023. PMID: 36766781 Free PMC article.
-
Body Mass Index in Multiple Sclerosis modulates ceramide-induced DNA methylation and disease course.EBioMedicine. 2019 May;43:392-410. doi: 10.1016/j.ebiom.2019.03.087. Epub 2019 Apr 10. EBioMedicine. 2019. PMID: 30981648 Free PMC article.
-
Galectin-3, a rising star in modulating microglia activation under conditions of neurodegeneration.Cell Death Dis. 2022 Jul 20;13(7):628. doi: 10.1038/s41419-022-05058-3. Cell Death Dis. 2022. PMID: 35859075 Free PMC article. Review.
-
Cerebrospinal fluid of progressive multiple sclerosis patients reduces differentiation and immune functions of oligodendrocyte progenitor cells.Glia. 2022 Jun;70(6):1191-1209. doi: 10.1002/glia.24165. Epub 2022 Mar 9. Glia. 2022. PMID: 35266197 Free PMC article.
-
Extracellular Galectin-3 Induces Accelerated Oligodendroglial Differentiation Through Changes in Signaling Pathways and Cytoskeleton Dynamics.Mol Neurobiol. 2019 Jan;56(1):336-349. doi: 10.1007/s12035-018-1089-6. Epub 2018 Apr 27. Mol Neurobiol. 2019. PMID: 29704198
References
-
- Franklin RJ, Ffrench-Constant C. Remyelination in the CNS: from biology to therapy. Nature reviews Neuroscience. 2008;9:839–855. - PubMed
-
- Hagemeier K, Bruck W, Kuhlmann T. Multiple sclerosis - remyelination failure as a cause of disease progression. Histology and histopathology. 2012;27:277–287. - PubMed
-
- Franklin RJ. Why does remyelination fail in multiple sclerosis? Nature reviews Neuroscience. 2002;3:705–714. - PubMed
-
- Rossi S, Motta C, Studer V, et al. Tumor necrosis factor is elevated in progressive multiple sclerosis and causes excitotoxic neurodegeneration. Multiple sclerosis. 2014;20:304–312. - PubMed
Publication types
MeSH terms
Substances
Grants and funding
LinkOut - more resources
Full Text Sources
Other Literature Sources
Molecular Biology Databases

