. 2015 Jul;43(7):1061-70.
doi: 10.1124/dmd.114.061440. Epub 2015 May 6.

Upregulation of UGT2B4 Expression by 3'-Phosphoadenosine-5'-Phosphosulfate Synthase Knockdown: Implications for Coordinated Control of Bile Acid Conjugation

Affiliations

Upregulation of UGT2B4 Expression by 3'-Phosphoadenosine-5'-Phosphosulfate Synthase Knockdown: Implications for Coordinated Control of Bile Acid Conjugation

Kathleen G Barrett et al. Drug Metab Dispos. 2015 Jul.

Abstract

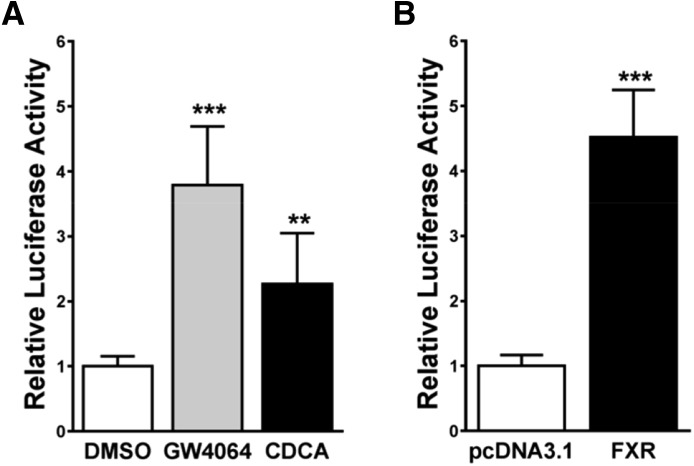
During cholestasis, the bile acid-conjugating enzymes, SULT2A1 and UGT2B4, work in concert to prevent the accumulation of toxic bile acids. To understand the impact of sulfotransferase deficiency on human hepatic gene expression, we knocked down 3'-phosphoadenosine-5'-phosphosulfate synthases (PAPSS) 1 and 2, which catalyze synthesis of the obligate sulfotransferase cofactor, in HepG2 cells. PAPSS knockdown caused no change in SULT2A1 expression; however, UGT2B4 expression increased markedly (∼41-fold increase in UGT2B4 mRNA content). Knockdown of SULT2A1 in HepG2 cells also increased UGT2B4 expression. To investigate the underlying mechanism, we transfected PAPSS-deficient HepG2 cells with a luciferase reporter plasmid containing ∼2 Kb of the UGT2B4 5'-flanking region, which included a response element for the bile acid-sensing nuclear receptor, farnesoid X receptor (FXR). FXR activation or overexpression increased UGT2B4 promoter activity; however, knocking down FXR or mutating or deleting the FXR response element did not significantly decrease UGT2B4 promoter activity. Further evaluation of the UGT2B4 5'-flanking region indicated the presence of distal regulatory elements between nucleotides -10090 and -10037 that negatively and positively regulated UGT2B4 transcription. Pulse-chase analysis showed that increased UGT2B4 expression in PAPSS-deficient cells was attributable to both increased mRNA synthesis and stability. Transfection analysis demonstrated that the UGT2B4 3'-untranslated region decreased luciferase reporter expression less in PAPSS-deficient cells than in control cells. These data indicate that knocking down PAPSS increases UGT2B4 transcription and mRNA stability as a compensatory response to the loss of SULT2A1 activity, presumably to maintain bile acid-conjugating activity.


Figures

Fig. 1.
Fig. 1.
Lack of effect of PAPSS1 and PAPSS2 knockdown on SULT2A1 expression in HepG2 cells. SULT2A1 mRNA (A) and protein (B) levels were measured in shNT and shPAPSS1/2 cells using TaqMan Gene Expression Assays and western blot analysis, respectively. (A) Each bar represents the mean mRNA level ± S.E.M. (relative to shNT cells) from three independent experiments. (B) Shows the immunoreactive bands from two independent experiments.
Fig. 2.
Fig. 2.
PAPSS1 and PAPSS2 knockdown increases UGT2B4 expression in HepG2 cells. UGT2B4 mRNA (A) and protein (B, C) levels were measured in shNT and shPAPSS1/2 cells using TaqMan Gene Expression Assays and western blot analysis, respectively. (A) Each bar represents the mean mRNA level ± S.E.M. (relative to shNT cells) from four independent experiments. ***Significantly different from shNT, P < 0.001 using ratio paired t test. (B) Shows the immunoreactive bands from one representative experiment; (C) shows the densitometrically quantified data from four independent experiments; each bar represents the mean ratio of UGT2B4/β-actin ± S.E.M. (relative to shNT cells). **Significantly different from shNT, P < 0.01 by paired t test.
Fig. 3.
Fig. 3.
SULT2A1 knockdown increases UGT2B4 expression in HepG2 cells. UGT2B4 mRNA (A) and protein (B, C) levels were measured in shNT and shSULT2A1 cells using TaqMan Gene Expression Assays and western blot analysis, respectively. (A) Each bar represents the mean relative mRNA level ± S.E.M. from three independent experiments. *Significantly different from shNT, P < 0.05 using ratio paired t test. (B) Shows the immunoreactive bands from one representative experiment; (C) shows the densitometrically quantified data from three independent experiments; each bar represents the mean ratio of UGT2B4/β-actin ± S.E.M. (relative to shNT cells). *Significantly different from shNT, P < 0.05 by paired t test.
Fig. 4.
Fig. 4.
UGT2B4 promoter activity is greater in shPAPSS1/2 than shNT HepG2 cells. shNT and shPAPSS1/2 cells were transfected with a luciferase reporter construct containing 1991 nucleotides of the 5′-flanking region of the UGT2B4 gene. Forty-eight hours after transfection, cells were harvested for measurement of luciferase activities. Each bar represents the mean ± S.D. normalized (firefly/Renilla) luciferase activity relative to the activity that was measured for the shNT cells (n = 9 wells per group, derived from combining data from three independent experiments with triplicate transfection). ***Significantly different from shNT, P < 0.001 by unpaired t test.
Fig. 5.
Fig. 5.
UGT2B4 promoter response to FXR agonists and FXR overexpression in shPAPSS1/2 cells. (A) shPAPSS1/2 cells were transfected with a reporter construct containing 1991 nucleotides of the 5′-flanking region of the UGT2B4 gene. Twenty-four hours after transfection, cells were treated with 0.1% dimethylsulfoxide (DMSO), 10 μM GW4064, or 100 μM chenodeoxycholic acid (CDCA). (B) shPAPSS1/2 cells were cotransfected with (−1991:+13)-UGT2B4-Luc and FXR expression plasmid or the empty expression vector, pcDNA3.1. Forty-eight hours after transfection, cells were harvested and luciferase activities were measured. Each bar represents the mean ± S.D. normalized (firefly/Renilla) luciferase activity relative to the activity measured in DMSO-treated or pcDNA3.1-transfected cells (n = 6 wells per group, derived from combining data from two independent experiments with triplicate transfection). **Significantly different from DMSO, P < 0.01; ***Significantly different from DMSO or pcDNA3.1, P < 0.001 by one-way analysis of variance and Neuman-Keuls test (A) or unpaired t test (B).
Fig. 6.
Fig. 6.
Effect of knocking down FXR on UGT2B4 promoter activity in shPAPSS1/2 cells. (A) shPAPSS1/2 cells were transfected with a FXR-responsive reporter plasmid. Half of the cells were cotransfected with nontargeting siRNA, the other half with siRNA targeting FXR. Twenty-four hours after transfection cells were treated with 0.1% dimethylsulfoxide (DMSO) or 10 μM GW4064. (B) shPAPSS1/2 cells were transfected with a reporter construct containing 1991 nucleotides of the 5′-flanking region of the UGT2B4 gene; designated (−1991:+13)-UGT2B4-Luc. Half of the cells were cotransfected with nontargeting siRNA, the other half with FXR siRNA. Twenty-four hours after transfection, all cells were treated with 0.1% DMSO. Forty-eight hours after transfection, cells were harvested and luciferase activities were measured. Each bar represents the mean ± S.D. normalized (firefly/Renilla) luciferase activity (n = 6 wells per group, derived from combining data from two independent experiments with triplicate transfection). In each panel, the mean value for the DMSO-treated, nontargeting (NT) siRNA-transfected shPAPSS1/2 cell group is defined as 1. Groups not sharing an upper case letter are significantly different from each other, P < 0.05 (by one-way analysis of variance and Neuman-Keuls test).
Fig. 7.
Fig. 7.
Effect of mutating a FXRE on UGT2B4 promoter activity in shPAPSS1/2 cells. shPAPSS1/2 cells were transfected with a reporter construct containing 1991 nucleotides of the 5′-flanking region of the UGT2B4 gene, designated (−1991:+13)-UGT2B4-Luc, with either the wild-type FXRE (WT FXRE) or mutated FXRE (Mut FXRE). shNT cells were transfected with the reporter containing the WT FXRE. Forty-eight hours after transfection, cells were harvested and luciferase activities were measured. Each bar represents the mean ± S.D. of normalized (firefly/Renilla) luciferase measurements relative to the activity measured in WT FXRE–transfected shPAPSS1/2 cells (n = 6 wells per group, derived from combining data from two independent experiments with triplicate transfection). Groups not sharing an upper case letter are significantly different from each other, P < 0.05 (by one-way analysis of variance and Neuman-Keuls test).
Fig. 8.
Fig. 8.
Promoter activities of a nested deletion series of reporter plasmids constructed from (−1991:+13)-UGT2B4-Luc. shNT and shPAPSS1/2 cells were transfected with the indicated reporter plasmids. Forty-eight hours after transfection, cells were harvested for measurement of luciferase activities. Each bar represents the mean ± S.D. of normalized (firefly/Renilla) luciferase measurements relative to the activity measure in shNT cells transfected with (−112:+13)-UGT2B4-Luc (n = 6 wells per group, derived from combining data from two independent experiments with triplicate transfection). For shNT cells, groups not sharing an upper case letter are significantly different from each other, P < 0.05. For shPAPSS1/2 cells, groups not sharing a lower case letter are significantly different from each other, P < 0.05 (by one-way analysis of variance and Neuman-Keuls test).
Fig. 9.
Fig. 9.
Transient transfection analysis of the effects of upstream 5′-flanking regions of the UGT2B4 gene on promoter activity in shPAPSS1/2 cells and shNT cells. The indicated 5′-flanking regions of the UGT2B4 gene were ligated into the pGL4.10 plasmid upstream of nucleotides −112 to +13, which served as the common proximal promoter for all constructs. Reporter activities of (−1991:+13)-UGT2B4-Luc, used in previous experiments (labeled −1991), (−112:+13)-UGT2B4-Luc, and pGL4.10 empty vector are shown for comparison. shNT and shPAPSS1/2 cells were transfected with the reporters and 48 hours later were harvested for measurement of luciferase activities. Each bar represents the mean ± S.D. of normalized (firefly/Renilla) luciferase measurements relative to the activity measured in cells transfected with (−112:+13)-UGT2B4-Luc within each cell line (n = 12 wells per group, derived from combining data from four independent experiments with triplicate transfection). For shNT cells, groups not sharing an upper case letter are significantly different from each other, P < 0.05. For shPAPSS1/2 cells, groups not sharing a lower case letter are significantly different from each other, P < 0.05 (by one-way analysis of variance and Neuman-Keuls test).
Fig. 10.
Fig. 10.
Impact of LS mutagenesis on the activity of the (−10503:−10037)(−112:+13)-UGT2B4-Luc reporter. LS mutants and two deletion constructs were constructed from (−10503:−10037)(−112:+13)-UGT2B4-Luc. LS1–LS9 mutants span nucleotides −10090 to −10037. shNT and shPAPSS1/2 cells were transfected with the reporters as indicated. Forty-eight hours later, cells were harvested for measurement of luciferase activities. Each bar represents the mean ± S.D. of normalized (firefly/Renilla) luciferase measurements relative to the activity measured in cells transfected with (−112:+13)-UGT2B4-Luc within each cell line (n = 12 wells per group, derived from combining data from four independent experiments with triplicate transfection). For shNT cells, groups not sharing an upper case letter are significantly different from each other, P < 0.05. For shPAPSS1/2 cells, groups not sharing a lower case letter are significantly different from each other, P < 0.05 (by one-way analysis of variance and Neuman-Keuls test).
Fig. 11.
Fig. 11.
Impact of UGT2B4 3′-UTR on luciferase activity in shNT and shPAPSS1/2 cells. The UGT2B4 3′-UTR was ligated downstream from the Luc gene in the pmirGLO luciferase reporter vector. UGT2B4-3′-UTR/pmirGLO or empty vector was transfected into shNT or shPAPSS1/2 cells, and 48 hours later cells were harvested for measurement of luciferase activities. Each bar represents the mean ratio ± S.E.M. (n = 8 independent experiments) of normalized (firefly/Renilla) UGT2B4 3′-UTR luciferase measurements relative to the activity measured in cells transfected with the empty vector within each cell line. *Significantly different from shNT, P < 0.05 by paired t test.

Similar articles

Cited by

References

    1. Araya Z, Wikvall K. (1999) 6α-hydroxylation of taurochenodeoxycholic acid and lithocholic acid by CYP3A4 in human liver microsomes. Biochim Biophys Acta 1438:47–54. - PubMed
    1. Barbier O, Torra IP, Sirvent A, Claudel T, Blanquart C, Duran-Sandoval D, Kuipers F, Kosykh V, Fruchart JC, Staels B. (2003) FXR induces the UGT2B4 enzyme in hepatocytes: a potential mechanism of negative feedback control of FXR activity. Gastroenterology 124:1926–1940. - PubMed
    1. Barre L, Fournel-Gigleux S, Finel M, Netter P, Magdalou J, Ouzzine M. (2007) Substrate specificity of the human UDP-glucuronosyltransferase UGT2B4 and UGT2B7. Identification of a critical aromatic amino acid residue at position 33. FEBS J 274:1256–1264. - PubMed
    1. Barrett KG, Fang H, Gargano MD, Markovich D, Kocarek TA, Runge-Morris M. (2013) Regulation of murine hepatic hydroxysteroid sulfotransferase expression in hyposulfatemic mice and in a cell model of 3′-phosphoadenosine-5′-phosphosulfate deficiency. Drug Metab Dispos 41:1505–1513. - PMC - PubMed
    1. Cartharius K, Frech K, Grote K, Klocke B, Haltmeier M, Klingenhoff A, Frisch M, Bayerlein M, Werner T. (2005) MatInspector and beyond: promoter analysis based on transcription factor binding sites. Bioinformatics 21:2933–2942. - PubMed

Publication types

MeSH terms

LinkOut - more resources