. 2015 Jul 1;309(1):C38-50.
doi: 10.1152/ajpcell.00388.2014. Epub 2015 May 6.

Tumor necrosis factor-α induces a biphasic change in claudin-2 expression in tubular epithelial cells: role in barrier functions

Affiliations

Tumor necrosis factor-α induces a biphasic change in claudin-2 expression in tubular epithelial cells: role in barrier functions

Yasaman Amoozadeh et al. Am J Physiol Cell Physiol. .

Abstract

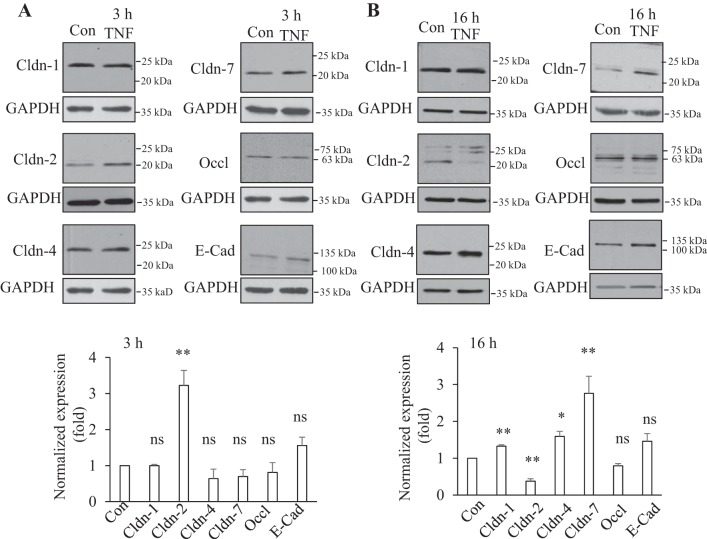
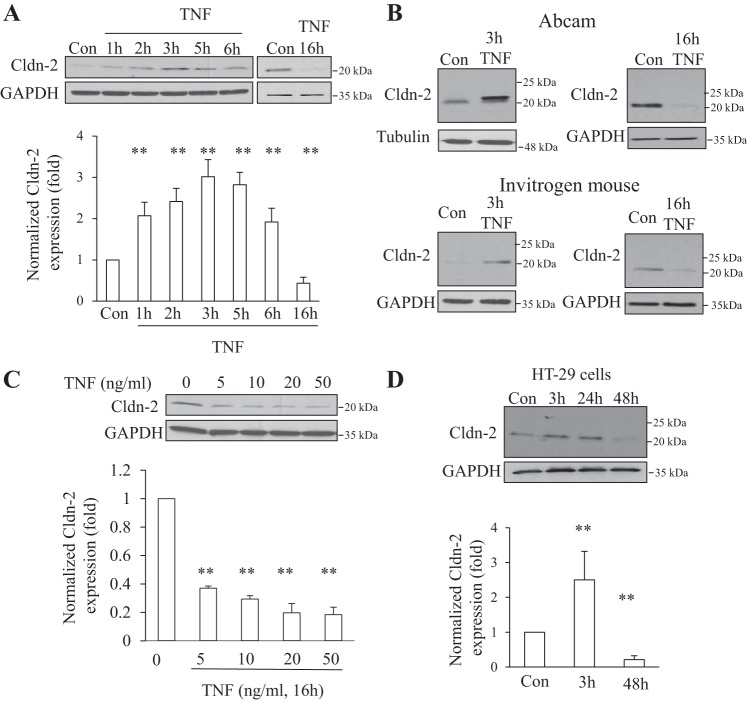
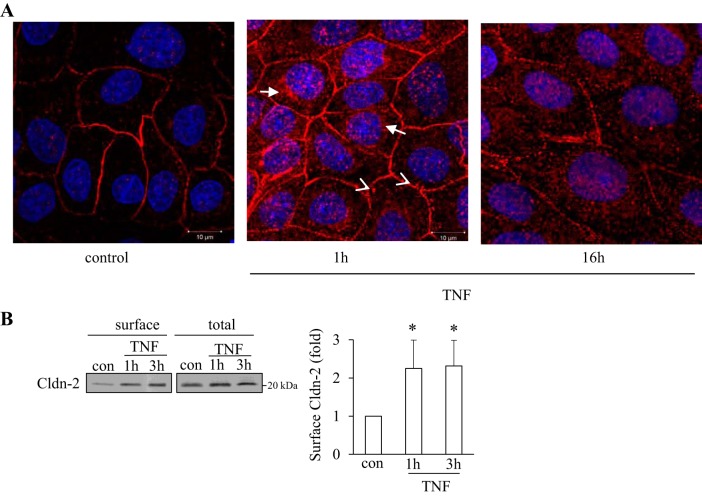
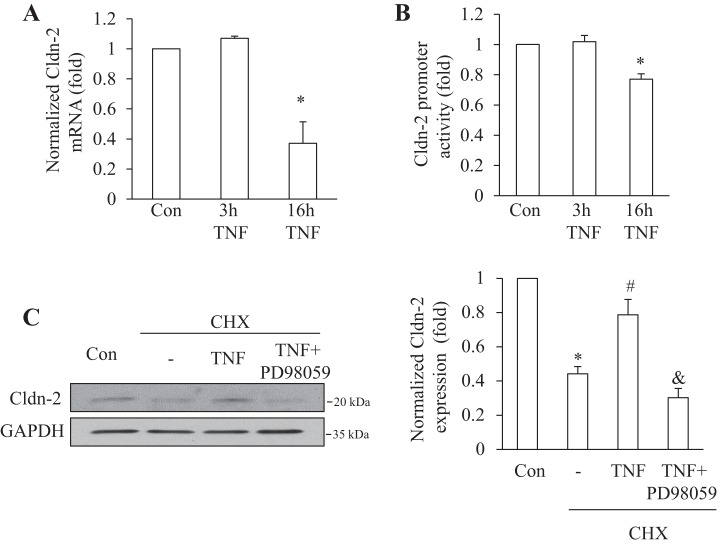
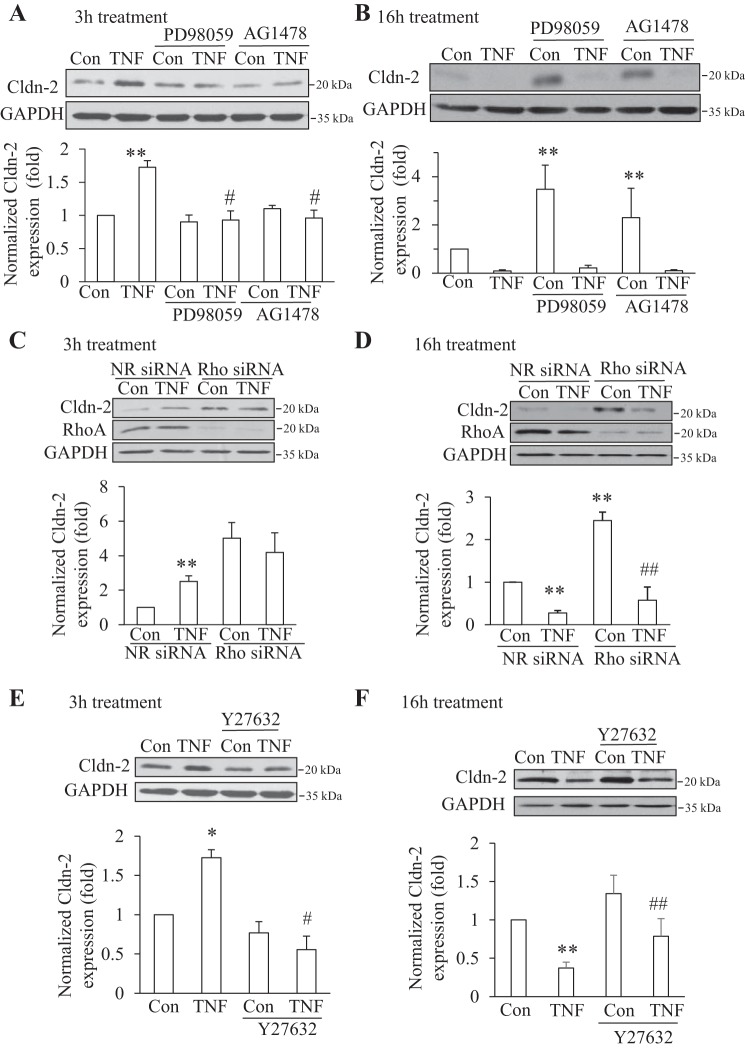
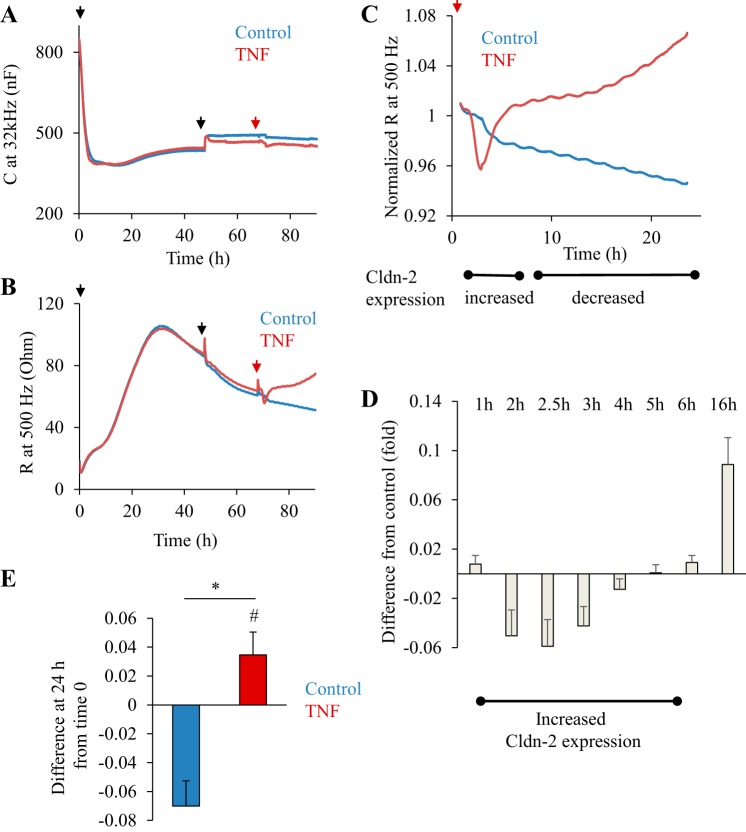
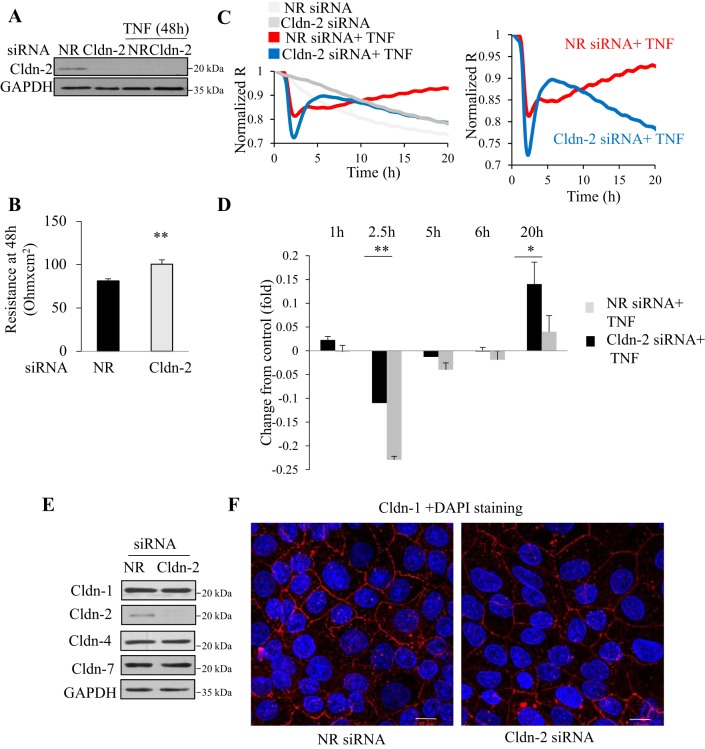
The inflammatory cytokine tumor necrosis factor-α (TNF-α) is a pathogenic factor in acute and chronic kidney disease. TNF-α is known to alter expression of epithelial tight junction (TJ) proteins; however, the underlying mechanisms and the impact of this effect on epithelial functions remain poorly defined. Here we describe a novel biphasic effect of TNF-α on TJ protein expression. In LLC-PK1 tubular cells, short-term (1-6 h) TNF-α treatment selectively elevated the expression of the channel-forming TJ protein claudin-2. In contrast, prolonged (>8 h) TNF-α treatment caused a marked downregulation in claudin-2 and an increase in claudin-1, -4, and -7. The early increase and the late decrease in claudin-2 expression involved distinct mechanisms. TNF-α slowed claudin-2 degradation through ERK, causing the early increase. This increase was also mediated by the EGF receptor and RhoA and Rho kinase. In contrast, prolonged TNF-α treatment reduced claudin-2 mRNA levels and promoter activity independent from these signaling pathways. Electric Cell-substrate Impedance Sensing measurements revealed that TNF-α also exerted a biphasic effect on transepithelial resistance (TER) with an initial decrease and a late increase. Thus there was a good temporal correlation between TNF-α-induced claudin-2 protein and TER changes. Indeed, silencing experiments showed that the late TER increase was at least in part caused by reduced claudin-2 expression. Surprisingly, however, claudin-2 silencing did not prevent the early TER drop. Taken together, the TNF-α-induced changes in claudin-2 levels might contribute to TER changes and could also play a role in newly described functions of claudin-2 such as proliferation regulation.

Keywords: ECIS; tight junction; transepithelial resistance; tubular epithelial cells; tumor necrosis factor.


Figures

Fig. 1.
Fig. 1.
Differential effect of short-term and long-term TNF-α treatment on tight junction (TJ) proteins. Confluent LLC-PK1 cells were treated with 10 ng/ml TNF-α for 3 (A) or 16 h (B). Cells were lysed and the levels of claudin (Cldn)-1, -2, -4, and -7, as well as occludin and E-cadherin were detected by Western blotting. The blots were redeveloped to detect GAPDH as loading control. In the densitometric analysis signals from the specific proteins were normalized using the GAPDH signal. In each experiment the normalized levels of TNF-α-treated samples were expressed as a fold change from the control taken as 1. The graphs show means ± SE (n ≥ 3). For statistical analysis each value was compared with the corresponding control using Student's t-test. *P < 0.05; **P < 0.01; ns: nonsignificant vs. control.
Fig. 2.
Fig. 2.
TNF-α altered Cldn-2 expression causing an early increase and a late decrease. A: confluent LLC-PK1 cells were treated with 10 ng/ml TNF-α for the indicated times. Cldn-2 was detected using a rabbit polyclonal antibody from Invitrogen. Cldn-2 levels were normalized using GAPDH and quantified as in Fig 1. The graphs show means ± SE (n ≥ 3). **P < 0.01 vs. control. B: verification of Cldn-2 expression changes using different antibodies. Lysates from cells treated with 10 ng/ml TNF-α for 3 and 16 h as in A were tested by Western blotting with 2 different Cldn-2 antibodies, as indicated. Top blots show results using a polyclonal antibody from Abcam; bottom blots were developed with a monoclonal antibody from Invitrogen. The blots are representatives of n ≥ 3 independent experiments. C: concentration dependence of the TNF-α effect. LLC-PK1 cells were treated with the indicated concentration of TNF-α for 16 h. The levels of Cldn-2 were detected and quantified as in A. The graphs show means ± SE (n = 3). **P < 0.01 vs. control. D: TNF-α-induced early increase and late decrease in intestinal cells. Confluent HT-29 intestinal cells were treated with 10 ng/ml TNF-α for the indicated times. Cldn-2 was detected and quantified as in A. The graphs show means ± SE (n = 3). **P < 0.01 vs. control.
Fig. 3.
Fig. 3.
TNF-α altered the levels of Cldn-2 at the cell surface. A: LLC-PK1 cells were grown on coverslips to confluence. Where indicated the cells were treated with 10 ng/ml TNF for 1 or 16 h. The cells were fixed with methanol, and endogenous Cldn-2 was visualized using an antibody from Invitrogen and a Cy3-labeled secondary antibody. The nuclei were stained using DAPI. The slides were visualized using a Zeiss LSM confocal microscope. Maximal Intensity Projection images are shown. The bar at right bottom corner = 10 μm for all. Cldn-2 was present both at the cell surface and in vesicular cytosolic structures. The abundance of Cldn-2 in vesicles is increased after TNF-α treatment. The images shown are representatives of n = 3 independent experiments. B: confluent LLC-PK1 cells were treated with 10 ng/ml TNF-α for the indicated times. The cells were placed on ice and surface proteins were biotinylated as described under materials and methods. Cells were lysed and biotinylated proteins precipitated using streptavidine-agarose beads. Cldn-2 in the precipitates (surface) and the cell lysates (total) was detected by Western blotting. The signal was quantified using densitometry. Levels of Cldn-2 in treated samples were expressed as fold change from control. The graph shows means ± SE from n = 4 experiments. *P < 0.05 vs. control.
Fig. 4.
Fig. 4.
Differential role of altered Cldn-2 transcription in the early and late TNF-α effects. A: LLC-PK1 cells were treated for the indicated times with 10 ng/ml TNF-α. RNA extraction, cDNA synthesis, and SYBR green based real-time PCR to determine Cldn-2 and GAPDH levels were performed as described under materials and methods. Data are means ± SE (n = 4). *P < 0.05 vs. control. B: LLC-PK1 cells were transfected with a firefly luciferase-coupled Cldn-2 promoter along with pRL-TK (Renilla luciferase, internal control). Twenty-four hours posttransfection cells were treated with 10 ng/ml TNF-α for 6 or 16 h. Luciferase activities were determined using the Dual Luciferase assay kit and normalized by dividing the Firefly luciferase activity with the Renilla luciferase activity. In each experiment mean from the three parallel measurements was calculated and values of treated samples were expressed as fold change from control taken as 1. The graph shows means ± SE (n = 4). *P < 0.05 vs. control. C: LLC-PK1 cells were treated with 100 μM cycloheximide (CHX) with or without 20 ng/ml TNF-α and 20 μM PD98059, as indicated, for 1 h. Cldn-2 levels were detected and quantified as in Fig 1. The graph shows means ± SE (n = 3). *P < 0.01 vs. control; #P < 0.01 vs. CHX treatment; &P < 0.01 vs. CHX + TNF treatment group.
Fig. 5.
Fig. 5.
TNF-α-induced early rise in Cldn-2 required ERK, EGF receptor, and RhoA, while the late decrease was independent of these. A and B: confluent LLC-PK1 cells were treated with 20 μM PD98059 or 10 μM AG1478 for 15 min, followed by addition of 10 ng/ml TNF-α for 3 h (A) or 16 h (B) in the presence of the inhibitor. At the end of the treatment cells were lysed and Cldn-2 levels detected and quantified as in Fig 1. The graphs show means ± SE (n = 3) **P < 0.05 vs. control; #P < 0.01 vs. TNF treatment alone. C and D: LLC-PK1 cells were transfected with nonrelated (NR) siRNA or an siRNA against porcine RhoA. Forty-eight h later the cells were treated with 10 ng/ml TNF-α for 3 h (C) or 16 h (D) and Cldn-2 levels were detected and quantified as in Fig 1. Graphs show means ± SE (n = 3). **P < 0.01 vs. control, ##P < 0.01 vs. Rho siRNA control. E and F: cells were treated with 20 μM Y27632 for 30 min, followed by 20 ng/ml TNF-α for 3 h (E) or 16 h (F), and Cldn-2 levels were detected as above. The graphs show means ± SE from n = 3 (E) and 6 (F) independent experiments. **P < 0.01 vs. control; #P < 0.05 vs. TNF treatment alone; ##P < 0.01 vs. Y27632 alone.
Fig. 6.
Fig. 6.
A: transepithelial resistance (TER) measurements in LLC-PK1 cells during the development of a confluent layer. TER of LLC-PK1 cells grown on filters was followed using electric cell-substrate impedance sensing (ECIS). At the beginning of each measurement filters with medium alone were placed in the ECIS filter holder. Capicitance (C) and resistance (R) were monitored for 15 min using the frequency scan mode to establish the R values of the empty filters. Next, the measurement was paused, and LLC-PK1 cells (1.5 × 10⁵ cells/filter) were plated on the filter (1st black arrow), and then the measurement was restarted. A shows C measured at 32 kHz, and B shows the corresponding R at 500 Hz. Note that at 24 h C reached a minimum, indicating confluence. At 48 h, the medium was changed (2nd black arrow). After 72 h, 20 μl medium alone (control, blue curve) or medium containing TNF-α (20 ng/ml final concentration, red curve) was added (second arrow). The curves are the average of 2 parallel measurements and are representatives of n = 6 independent experiments. C and D: biphasic effect of TNF-a on TER. The part of the curves in B following TNF-α addition is shown (the artifact caused by the addition was removed from the curve). The data were normalized to the last point before addition of TNF-α taken as 1. The x-axis shows time after TNF-α addition. The timing of Cldn-2 level changes induced by TNF-α is shown under the graph. D: differences in TER between control and TNF-α-treated cells were calculated using the normalized curves (see materials and methods). Graph shows means ± SE (n = 6 independent measurements performed in duplicates). E: change in TER induced by 24-h TNF-α treatment. The difference between the last point before treatment (taken as 1) and the normalized TER value at 24 h after treatment was determined in n = 6 independent experiments performed in duplicates. The positive value (TNF treatment, red column) indicates an increase in TER, while the negative value (control, blue column) indicates decrease. *P < 0.01 vs. control; #P < 0.05 vs. 0 (one-tailed t-test).
Fig. 7.
Fig. 7.
Effect of Cldn-2 downregulation on TNF-α-induced TER changes. A–D: LLC-PK1 cells were transfected with NR or Cldn-2-specific siRNA. Twenty four hours later the cells were trypsinized, and seeded on Corning permeable filters that were placed in the ECIS filter adapter, as in Fig 6. R was continuously measured at 500 Hz. A: effective and sustained downregulation of Cldn-2. At the end of the ECIS measurement (5 days posttransfection; 2 days after TNF addition), cells were lysed and Cldn-2 and GAPDH were detected by Western blotting. The blot is representative of n = 3 independent experiments. B: Cldn-2 silencing elevated basal TER. The graph shows R values at 48 h. R of the empty filter was subtracted. Graph shows means ± SE (n = 6 obtained in 3 independent measurements) **P < 0.01 vs. control. C and D: effect of TNF-α on TER in cells transfected with control and Cldn-2 siRNA. Cells were transfected with control (black curve) or Cldn-2 specific siRNA (grey). ECIS was performed as in Fig 6. C: at 48 h after seeding the cells 20 ng/ml TNF-α was added (taken as time 0). The curves are averages of 2 parallel measurements in a typical experiment and are representatives of n = 6 independent experiments. The values were normalized as in Fig 6. The left shows the full measurement. For easier comparison the 2 curves with TNF addition are also shown separately at right. D: differences in TER between cells transfected with NR siRNA and control siRNA were calculated as in Fig 6. The times indicate the time after TNF-α treatment. The graph shows means ± SE (n = 6 from 3 independent experiments). *P < 0.05; **P < 0.01 vs. control. E and F: Cldn-2 downregulation does not affect expression of other claudins or cell polarization. LLC-PK1 cells were transfected with NR or Cldn-2 specific siRNA. In E, expression of Cldn-1, -2, -4, and -7 was detected by Western blotting as in Fig 1. In F, Cldn-1 was stained with an antibody from Invitrogen and visualized with a Cy3-labeled anti-rabbit secondary antibody. This claudin was selected, since it is a “housekeeping claudin” the presence of which indicates polarization and intact TJs. The nuclei were stained using DAPI. Images were captured as in Fig 3. Maximum Intensity Projections are shown. The size bar in the right bottom corner = 10 μm. The images are representatives of n = 3 independent experiments.

References

    1. Amasheh M, Fromm A, Krug SM, Amasheh S, Andres S, Zeitz M, Fromm M, Schulzke JD. TNFalpha-induced and berberine-antagonized tight junction barrier impairment via tyrosine kinase, Akt and NFkappaB signaling. J Cell Sci 123: 4145–4155, 2010. - PubMed
    1. Amasheh S, Meiri N, Gitter AH, Schoneberg T, Mankertz J, Schulzke JD, Fromm M. Claudin-2 expression induces cation-selective channels in tight junctions of epithelial cells. J Cell Sci 115: 4969–4976, 2002. - PubMed
    1. Angelow S, Ahlstrom R, Yu AS. Biology of claudins. Am J Physiol Renal Physiol 295: F867–F876, 2008. - PMC - PubMed
    1. Angelow S, Schneeberger EE, Yu AS. Claudin-8 expression in renal epithelial cells augments the paracellular barrier by replacing endogenous claudin-2. J Membr Biol 215: 147–159, 2007. - PubMed
    1. Balkovetz DF, Chumley P, Amlal H. Downregulation of claudin-2 expression in renal epithelial cells by metabolic acidosis. Am J Physiol Renal Physiol 297: F604–F611, 2009. - PubMed

Publication types

MeSH terms

LinkOut - more resources