. 2015 Jul;114(1):80-98.
doi: 10.1152/jn.00058.2015. Epub 2015 May 6.

Dynamics of the functional link between area MT LFPs and motion detection

Affiliations

Dynamics of the functional link between area MT LFPs and motion detection

Jackson E T Smith et al. J Neurophysiol. 2015 Jul.

Abstract

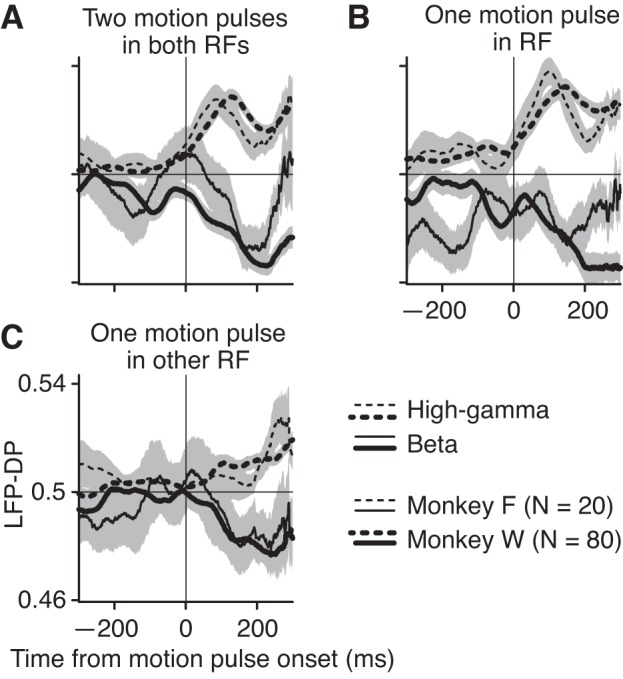
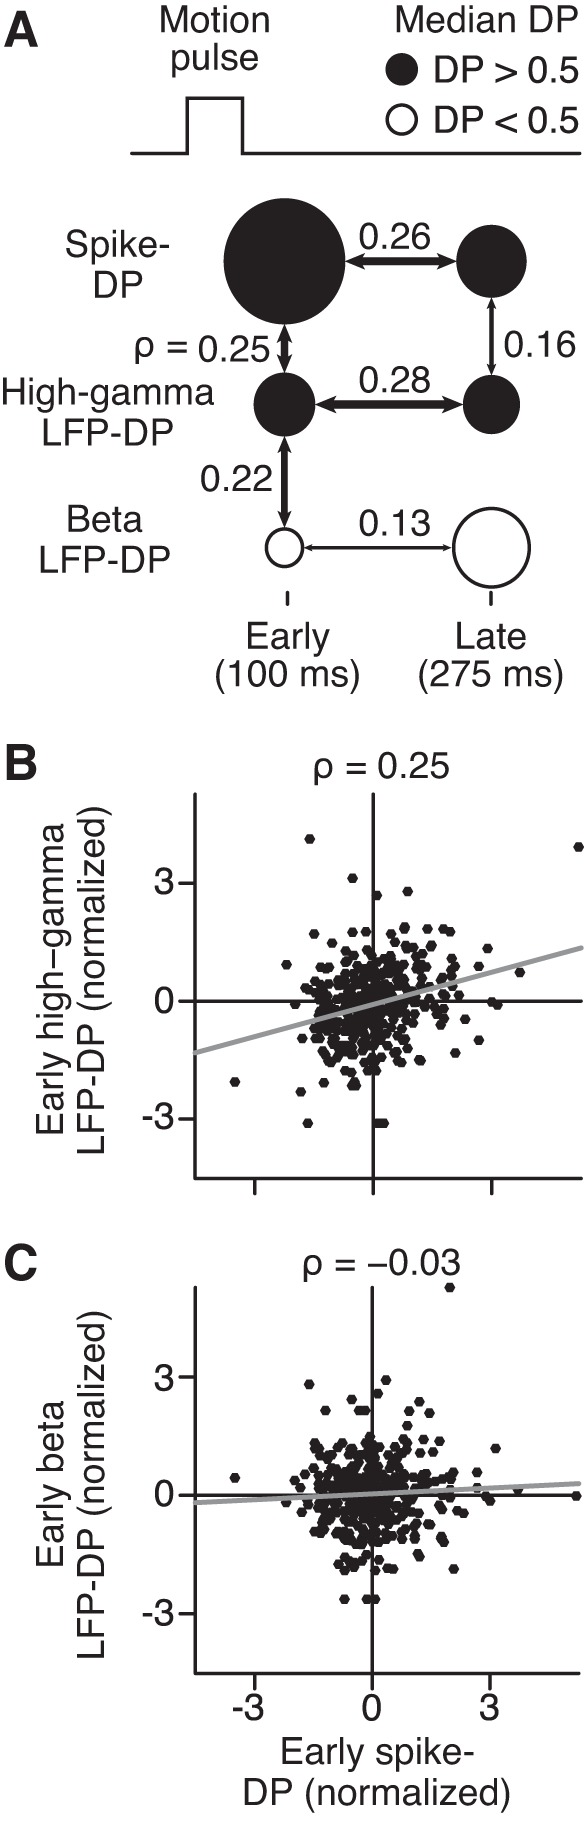
The evolution of a visually guided perceptual decision results from multiple neural processes, and recent work suggests that signals with different neural origins are reflected in separate frequency bands of the cortical local field potential (LFP). Spike activity and LFPs in the middle temporal area (MT) have a functional link with the perception of motion stimuli (referred to as neural-behavioral correlation). To cast light on the different neural origins that underlie this functional link, we compared the temporal dynamics of the neural-behavioral correlations of MT spikes and LFPs. Wide-band activity was simultaneously recorded from two locations of MT from monkeys performing a threshold, two-stimuli, motion pulse detection task. Shortly after the motion pulse occurred, we found that high-gamma (100-200 Hz) LFPs had a fast, positive correlation with detection performance that was similar to that of the spike response. Beta (10-30 Hz) LFPs were negatively correlated with detection performance, but their dynamics were much slower, peaked late, and did not depend on stimulus configuration or reaction time. A late change in the correlation of all LFPs across the two recording electrodes suggests that a common input arrived at both MT locations prior to the behavioral response. Our results support a framework in which early high-gamma LFPs likely reflected fast, bottom-up, sensory processing that was causally linked to perception of the motion pulse. In comparison, late-arriving beta and high-gamma LFPs likely reflected slower, top-down, sources of neural-behavioral correlation that originated after the perception of the motion pulse.

Keywords: MT; behavior; cortex; local field potential; vision.


Figures

Fig. 1.
Fig. 1.
Hypothesis and behavioral task. A: we investigated the dynamics of the neural-behavioral correlations in middle temporal area (MT) local field potential (LFP) frequency bands while monkeys reported the occurrence of a 50-ms pulse of coherent motion. We previously reported that the neural-behavioral correlations between MT spike activity and motion perception peaked soon after the motion stimulus (heavy solid line) and were accounted for by a bottom-up, causal, model that linked fluctuations in MT spike activity to fluctuations in perception of the motion pulse. In this study we hypothesized that the dynamics of the different LFP bands would reveal neural-behavioral correlations that were different from those reflected in the spike response. B: 2 monkey subjects performed a motion pulse detection, reaction time (RT) task. Two electrodes were advanced through separate guide tubes into area MT in the same hemisphere, and wide-band recorded voltage signals were used to derive LFPs. The location of the receptive field (RF 1 and RF 2, white dashed circles) for each recording location in MT was found, and the preferred direction and speed of motion were mapped. A random dot patch stimulus (white dots) was placed over each RF, while dot motion was set to match the RF's preferences. A trial began when the monkey held down a lever and centered its gaze at a fixation point (white cross). The monkeys were required to detect and report a 50-ms pulse of coherent dot motion (black arrows in RFs) that could occur in either RF or simultaneously in both RFs. C: each trial began with 0% coherent dot motion for a random duration (flat hazard function) before presentation of a 50-ms pulse of coherent motion in the preferred direction of the RF. The motion pulse occurred with 1 of 3 different configurations that was randomly chosen for each trial: 1) a simultaneous pulse occurred in both RF 1 and RF 2; 2) 1 pulse occurred in RF 1 but not RF 2; 3) 1 pulse occurred in RF 2 but not RF 1. The motion pulse was followed by 0% motion until the monkey released the lever or the trial timed out. A RT window from 200 to 800 ms (or 100 to 700 ms in a few early experiments) after the motion pulse was used to score lever releases as correct.
Fig. 2.
Fig. 2.
Estimating normalized LFP spectrum over time. A short-time Fourier transform (FFT) was used to derive the time course of spectral power for both LFPs and spike trains. Spikes and 60-Hz line noise were first removed from the raw LFP signals. A 200-ms-wide analysis window (black area) aligned at its center was moved from the beginning to end of each trial, over the entire raw LFP trace. At every window position, the overlapping raw LFP was taken (LFP segment) and weighted by multiplication with a 200-ms Hamming window. Spectral power (LFP spectrum) of the windowed LFP segment was derived from its Fourier transform with zero-padding. LFP spectrums were then 1/f normalized (dashed line). See methods for details on the spectral estimation and signal processing. A similar procedure was used to compute LFP coherence.
Fig. 3.
Fig. 3.
Average normalized LFP spectral power responded to changes in the stimulus. The population average time course of the normalized LFP spectral power is shown responding to the 4 different dot motion events (dashed lines): at the start of a trial when static dots first began moving with 0% coherence (A) and when the 50-ms motion pulse occurred with 2 motion pulses simultaneously in both RFs (B), 1 motion pulse in the RF (C), or 1 motion pulse in the other RF (D). Above each panel is a smaller plot showing the population average time course of spike rates responding to the same events; gray shading denotes SE. Each data point is centered on the moving 200-ms Hamming window.
Fig. 4.
Fig. 4.
Average LFP spectral detect probability (DP) responded to the motion pulse in 2 separate ways. Each LFP frequency was correlated with behavior using a trial-by-trial area under the receiver operating characteristic curve (aROC) score referred to as detect probability (DP). The population average of spectral LFP-DP (color) and spike-DP (black line above) is shown responding to the different motion events. The layout is the same as in Fig. 3. After the motion pulse occurred, the LFP-DP indicates a positive neural-behavioral correlation between LFP power above 50 Hz and detection performance (DP > 0.5) that was similar in nature to the neural-behavioral correlation of spike rates and detection performance. However, there was also a negative neural-behavioral correlation between LFP power and detection performance (DP < 0.5) in a bandwidth roughly 10–30 Hz. Note that LFP-DP values in A were derived from all trials and have less variability. Each data point is centered on the moving 200-ms Hamming window.
Fig. 5.
Fig. 5.
Summary of LFP-DP over the frequency domain: detailed view of the early (100 ms after motion pulse onset, solid line) and late (275 ms, dashed line) response of the population average LFP-DP for 2 motion pulses in both RFs (A), 1 motion pulse in the RF (B), and 1 motion pulse in the other RF (C). Data were smoothed with a 15-Hz-wide window. Shaded areas are SE. Heavy bars at top are the frequency ranges used for the beta (10–30 Hz) and high-gamma (100–200 Hz) bands.
Fig. 6.
Fig. 6.
Effect of motion pulse location and RT on the dynamics of spike- and LFP-DP. The population average time course of DP (shading is SE) is shown aligned to the start of the motion pulse. DP was computed from trials grouped either by motion pulse location (left) or by RT (right) for spike (A), high-gamma LFPs (B), and beta LFPs (C). The beta and high-gamma bands were 10–30 Hz and 100–200 Hz, respectively, and correspond to heavy black bars at top of Fig. 5. The DP shown was computed by averaging the individual DPs in each frequency band. Note that data in RT panels on right are from trials with a motion pulse in the RF, with the 2- and 1-pulse conditions combined. Small arrow-letter pairs highlight important trends in the data (see text). Each data point is centered on the moving 200-ms Hamming window.
Fig. 7.
Fig. 7.
Dynamics of spike-DP in the beta and high-gamma bands. The population average time course of spike-DP (shading is SE) computed from the short-time Fourier transform of the spiking responses (0s and 1s). DP was computed from trials grouped by motion pulse location (left) or by RT (right) for the high-gamma (A) and beta (B) bands. Each data point is centered on the moving 200-ms Hamming window.
Fig. 8.
Fig. 8.
Average beta and high-gamma LFP-DP was similar for the 2 animal subjects. LFP-DP is shown grouped by stimulus condition (shaded area is SE): 2 pulses in both RFs (A), 1 pulse in RF (B), 1 pulse in other RF (C). Note that monkey W contributed 80 recordings while monkey F contributed only 20 recordings. Each data point is centered on the moving 200-ms Hamming window.
Fig. 9.
Fig. 9.
Correlations across experimental sessions between spike-DP, high-gamma LFP-DP, and beta LFP-DP reveal distinct neural processes. DP was z-scored and pooled over stimulus conditions and then grouped by neural signal (LFP bandwidth or spiking response) and by time point (100 or 275 ms after the motion pulse), yielding 6 sets of normalized DPs. The Spearman partial-correlation coefficient (ρ) was computed across recording sessions between each pair of DP sets (which controls for correlations among the remaining 4). A: schematic summarizing all significant correlations (P < 0.05; double-headed arrows, with Spearman coefficients shown above). Circles represent different sets of DP, and their diameters are scaled to the median DP, while color shows the polarity (black > 0.5, open < 0.5). DP sets are grouped by whether they were computed from spiking response (top circles), high-gamma LFPs (middle circles), or beta LFPs (bottom circles) and by the early (100 ms) or late (275 ms) timing relative to the start of the coherent motion pulse (top). Two example comparisons are highlighted by scatterplots in B and C. B: z score normalized, early high-gamma LFP-DP vs. early spike-DP. C: z score normalized, early beta LFP-DP vs. early spike-DP. Linear regression lines (gray) are shown in B and C, along with the Spearman partial correlation coefficients (top).
Fig. 10.
Fig. 10.
A global, top-down, signal appeared before the response. A: average magnitude-squared coherence of beta (top) and high-gamma (bottom) frequencies between paired LFP signals recorded simultaneously on the 2 electrodes, aligned to the start of the motion pulse (vertical solid line) and grouped by correct and failed trial outcome. B: average LFP coherence detect probability (LFP-DPcoh) computed from trial-by-trial measures of LFP coherence for the beta and high-gamma bands. All trials with 1 and 2 motion pulses were grouped together for this analysis. Spike-DP is shown for comparison but computed only using trials with a motion pulse in the RF. For all panels, shading is SE and each data point is centered on the moving 200-ms Hamming window.
Fig. 11.
Fig. 11.
Spike response and LFP power aligned to the behavioral response: average normalized spike response (A) and beta and high-gamma (B) power for correct and false-alarm trials. Alignment is to the lever release, and responses were normalized to the mean values −700 to −650 before the lever release. For reference, the vertical dashed line shows the peak of the spike response for correct trials and arrow a highlights the late deflection in the LFP dynamics that is not observed in the spike response. Shading is SE, and each data point is centered on the moving 200-ms Hamming window.
Fig. 12.
Fig. 12.
Spike-DP, LFP-DP, and LFP-DPcoh aligned to the behavioral response: average spike-DP, high-gamma LFP-DP, and beta LFP-DP aligned to the lever release for the 1-pulse (A) and 2-pulse (B) conditions. Colors correspond to the 3 stimulus conditions and are the same as in Fig. 6. C: average high-gamma and beta LFP-DPcoh aligned to the lever release for all conditions with a motion pulse in the RF (colors are the same as in Fig. 10B). Top: distributions of when the 50-ms motion-pulse occurred relative to the lever release. Distributions reflect the entire time the 50-ms pulses were displayed, not just the pulse onset times. For reference, the 2 vertical dashed lines show the peak of the motion pulse distribution and peak of the spike-DP and arrows a highlight the late deflection in the LFP-DPs. Shading is SE, and each data point is centered on the moving 200-ms Hamming window.

Similar articles

Cited by

References

    1. Ahmed B, Cordery PM, McLelland D, Bair W, Krug K. Long-range clustered connections within extrastriate visual area V5/MT of the rhesus macaque. Cereb Cortex 22: 60–73, 2012. - PubMed
    1. Asher I, Stark E, Abeles M, Prut Y. Comparison of direction and object selectivity of local field potentials and single units in macaque posterior parietal cortex during prehension. J Neurophysiol 97: 3684–3695, 2007. - PubMed
    1. Bastos AM, Vezoli J, Bosman CA, Schoffelen JM, Oostenveld R, Dowdall JR, De Weerd P, Kennedy H, Fries P. Visual areas exert feedforward and feedback influences through distinct frequency channels. Neuron 85: 390–401, 2015. - PubMed
    1. Beauchamp MS, Sun P, Baum SH, Tolias AS, Yoshor D. Electrocorticography links human temporoparietal junction to visual perception. Nat Neurosci 15: 957–959, 2012. - PMC - PubMed
    1. Belitski A, Gretton A, Magri C, Murayama Y, Montemurro MA, Logothetis NK, Panzeri S. Low-frequency local field potentials and spikes in primary visual cortex convey independent visual information. J Neurosci 28: 5696–5709, 2008. - PMC - PubMed

Publication types

LinkOut - more resources