. 2015 Jul;114(1):551-9.
doi: 10.1152/jn.00593.2014. Epub 2015 May 6.

Effort, success, and nonuse determine arm choice

Affiliations

Effort, success, and nonuse determine arm choice

Nicolas Schweighofer et al. J Neurophysiol. 2015 Jul.

Abstract

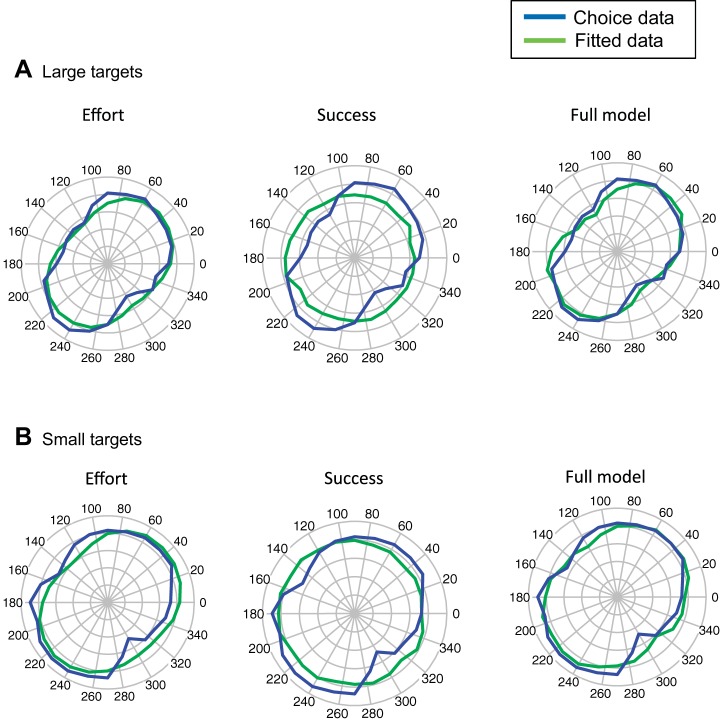
How do humans choose one arm or the other to reach single targets in front of the body? Current theories of reward-driven decisionmaking predict that choice results from a comparison of "action values," which are the expected rewards for possible actions in a given state. In addition, current theories of motor control predict that in planning arm movements, humans minimize an expected motor cost that balances motor effort and endpoint accuracy. Here, we test the hypotheses that arm choice is determined by comparison of action values comprising expected effort and expected task success for each arm, as well as a handedness bias. Right-handed subjects, in either a large or small target condition, were first instructed to use each hand in turn to shoot through an array of targets and then to choose either hand to shoot through the same targets. Effort was estimated via inverse kinematics and dynamics. A mixed-effects logistic-regression analysis showed that, as predicted, both expected effort and expected success predicted choice, as did arm use in the preceding trial. Finally, individual parameter estimation showed that the handedness bias correlated with mean difference between right- and left-arm success, leading to overall lower use of the left arm. We discuss our results in light of arm nonuse in individuals' poststroke.

Keywords: decisionmaking; motor control; motor cost; motor effort; reaching.


Figures

Fig. 1.
Fig. 1.
Experimental setup. The visual targets are shown in red. The actual movements of each arm are, however, to the targets shown in light blue. The hand positions are thus translated visually, such that the cursors indicating hand positions are seen by the subject in the center of the filled, red target (home target) when the hands are at their resting positions.
Fig. 2.
Fig. 2.
Right-arm choice, as well as success rates and estimated effort for both hands for large (A) and small (B) target conditions. Left: right-arm choice in the free condition. Dark-blue line, mean choice probability over all subjects; light-blue shading, SE of choice probability; thin, black line, ellipse fitted to mean choice data. + or − signs indicate that choice for this target is greater or lower than mean choice over all targets (in each condition), respectively. Middle: left and right success rates (solid line, mean success rate over all subjects; shading, SE of success rate for right (red) and left (blue) hand). Blue stars indicate that the right-arm success rate is higher than the left-arm success rate; red stars, the opposite. Right: left and right estimated effort (solid line, mean effort; shading, SE of effort for right (red) and left (blue) hand). Choice is computed from the 8 movements to each target within free movements. Success rate and effort are computed from the 8 movements to each target with each arm in the left- and right-forced movements.
Fig. 3.
Fig. 3.
Predicted mean probability of arm choice (green line) vs. actual mean-probability arm choice (blue line) in large (A) and small (B) target conditions for 3 models (from left to right). Left: model with difference in expected effort and condition [model (2) in Table 1]. Middle: model with difference in expected success and condition [model (3) in Table 1]. Right: model with difference in expected effort, difference in expected success, condition, and history of previous movement [model (10) in Table 1].
Fig. 4.
Fig. 4.
Relationships between logits and difference in effort (top) and difference in success (bottom) for the small target condition for the full model [model (10) in Table 1]. The model predicted, for each target, both a linear relationship between logits and difference in expected effort and difference in expected success.
Fig. 5.
Fig. 5.
Random intercept (handedness bias) of the mixed-effects logistic-regression model [model (10) in Table 1] as a function of the average difference in success rates between right and left arm over all targets for all subjects. The average success rates were computed in the forced trials for both left-arm and right-arm movements.

Similar articles

Cited by

References

    1. Andrews K, Stewart J. Stroke recovery: he can but does he? Rheumatol Rehabil 18: 43–48, 1979. - PubMed
    1. Behrens TE, Woolrich MW, Walton ME, Rushworth MF. Learning the value of information in an uncertain world. Nat Neurosci 10: 1214–1221, 2007. - PubMed
    1. Bishop DV, Ross VA, Daniels MS, Bright P. The measurement of hand preference: a validation study comparing three groups of right-handers. Br J Psychol 87: 269–285, 1996. - PubMed
    1. Bryden PJ, Pryde KM, Roy EA. A performance measure of the degree of hand preference. Brain Cogn 44: 402–414, 2000. - PubMed
    1. Burk D, Ingram JN, Franklin DW, Shadlen MN, Wolpert DM. Motor effort alters changes of mind in sensorimotor decision making. PloS One 9: e92681, 2014. - PMC - PubMed

Publication types

LinkOut - more resources