

Urinary C-X-C Motif Chemokine 10 Independently Improves the Noninvasive Diagnosis of Antibody-Mediated Kidney Allograft Rejection
- PMID: 25948873
- PMCID: PMC4625672
- DOI: 10.1681/ASN.2014080797
Urinary C-X-C Motif Chemokine 10 Independently Improves the Noninvasive Diagnosis of Antibody-Mediated Kidney Allograft Rejection
Abstract
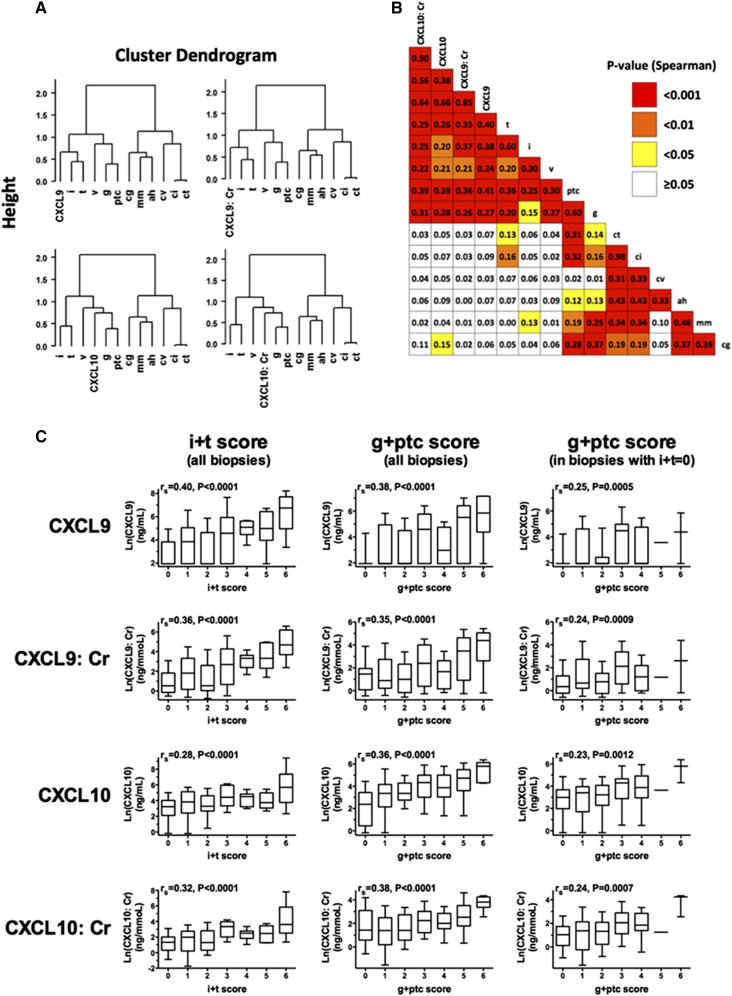
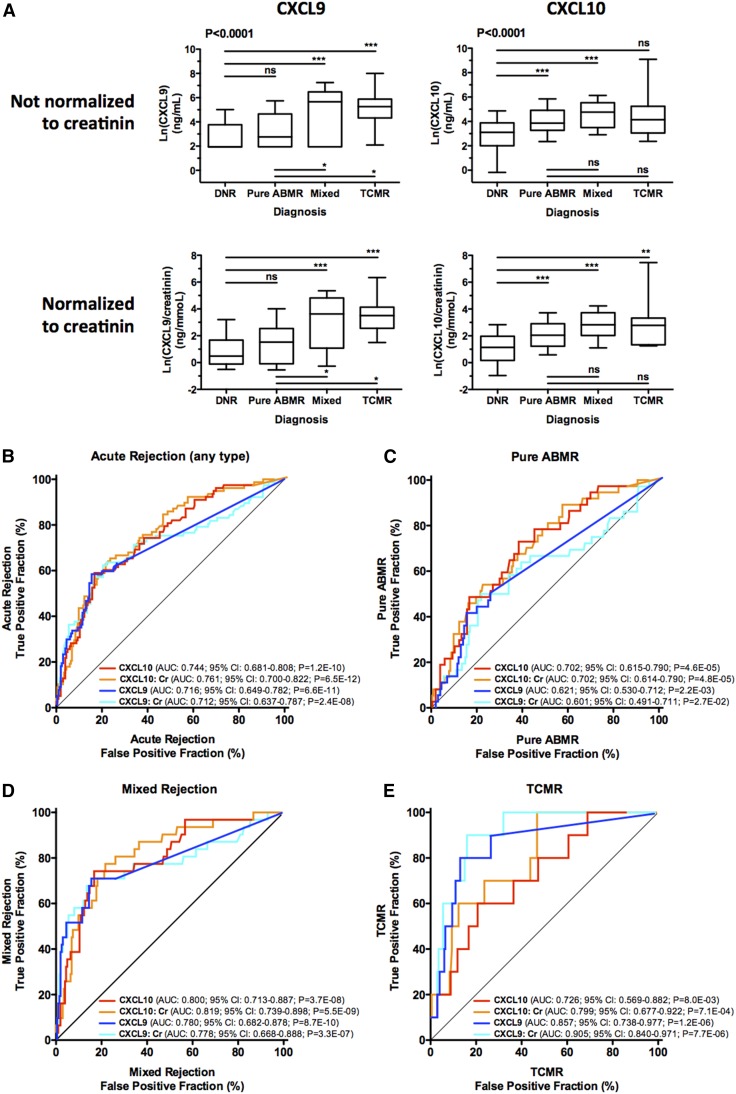
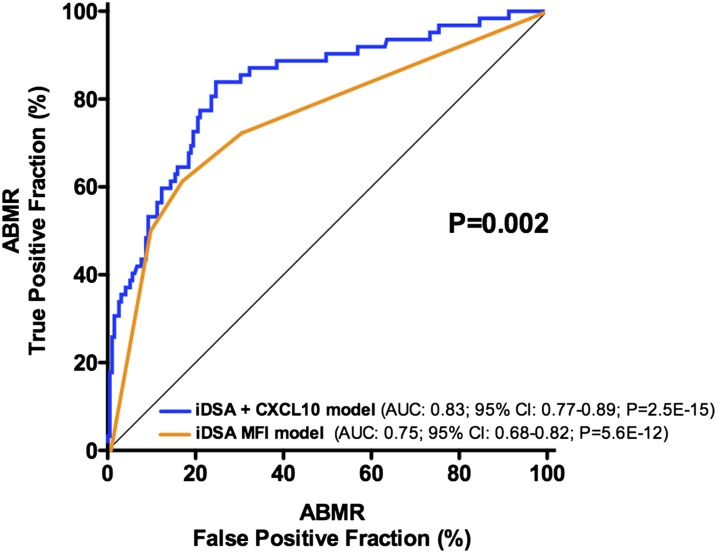
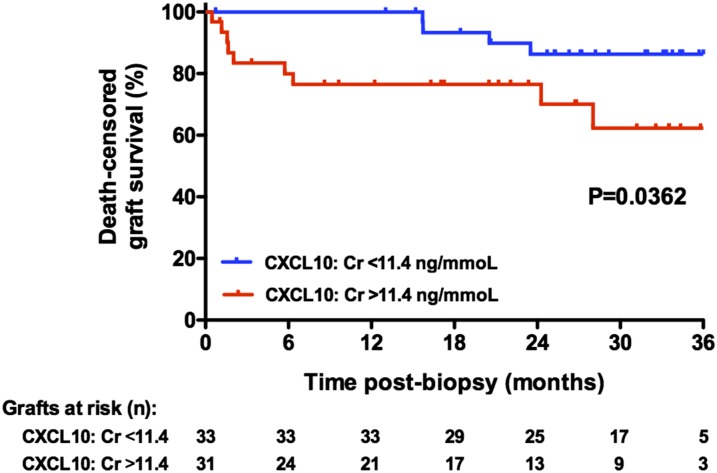
Urinary levels of C-X-C motif chemokine 9 (CXCL9) and CXCL10 can noninvasively diagnose T cell-mediated rejection (TCMR) of renal allografts. However, performance of these molecules as diagnostic/prognostic markers of antibody-mediated rejection (ABMR) is unknown. We investigated urinary CXCL9 and CXCL10 levels in a highly sensitized cohort of 244 renal allograft recipients (67 with preformed donor-specific antibodies [DSAs]) with 281 indication biopsy samples. We assessed the benefit of adding these biomarkers to conventional models for diagnosing/prognosing ABMR. Urinary CXCL9 and CXCL10 levels, normalized to urine creatinine (Cr) levels (CXCL9:Cr and CXCL10:Cr) or not, correlated with the extent of tubulointerstitial (i+t score; all P<0.001) and microvascular (g+ptc score; all P<0.001) inflammation. CXCL10:Cr diagnosed TCMR (area under the curve [AUC]=0.80; 95% confidence interval [95% CI], 0.68 to 0.92; P<0.001) and ABMR (AUC=0.76; 95% CI, 0.69 to 0.82; P<0.001) with high accuracy, even in the absence of tubulointerstitial inflammation (AUC=0.70; 95% CI, 0.61 to 0.79; P<0.001). Although mean fluorescence intensity of the immunodominant DSA diagnosed ABMR (AUC=0.75; 95% CI, 0.68 to 0.82; P<0.001), combining urinary CXCL10:Cr with immunodominant DSA levels improved the diagnosis of ABMR (AUC=0.83; 95% CI, 0.77 to 0.89; P<0.001). At the time of ABMR, urinary CXCL10:Cr ratio was independently associated with an increased risk of graft loss. In conclusion, urinary CXCL10:Cr ratio associates with tubulointerstitial and microvascular inflammation of the renal allograft. Combining the urinary CXCL10:Cr ratio with DSA monitoring significantly improves the noninvasive diagnosis of ABMR and the stratification of patients at high risk for graft loss.
Keywords: antibody-mediated rejection; biomarker; kidney transplantation; noninvasive diagnosis.
Copyright © 2015 by the American Society of Nephrology.
Figures
Comment in
-
Urine CXCL10/IP-10 Fingers Ongoing Antibody-Mediated Kidney Graft Rejection.J Am Soc Nephrol. 2015 Nov;26(11):2607-9. doi: 10.1681/ASN.2015040353. Epub 2015 May 6. J Am Soc Nephrol. 2015. PMID: 25948874 Free PMC article. No abstract available.
References
-
- Suthanthiran M, Schwartz JE, Ding R, Abecassis M, Dadhania D, Samstein B, Knechtle SJ, Friedewald J, Becker YT, Sharma VK, Williams NM, Chang CS, Hoang C, Muthukumar T, August P, Keslar KS, Fairchild RL, Hricik DE, Heeger PS, Han L, Liu J, Riggs M, Ikle DN, Bridges ND, Shaked A, Clinical Trials in Organ Transplantation 04 (CTOT-04) Study Investigators : Urinary-cell mRNA profile and acute cellular rejection in kidney allografts. N Engl J Med 369: 20–31, 2013 - PMC - PubMed
-
- Hauser IA, Spiegler S, Kiss E, Gauer S, Sichler O, Scheuermann EH, Ackermann H, Pfeilschifter JM, Geiger H, Gröne HJ, Radeke HH: Prediction of acute renal allograft rejection by urinary monokine induced by IFN-gamma (MIG). J Am Soc Nephrol 16: 1849–1858, 2005 - PubMed
-
- Ho J, Rush DN, Karpinski M, Storsley L, Gibson IW, Bestland J, Gao A, Stefura W, HayGlass KT, Nickerson PW: Validation of urinary CXCL10 as a marker of borderline, subclinical, and clinical tubulitis. Transplantation 92: 878–882, 2011 - PubMed
-
- Hricik DE, Nickerson P, Formica RN, Poggio ED, Rush D, Newell KA, Goebel J, Gibson IW, Fairchild RL, Riggs M, Spain K, Ikle D, Bridges ND, Heeger PS, CTOT-01 consortium : Multicenter validation of urinary CXCL9 as a risk-stratifying biomarker for kidney transplant injury. Am J Transplant 13: 2634–2644, 2013 - PMC - PubMed
Publication types
MeSH terms
Substances
LinkOut - more resources
Full Text Sources
Other Literature Sources
Medical
Research Materials
