Review
. 2015 Apr-Jun;22(2):145-50.
doi: 10.4103/0974-9233.151887.

Imaging in diabetic retinopathy

Affiliations
Review

Imaging in diabetic retinopathy

David A Salz et al. Middle East Afr J Ophthalmol. 2015 Apr-Jun.

Abstract

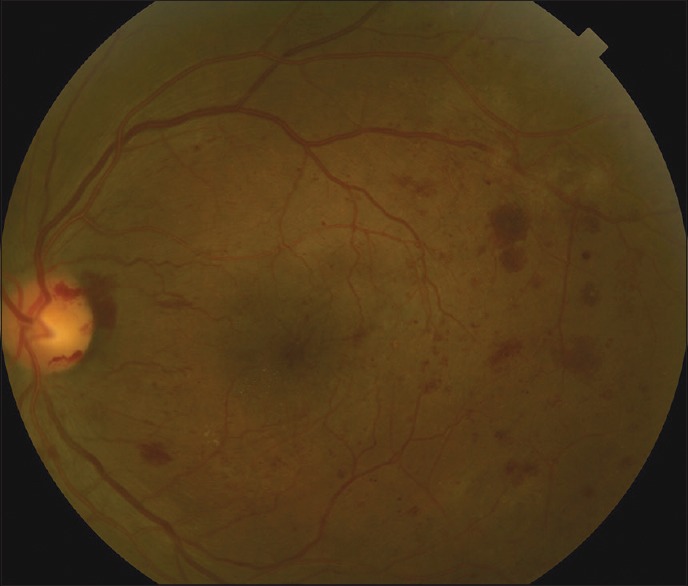
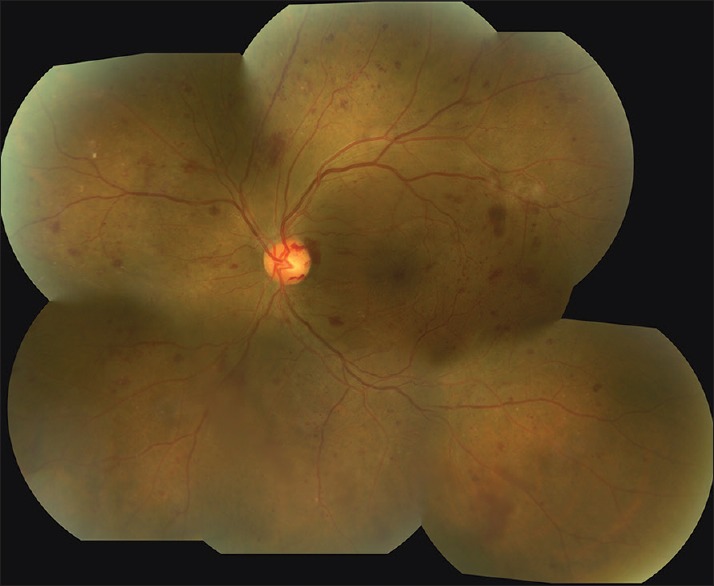
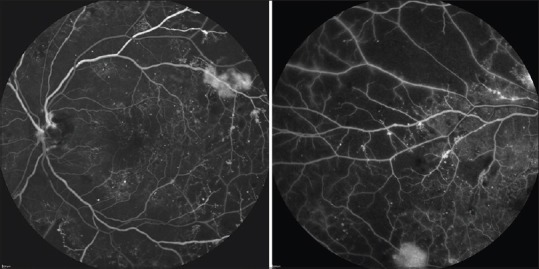
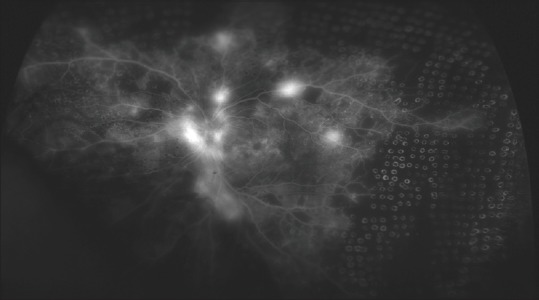
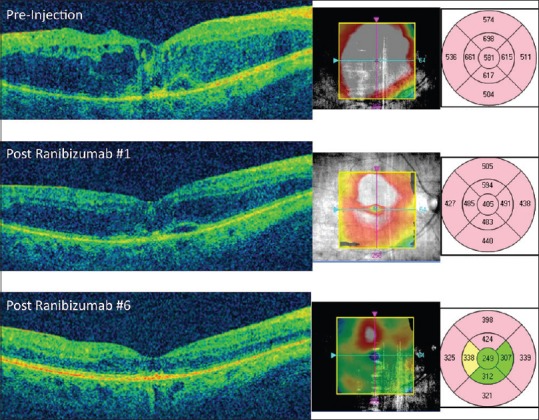
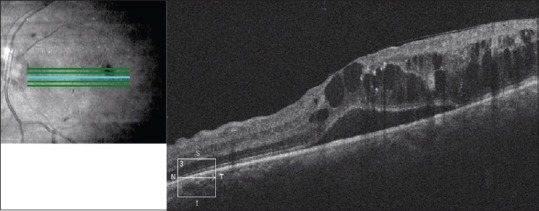
While the primary method for evaluating diabetic retinopathy involves direct and indirect ophthalmoscopy, various imaging modalities are of significant utility in the screening, evaluation, diagnosis, and treatment of different presentations and manifestations of this disease. This manuscript is a review of the important imaging modalities that are used in diabetic retinopathy, including color fundus photography, fluorescein angiography, B-scan ultrasonography, and optical coherence tomography. The article will provide an overview of these different imaging techniques and how they can be most effectively used in current practice.

Keywords: B-scan Ultrasonography; Color Fundus Photography; Diabetic Retinopathy; Fluorescein Angiography; Optical Coherence Tomography; Retinal Imaging.


Conflict of interest statement

Conflict of Interest: None declared.

Figures

Figure 1
Figure 1
Standard color fundus photo, showing 30° of the posterior pole including the optic nerve and the macula of the left eye of a patient with proliferative diabetic retinopathy. There are diffuse areas of retinal hemorrhages as well as neovascularization along the temporal superior arcade and a small amount of vitreous hemorrhage over the nerve corresponding with neovascularization of the disc
Figure 2
Figure 2
Montage image of the left eye of the same patient seen in Figure 1 using 7-field fundus photography. There is more visualization of the periphery as well as a better appreciation for the extent of the diabetic retinopathy
Figure 3
Figure 3
Fluorescein angiography of the same eye seen in Figures 1 and 2. The standard 30° photo on the left shows scattered microaneurysms throughout the macula. There is IRMA present along the superior arcade as well as leakage from an area of neovascularization. A peripheral sweep of the fluorescein angiography in the same patient shows patchy areas of hypofluorscence corresponding with extensive areas of peripheral retinal nonperfusion
Figure 4
Figure 4
Widefield fluorescein angiography in a patient with proliferative diabetic retinopathy. Note the numerous areas of leakage by the disc and along the arcades corresponding to neovascularization of the disc and elsewhere, respectively. There are extensive areas of nonperfusion in the periphery, and multiple laser scars from panretinal photocoagulation have been targeted to these nonperfused areas
Figure 5
Figure 5
Optical coherence tomography (OCT) of the macula in a patient with diabetic macular edema. On the presentation (top), the patient has severe macular edema with retinal thickening and intraretinal fluid, shown in red on the OCT map to the right. Exact thickness measurements are also shown using a 9-field Early Treatment of Diabetic Retinopathy Study (ETDRS) map. After the first injection of ranibizumab (middle), the retinal edema improves on OCT and the change is quantified by looking at the OCT macular thickness maps, with the central field thickness decreasing from 581 μ to 405 μ on the ETDRS map. After 6 injections, the OCT shows resolution of fovea macular edema with the central field thickness returning to a normal level compared to age-matched controls (turning from red to green on the ETDRS map), showing an excellent overall response to treatment
Figure 6
Figure 6
Optical coherence tomography of the macula of the left eye of a patient with diabetic macular edema. There is subretinal fluid as well as cystoid intraretinal fluid present, causing loss of the normal foveal contour. There are areas of increased hyperreflectivity in the outer plexiform layer corresponding to hard exudates

Comment in

  • Imaging in Diabetic Retinopathy.
    Zvorničanin J, Zvorničanin E. Zvorničanin J, et al. Middle East Afr J Ophthalmol. 2015 Oct-Dec;22(4):531. doi: 10.4103/0974-9233.167809. Middle East Afr J Ophthalmol. 2015. PMID: 26692733 Free PMC article. No abstract available.
  • Author's Reply.
    Salz DA, Witkin AJ. Salz DA, et al. Middle East Afr J Ophthalmol. 2015 Oct-Dec;22(4):532. Middle East Afr J Ophthalmol. 2015. PMID: 26692734 Free PMC article. No abstract available.

References

    1. Patrick JS, Tyler ME. 2nd ed. New York: Butterworth-Heinemann Medical; 2001. Fundus photography overview. Ophthalmic Photography: Retinal Photography, Angiography, and Electronic Imaging.
    1. Treatment techniques and clinical guidelines for photocoagulation of diabetic macular edema. Early Treatment Diabetic Retinopathy Study Report Number 2. Early Treatment Diabetic Retinopathy Study Research Group. Ophthalmology. 1987;94:761–74. - PubMed
    1. Witmer MT, Kiss S. The clinical utility of ultra-wide-field imaging. Rev Ophthalmol. 2012. [Last accessed on 2015 Jan 29]. Available from: http://www.reviewofophthalmology.com/content/d/retinal_insider/c/32799 .
    1. Tyler ME. Stereo fundus photography: Principles and technique. J Ophthalmic Photogr. 1996;18:68–89.
    1. Li HK, Hubbard LD, Danis RP, Esquivel A, Florez-Arango JF, Krupinski EA. Monoscopic versus stereoscopic retinal photography for grading diabetic retinopathy severity. Invest Ophthalmol Vis Sci. 2010;51:3184–92. - PubMed

MeSH terms