. 2015 Jan 30;4(1):e968480.
doi: 10.4161/21624011.2014.968480. eCollection 2015 Jan.

Tryptophan 2,3-dioxygenase (TDO)-reactive T cells differ in their functional characteristics in health and cancer

Affiliations

Tryptophan 2,3-dioxygenase (TDO)-reactive T cells differ in their functional characteristics in health and cancer

Mads Duus Hjortsø et al. Oncoimmunology. .

Abstract

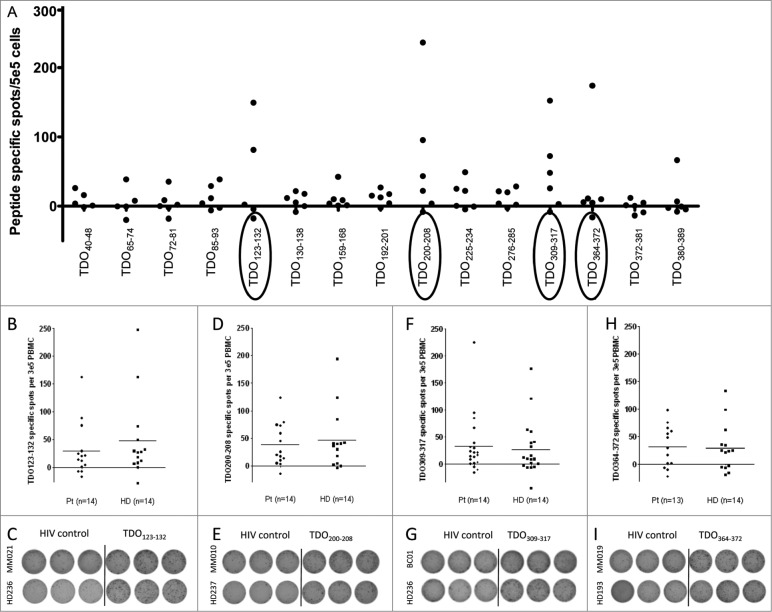
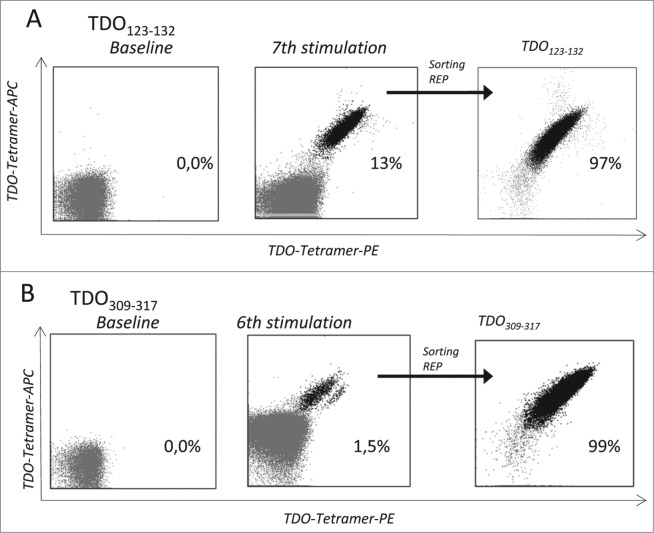
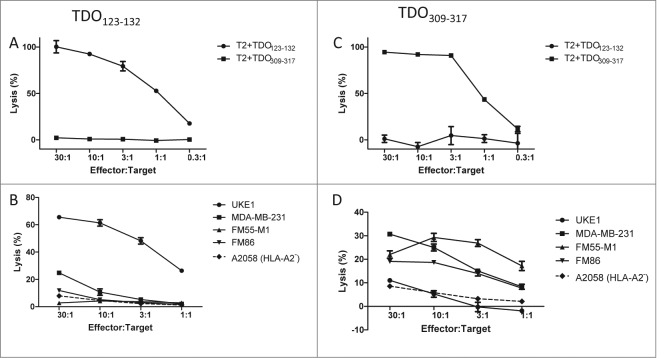
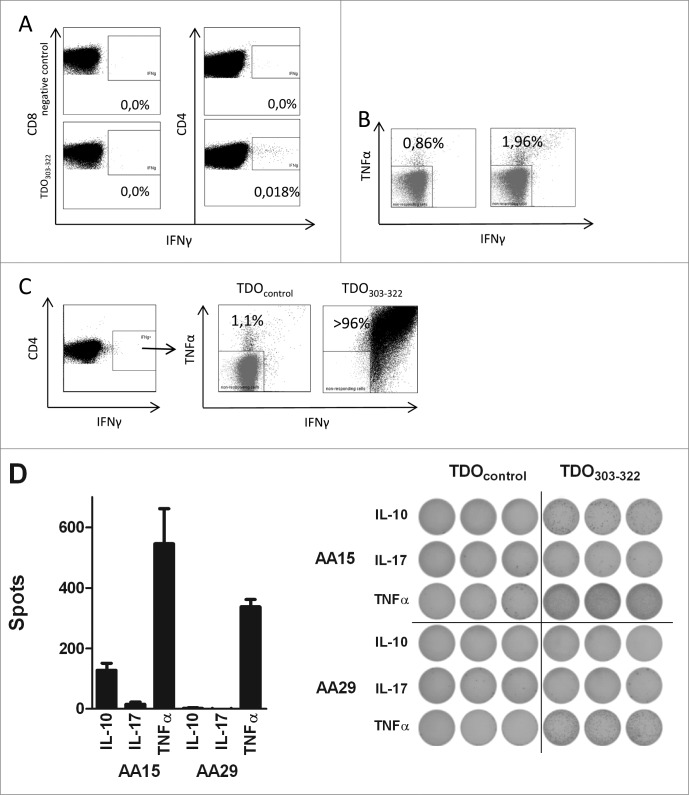
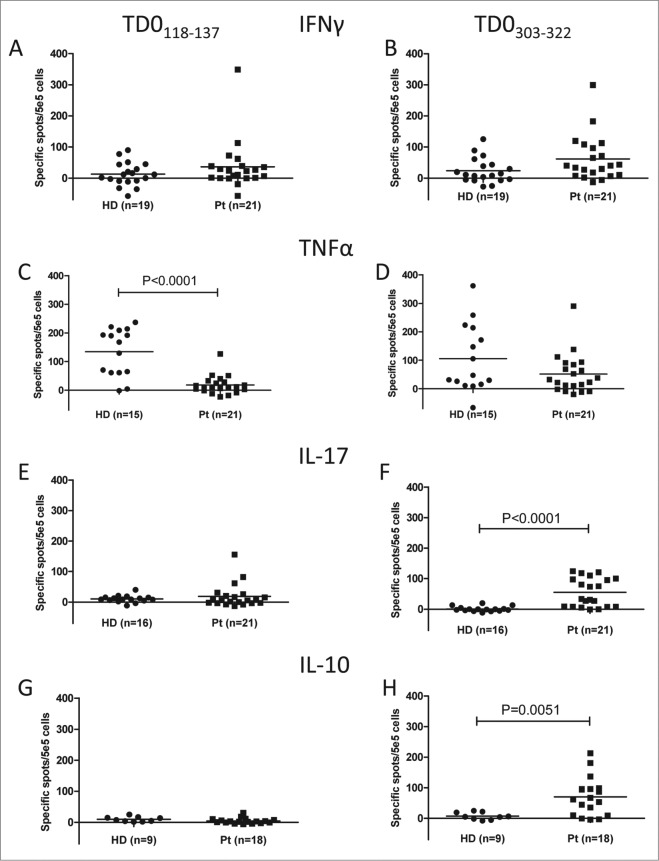
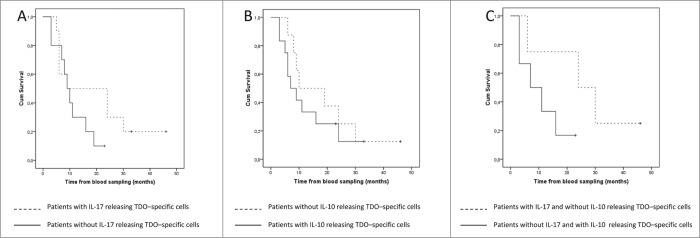
Tryptophan-2,3-dioxygenase (TDO) physiologically regulates systemic tryptophan levels in the liver. However, numerous studies have linked cancer with activation of local and systemic tryptophan metabolism. Indeed, similar to other heme dioxygenases TDO is constitutively expressed in many cancers. In the present study, we detected the presence of both CD8+ and CD4+ T-cell reactivity toward TDO in peripheral blood of patients with malignant melanoma (MM) or breast cancer (BC) as well as healthy subjects. However, TDO-reactive CD4+ T cells constituted distinct functional phenotypes in health and disease. In healthy subjects these cells predominately comprised interferon (IFN)γ and tumor necrosis factor (TNF)-α producing Th1 cells, while in cancer patients TDO-reactive CD4+ T-cells were more differentiated with release of not only IFNγ and TNFα, but also interleukin (IL)-17 and IL-10 in response to TDO-derived MHC-class II restricted peptides. Hence, in healthy donors (HD) a Th1 helper response was predominant, whereas in cancer patients CD4+ T-cell responses were skewed toward a regulatory T cell (Treg) response. Furthermore, MM patients hosting a TDO-specific IL-17 response showed a trend toward an improved overall survival (OS) compared to MM patients with IL-10 producing, TDO-reactive CD4+ T cells. For further characterization, we isolated and expanded both CD8+ and CD4+ TDO-reactive T cells in vitro. TDO-reactive CD8+ T cells were able to kill HLA-matched tumor cells of different origin. Interestingly, the processed and presented TDO-derived epitopes varied between different cancer cells. With respect to CD4+ TDO-reactive T cells, in vitro expanded T-cell cultures comprised a Th1 and/or a Treg phenotype. In summary, our data demonstrate that the immune modulating enzyme TDO is a target for CD8+ and CD4+ T cell responses both in healthy subjects as well as patients with cancer; notably, however, the functional phenotype of these T-cell responses differ depending on the respective conditions of the host.

Keywords: T cells; TDO; Th17; Tregs; immune regulation.


Figures

Figure 1.
Figure 1.
Natural T-cell responses against TDO. (A) In order to detect TDO-specific CD8+ T-cell responses, 15 predicted HLA-A2 restricted T-cell epitopes were synthesized to examine peripheral blood mononuclear cells (PBMC) from 6 HLA-A2+ MM patients. PBMC samples were stimulated once in vitro with peptide and IL-2 for one week before being plated in an IFNγ ELISPOT assay at 5 × 10⁵ cells per well in triplicates with or without a relevant TDO peptide. The average number of TDO-specific, IFNγ-releasing cells was calculated per 5 × 10⁵ PBMC. IFNγ ELISPOT responses against TDO123-132 (KLLVQQFSIL) in 13 MM patients, 1 BC patient and 14 healthy donors. T cells were stimulated once with peptide before being plated in an IFNγ ELISPOT assay at 3 × 10⁵ cells per well in triplicates with the TDO123-132 (B), TDO200-208 (D), TDO309-317 (F), TDO364-372 (H), or a negative control peptide (HIVpol476-484 (ILKEPVHGV)). The dot plots designate mean spot count of triplicate positive wells with subtraction of background. Examples of ELISPOT experiments against TDO123-132 (C), TDO200-208 (E), TDO309-317 (G), TDO364-372 (I),and HIVpol476-484 in PBMC from different cancer patients or healthy donors.
Figure 2.
Figure 2.
Expansion of TDO-specific CD8+ T cells. Tetramer analysis of TDO-specific T-cells; Examples of TDO123-132 (A) or TDO309-317 (B) -specific CD8+ T-cells among PBMC from a BC patient (BC1) as visualized by flow cytometry staining using the tetramers HLA-A2/ TDO123-132-PE, HLA-A2/ TDO123-132-APC. The stainings were performed directly ex vivo (left), after peptide stimulations in vitro (middle), and after sorting and expansion of tetramer-positive cells by FACS (right).
Figure 3.
Figure 3.
Cytolytic capacity of TDO-specific T cells. (A) The lysis of T2-cells pulsed with either relevant TDO123-132 peptide (black squares) or an irrelevant TDO peptide TDO309-317 (gray squares) by the TDO123-132-specific T-cell culture as examined by 51Cr-release assay. X-axis designate effector:target ratio. (B) Lysis by TDO123-132-specific T cells of the HLA-A2+ melanoma cell lines FM-55M1 and FM-86, the breast cancer cell line MDA-MB 231, and the AML cell line UKE-1 at different effector to target ratios as assayed by 51Cr-release. In addition the melanoma cell line A2058 (HLA-A2 negative) was examined as negative control. (C) The lysis of T2-cells pulsed with either relevant TDO309-317 peptide (black squares) or an irrelevant TDO peptide TDO123-132 (gray squares) by the TDO309-317-specific T-cell culture as examined by 51Cr-release assay. (D) Lysis by TDO309-317 -specific T cells of the HLA-A2+ melanoma cell lines FM-55M1 and FM-86, the breast cancer cell line MDA-MB 231, and the AML cell line UKE-1 at different effector to target ratios as assayed by 51Cr-release. In addition the melanoma cell line A2058 (HLA-A2 negative) was examined as negative control.
Figure 4.
Figure 4.
CD4+ T-cell responses against TDO. (A) PBMC from a MM patient (MM020) were stimulated once with either an irrelevant HIV peptide (top) or the long TDO303-322 peptide (bottom) before being analyzed by intracellular IFNγ staining. FACS plots were gated on living CD8+ T cells (left) or CD4+ T cells (right). (B) PBMC from a MM patient (MM020) peptide were stimulated four times with DC pulsed with TDO303-322. The resulting T-cell culture was stimulated once with either an irrelevant long TDO peptide (TDO118-137 (left) or the long TDO303-322 peptide (right) before being analyzed by intracellular TNFα and IFNγ staining. (C) PBMC from a MM patient (MM020) peptide were stimulated with TDO303-322 (left). The IFNγ+CD4+ T cells were sorted by FACS and expanded by REP. The resulting T-cell culture was stimulated once with either an irrelevant long TDO peptide (TDO118-137 (left) or the long TDO303-322 peptide (right) before being analyzed by intracellular TNFα and IFNγ staining. The T-cell culture was highly TDO303-322 specific. (D) ELISPOT analysis of reactivity toward TDO303-322 in two highly specific T-cell lines from two MM patients (MM014 and MM020). 10,000 T cells were analyzed with or without TDO303-322. The bars in the panel depict mean value of triplicate experiments, background subtracted (left). The well images are depicted for both T-cell cultures (right).
Figure 5.
Figure 5.
Natural CD4+ T-cell responses against TDO in healthy and cancer patients. T-cell responses against TDO118-137 (A, C, E, and G), or TDO303-322 (B, D, F, and H) was measured by IFNγ (A and B), TNFα (C and D), IL-17 (E and F) or IL-10 (G and H) ELISPOT. The average number of TDO-specific cells from triplicate experiments (after subtraction of background) was calculated per 5 × 10⁵ PBMC for each patient. PBMC from 19 healthy individuals (HD), 21 cancer patients (Pt) (20 patients with MM and one BC) were analyzed. Only p-values (P < 0.05) by a Mann–Whitney test are revealed.
Figure 6.
Figure 6.
Clinical course of the examined MM patients. (A) Kaplan Meier estimate of OS defined as date of blood sample to date of death for MM patients with TDO303-322-specific IL-17-releasing T cells (dotted line) and for MM patients without TDO303-322-specific IL-17 T cells (solid line) (P = 0.178, log Rank). (B) Kaplan Meier estimate of OS defined as date of blood sample to date of death for MM patients with TDO303-322-specific IL-10-releasing T cells (solid line) and for MM patients without TDO303-322-specific IL-10 T cells (dotted line) (P = 0.423, log Rank). (C) Kaplan Meier estimate of OS defined as date of blood sample to date of death for MM patients with TDO303-322-specific IL-17-releasing T cells without IL-10 releasing cells (dotted line) and for MM patients with TDO303-322-specific IL-10 T cells without IL-17 releasing cells (solid line) (P = 0.124, log Rank).

Similar articles

Cited by

References

    1. Muller A, Heseler K, Schmidt SK, Spekker K, Mackenzie CR, Daubener W. The missing link between indoleamine 2,3-dioxygenase mediated antibacterial and immunoregulatory effects. J Cell Mol Med 2009; 13:1125-35; PMID:; http://dx.doi.org/10.1111/j.1582-4934.2008.00542.x - DOI - PMC - PubMed
    1. Prendergast GC, Smith C, Thomas S, Mandik-Nayak L, Laury-Kleintop L, Metz R, Muller AJ. Indoleamine 2,3-dioxygenase pathways of pathogenic inflammation and immune escape in cancer. Cancer Immunol Immunother 2014; 63:721-35; PMID:; http://dx.doi.org/10.1007/s00262-014-1549-4 - DOI - PMC - PubMed
    1. Zhang Y, Kang SA, Mukherjee T, Bale S, Crane BR, Begley TP, Ealick SE. Crystal structure and mechanism of tryptophan 2,3-dioxygenase, a heme enzyme involved in tryptophan catabolism and in quinolinate biosynthesis. Biochemistry 2007; 46:145-55; PMID:; http://dx.doi.org/10.1021/bi0620095 - DOI - PubMed
    1. Batabyal D, Yeh SR. Human tryptophan dioxygenase: a comparison to indoleamine 2,3-dioxygenase. J Am Chem Soc 2007; 19:15690-701; PMID:; http://dx.doi.org/10.1021/ja076186k - DOI - PubMed
    1. Munn DH, Mellor AL. Indoleamine 2,3-dioxygenase and tumor-induced tolerance. J Clin Invest 2007; 117:1147-54; PMID:; http://dx.doi.org/10.1172/JCI31178 - DOI - PMC - PubMed

Publication types