. 2015 Feb 3;4(1):e981483.
doi: 10.4161/2162402X.2014.981483. eCollection 2015 Jan.

Identification and characterization of the specific murine NK cell subset supporting graft- versus-leukemia- and reducing graft- versus-host-effects

Affiliations

Identification and characterization of the specific murine NK cell subset supporting graft- versus-leukemia- and reducing graft- versus-host-effects

Kathrin Meinhardt et al. Oncoimmunology. .

Abstract

Clinical studies investigating the impact of natural killer (NK) cells in allogeneic hematopoietic stem cell transplantation settings have yielded promising results. However, NK cells are a functionally and phenotypically heterogeneous population. Therefore, we addressed the functional relevance of specific NK cell subsets distinguished by expression of CD117, CD27 and CD11b surface markers in graft-versus-leukemia (GVL)-reaction and graft-versus-host-disease (GVHD). Our results clearly demonstrate that the subset of c-Kit-CD27-CD11b+ NK cells expressed multiple cytotoxic pathway genes and provided optimal graft-versus-leukemia-effects, while significantly reducing T cell proliferation induced by allogeneic dendritic cells. Furthermore, these NK cells migrated to inflamed intestinal tissues where graft-versus-host-colitis was efficiently mitigated. For the first time, we identified the c-Kit-CD27-CD11b+ NK cell population as the specific effector NK cell subset capable of significantly diminishing GVHD in fully mismatched bone marrow transplantation settings. In conclusion, the subset of c-Kit-CD27-CD11b+ NK cells not only supports GVL, but also plays a unique role in the protection against GVHD by migrating to the peripheral GVHD target organs where they exert efficient immunoregulatory activities. These new insights demonstrate the importance of selecting the optimal NK cell subset for cellular immunotherapy following allogeneic hematopoietic stem cell transplantation.

Keywords: BMT, bone marrow transplantation; CD11b+ NK = c-Kit−CD27−CD11b+ NK cells; CD27+ NK = c-Kit−CD27+CD11b− NK cells; DP = c-Kit−CD27+CD11b+ NK cells; GVHD; GVHD, graft-versus-host disease; GVL; GVL, graft-versus-leukemia; HSCT, hematopoietic stem cell transplantation; KIR, killer cell immunoglobulin-like receptor; MLR, mixed lymphocyte reaction; NK cells; NK, natural killer; TBI, total body irradiation; c-Kit+ NK = c-Kit+CD27+CD11b− NK cells; stem cell transplantation; tumor immunology.


Figures
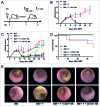
Figure 1.
Figure 1.
CD11b+ NK cells as main effectors reducing GVHD symptoms. (A) Murine allogeneic BMT model. One day after lethal total body irradiation (TBI), Balb/c mice were co-transplanted with 5×10⁶ freshly isolated T-cell depleted bone marrow (BM) cells plus 1×10⁶ MoFlo-sorted NK subsets from C57Bl/6 donors. Two days after TBI, 7×10⁵ T cells from C57Bl/6 origin were injected i.v. to induce acute graft-versus host disease (GVHD). The control bone marrow transplant (BMT) group did not receive any additional T cells. (B) Course of GVHD score is depicted that has been assessed by clinical monitoring every 2-3 days following transfer of BM (black, n = 4) with additional transfer of allogeneic T cells to induce GVHD (red, n = 4) plus IL-18-induced Kit+CD27+CD11b natural killer (NK) cells (Kit+, violet curve, n = 4). (C) Course of GVHD-score comparing a BMT control group (BM, black, n = 6) with mice developing GVHD induced by allogeneic T cells (BM+T, red, n = 5) and mice that additionally received either KitCD27+CD11b (CD27+, blue, n = 4) or KitCD27CD11b+ NK cells (CD11b+, green curve, n = 5). All NK cell subsets were expanded by 1,500 U/mL IL-2 for 5 days as described in Methods. (D) Survival of the same cohorts as described above. In the above panels, (B-D) one representative experiment out of 3 is depicted showing, the mean (4-6 mice/group) ± SD. Statistical analysis was performed by Student's t-test; p<0.05 CD11b+NK with GVHD group at day 28; ns for all other groups. (E) Colonoscopy on day 14 of mice from the BMT control, GVHD group, and mice that additionally received IL-2 expanded CD27+ or CD11b+ NK cell subsets. Two representative photographs are shown for each group with n = 2-5 mice/group.
Figure 2.
Figure 2.
CD11b+ NK cells have no negative impact on GVL. (A-C) Bioluminescence imaging (BLI) of Balb/c bearing luc+ BCL1 leukemia. Animals received T cell-depleted bone marrow (BM) +/- allogeneic T cells +/- defined natural killer (NK) cell subsets. (A) Impact of graft-versus-host disease (GVHD)-inducing T cells on GVL (BM + T). (B) Influence of additional treatment with IL-2 expanded CD27+ or CD11b+ NK cells on leukemia growth. In the above panels (A and B) days after bone marrow transplant (BMT) and BCL1 injection are indicated along the top of the panels and 3 representative animals per group are depicted over time. (C) Average photons emitted from luc+ BCL1 cells observed from ventral or lateral positioned imaging; n = 3 animals per group; Error bars represent SD.
Figure 3.
Figure 3.
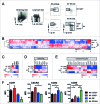
Gene profiling of murine NK subsets. Transcriptome analysis of phenotypically distinct subsets of natural killer (NK) cells in mice. (A) Gating strategy of C57Bl/6 splenocytes for MoFlo sorting of NK cell subsets. Viable single NK1.1+ and CD3/CD19 cells were distinguished based on expression of c-Kit, CD27 and CD11b. (B) Gene profiling of the four pre-dominant NK cell subsets. Unsupervised hierarchical clustering (i.e., Pearson centered, average linkage) of significantly regulated genes (at least 2-fold different from the median of all samples) of MoFlo sorted NK cell subpopulations from 2-3 independent experiments. Relative microarray expression levels are represented by a pseudocolor scale, as indicated. (C) Gene clustering of mean values of genes for the characteristic expression of NK surface molecules c-Kit, CD27 and CD11b (Itgam). (D-E) Genes were grouped according to their gene ontology. Gene clustering of mean values from 2-3 independent experiments of genes involved in cell-mediated cytotoxicity (D) and chemokine receptor expression (E). (F) Cytofluorimetric analysis of expression of different chemokine receptors performed on enriched NK cell subsets isolated from C57Bl/6 splenocytes. Mean ± SD of CCR7, CXCR3, CCR9 and CCR2 on Kit+CD27+ (black), CD27+ (red), KitCD27+CD11b+ (DP; blue) and CD11b+ (green) NK cells are indicated. Histograms depict the mean fluorescence index (MFI) of expression levels on NK cell subsets from 3 experiments. Error bars represent SD. Statistical significance was determined by Kruskal-Wallis test; *p<0.05; **p<0.01; ****p<0.0001.
Figure 4.
Figure 4.
Migration capacity of specific NK cell subsets. (A) Scheme of murine transplantation model to study migration capacity. One day after sublethal total body irradiation (TBI), mice received 2×10⁶ freshly isolated bone marrow (BM) and congenic CD45.1+ NK subsets. Purified bulk NK cells (B), MoFlo-sorted Kit+CD27+ (C), KitCD27+ (D), KitCD27+CD11b+ (DP) (E) or CD11b+ (F) NK cell subsets show different behaviors in their migration. Bone marrow, spleen, blood and lung of C57Bl/6 mice were analyzed in week 1 and 2 after transplantation by fluorescence cytometry. Kit CD45.1+ NK are indicated by red, Kit+ cells by black dots. One representative experiment out of 3 is depicted with percentages of either Kit+ (black) and Kit (red) indicated in the plots.
Figure 5.
Figure 5.
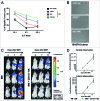
High cytotoxicity and GVL effect mediated by CD11b+ NK cells. (A) Tumor lysis capacity of freshly MoFlo sorted natural killer (NK) cell subsets from C57Bl/6 splenocytes determined against B16F10 melanoma (from C57Bl/6) at different effector-to-target (E:T) cell ratios with addition of IL-2, as described in Methods. After 24 h, specific tumor cell lysis was assessed by crystal violet assay. The graph shows 1 representative out of at least 3 independent experiments measured in triplicates. Error bars represent SD; Statistical analysis was performed by Student's t-test compared lysis induced by CD11b+ vs Kit+ NK at all E:T ratios; p<0.005. (B) Photographs from microscopy illustrating the tumor lytic effect induced by either IL-2 expanded CD27+ or CD11b+ NK cells on B16F10 tumor cells following 24 h of co-incubation. One representative photograph per condition was selected out of 3 independent experiments with similar results. (C) Luminescence imaging to assess the anti-leukemic capacity of CD11b+ NK cells in vivo. Balb/c mice were lethally irradiated at day 0 and received luc+ BCL1 cells, allogeneic T cell-depleted bone marrow (BM) +/- IL-2 expanded CD11b+ NK cells (BM + CD11b+ NK), as described for the graft-versus-host disease (GVHD) and graft versus leukemia (GVL) setting. Days after BMT and BCL1 injection are indicated along the top of the panels and 3 representative animals per group are depicted over time. (D) Average photons emitted from luc+ BCL1 cells observed from ventral or lateral positioned imaging; n = 3 animals per group; error bars represent SD.
Figure 6.
Figure 6.
CD11b+ NK cells efficiently suppress T-cell proliferation by elimination of allogeneic DCs. (A and B) Mixed lymphocyte reaction (MLR) addressing the impact of CD27+ or CD11b+ NK subsets on carboxyfluorescein succinimidyl ester (CFSE) labeled T cells from C57Bl/6 stimulated by dendritic cells (DCs) from Balb/c donors. CFSE dilution was measured by fluorescence cytometry. (B) Bone marrow derived DCs were additionally stimulated over night by lipopolysaccharide (LPS) before the MLR was initiated. (C) Same MLR setting as in (A) but with separation of NK subsets from direct T cell and DC contact using transwell-plates. (D and E) Killing capacity by either CD27+ or CD11b+ NK cells determined by cytofluorimetric analysis of analysis of Annexin V and the % DC viability calculated by the ratio of Annexin/7AAD. (E) Same setting as (D) but additional 24 h LPS stimulation of DCs. (A-E) NK:DC ratio was 1:1. Statistical significance was determined by Kruskal-Wallis test; *p<0.05; **p<0.01.

Similar articles

Cited by

References

    1. Ruggeri L, Capanni M, Urbani E, Perruccio K, Shlomchik WD, Tosti A, et al. . Effectiveness of donor natural killer cell alloreactivity in mismatched hematopoietic transplants. Science 2002; 295:2097-100. - PubMed
    1. Asai O, Longo DL, Tian ZG, Hornung RL, Taub DD, Ruscetti FW, et al. . Suppression of graft-versus-host disease and amplification of graft-versus-tumor effects by activated natural killer cells after allogeneic bone marrow transplantation. J Clin Invest 1998; 101:1835-42. - PMC - PubMed
    1. Olson JA, Leveson-Gower DB, Gill S, Baker J, Beilhack A, Negrin RS. NK cells mediate reduction of GVHD by inhibiting activated, alloreactive T cells while retaining GVT effects. Blood 115:4293-301. - PMC - PubMed
    1. Giebel S, Locatelli F, Lamparelli T, Velardi A, Davies S, Frumento G, et al. . Survival advantage with KIR ligand incompatibility in hematopoietic stem cell transplantation from unrelated donors. Blood 2003; 102:814-9. - PubMed
    1. Miller JS, Soignier Y, Panoskaltsis-Mortari A, McNearney SA, Yun GH, Fautsch SK, et al. . Successful adoptive transfer and in vivo expansion of human haploidentical NK cells in patients with cancer. Blood 2005; 105:3051-7. - PubMed

Publication types