. 2015 Feb 3;4(1):e985924.
doi: 10.4161/2162402X.2014.985924. eCollection 2015 Jan.

MHC-I modulation due to changes in tumor cell metabolism regulates tumor sensitivity to CTL and NK cells

Affiliations

MHC-I modulation due to changes in tumor cell metabolism regulates tumor sensitivity to CTL and NK cells

Elena Catalán et al. Oncoimmunology. .

Abstract

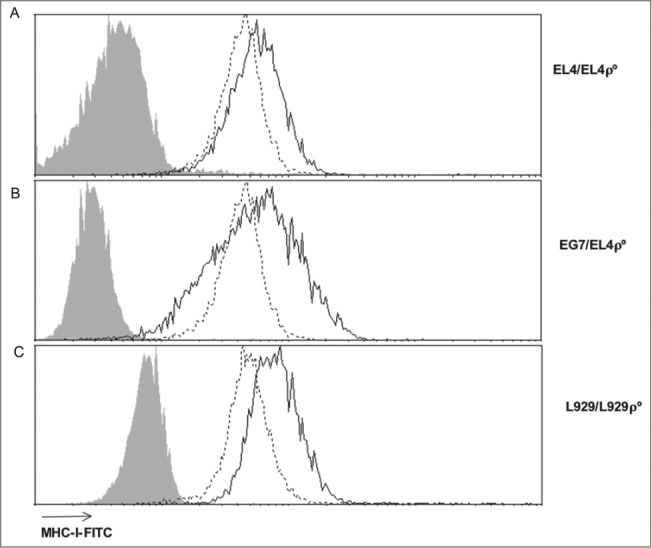
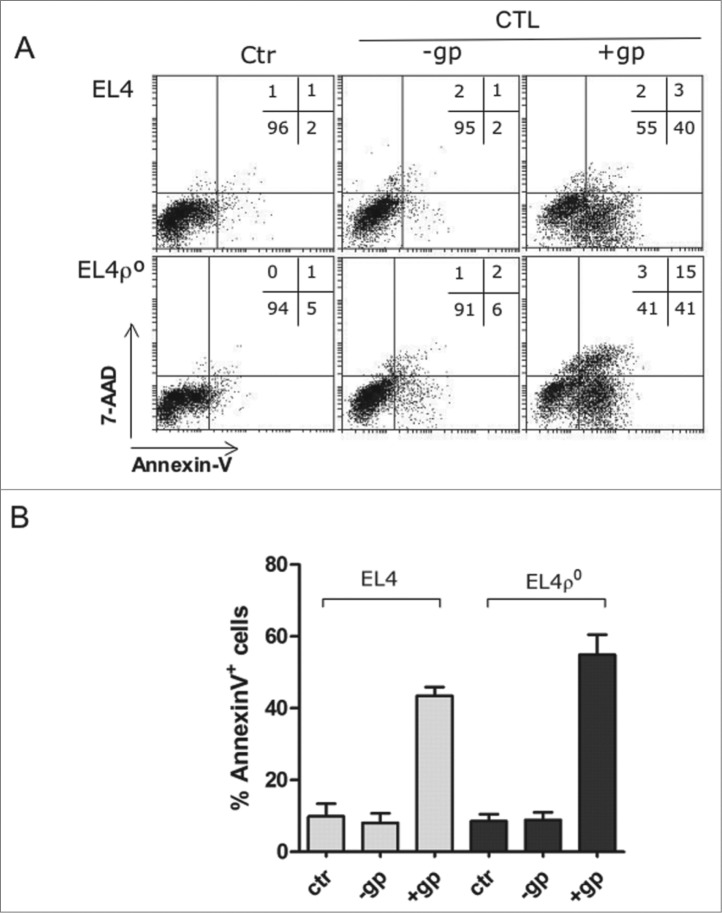
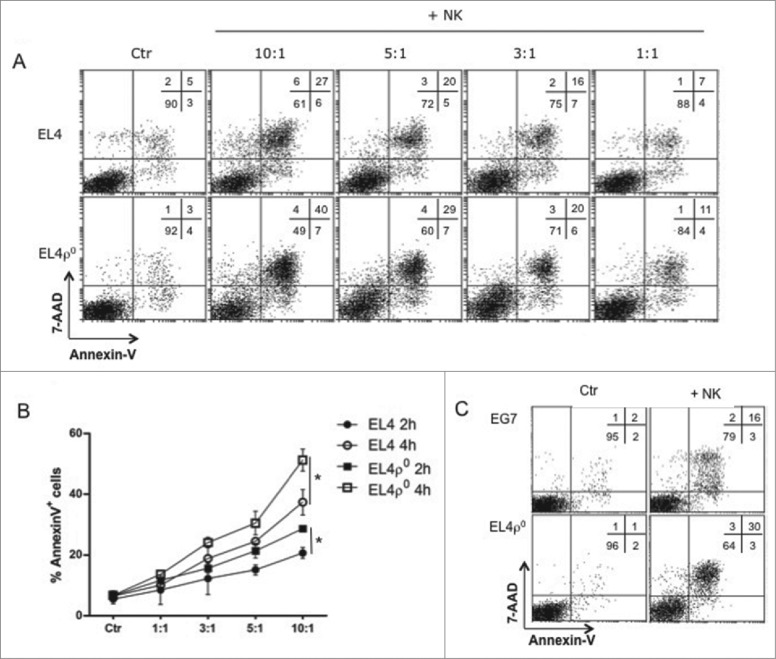
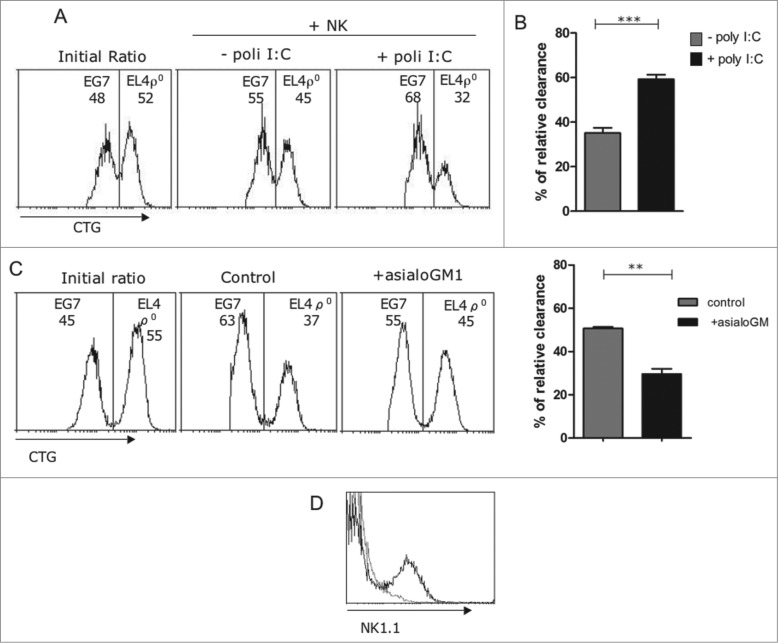
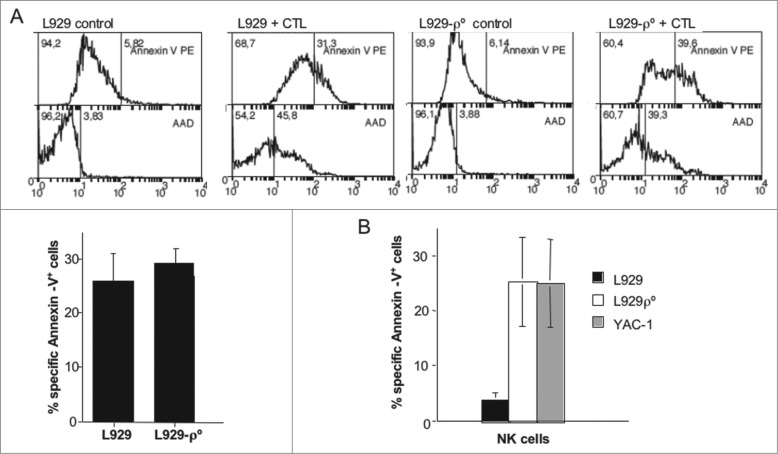
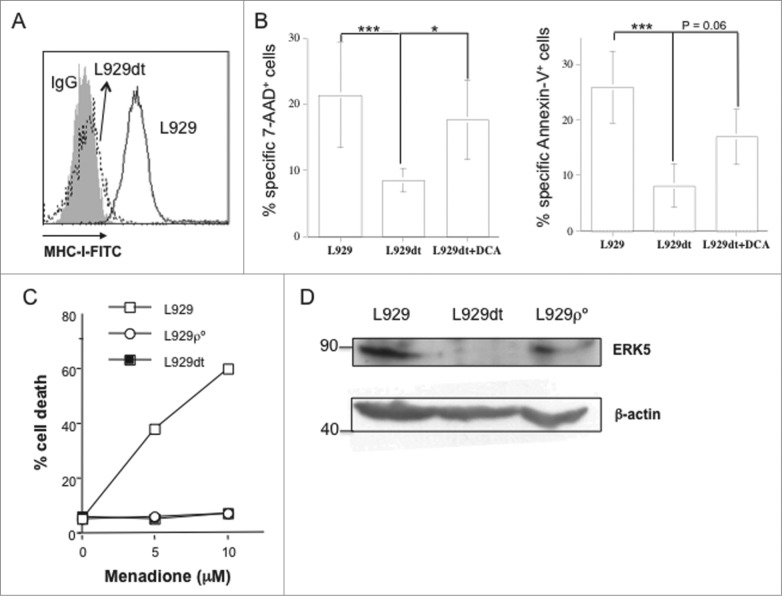
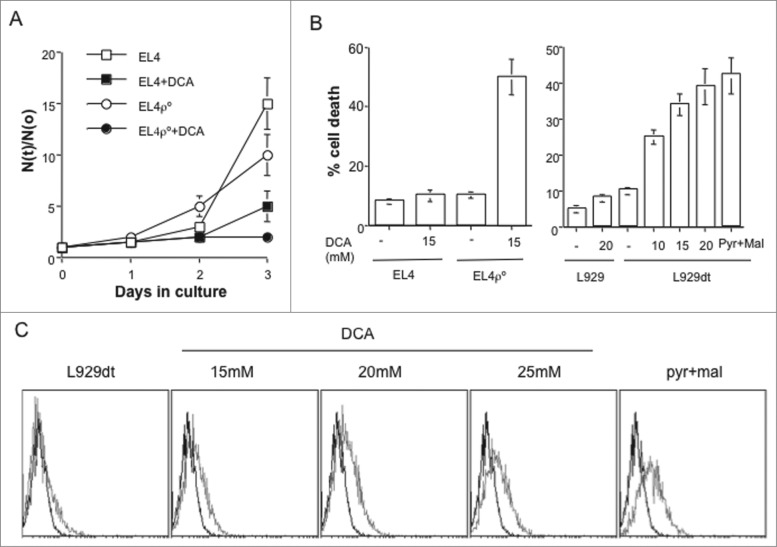
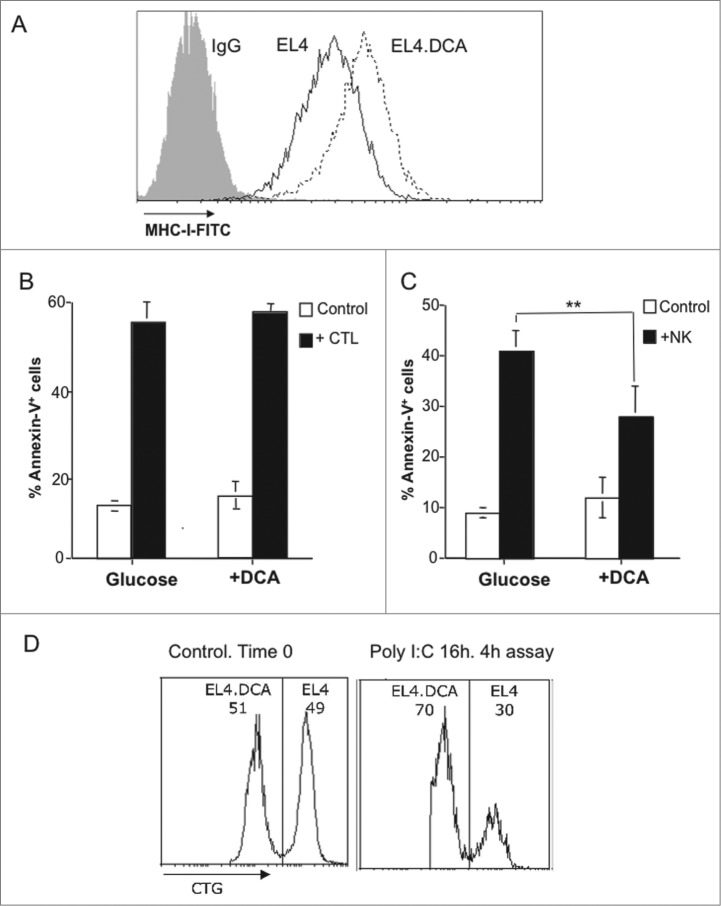
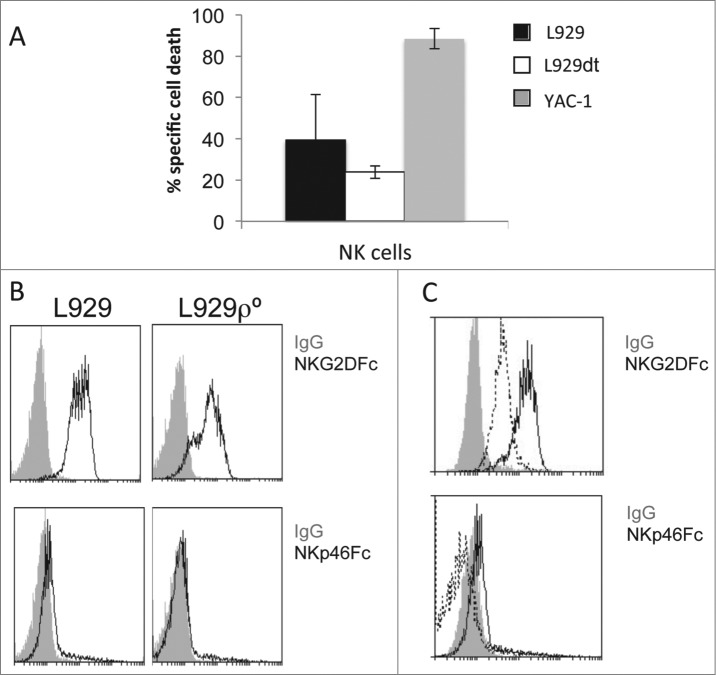
Tumor cells have a tendency to use glucose fermentation to obtain energy instead of mitochondrial oxidative phosphorylation (OXPHOS). We demonstrated that this phenotype correlated with loss of ERK5 expression and with reduced MHC class I expression. Consequently, tumor cells could evade cytotoxic T lymphocyte (CTL)-mediated immune surveillance, but also increase their sensitivity to natural killer (NK) cells. These outcomes were evaluated using two cellular models: leukemic EL4 cells and L929 transformed fibroblasts and their derived ρ° cell lines, which lack mitochondrial DNA. We have also used a L929 cell sub-line that spontaneously lost matrix attachment (L929dt), reminiscent of metastasis generation, that also downregulated MHC-I and ERK5 expression. MHC-I expression is lower in ρ° cells than in the parental cell lines, but they were equally sensitive to CTL. On the contrary, ρ° cells were more sensitive to activated NK cells than parental cells. On the other hand, L929dt cells were resistant to CTL and NK cells, showed reduced viability when forced to perform OXPHOS, and surviving cells increased MHC-I expression and became sensitive to CTL. The present results suggest that when the reduction in MHC-I levels in tumor cells due to glycolytic metabolism is partial, the increase in sensitivity to NK cells seems to predominate. However, when tumor cells completely lose MHC-I expression, the combination of treatments that increase OXPHOS with CTL-mediated immunotherapy could be a promising therapeutic approach.

Keywords: CTG; NK cells; cancer immunotherapy; cell tracker green; CTL; cytotoxic T lymphocyte; DCA; cytotoxic T lymphocytes; deoxy-ribonucleic acid; ERK5; dichloroacetate; dicholoroacetate; DNA; extracellular regulated kinase 5; FCS; fetal calf serum; mAb; glucose metabolism; magnetic cell separation; MHC-I; major histocompatibility complex class I; mRNA; messenger ribonucleic acid; NK; monoclonal antibody; MACS; natural killer; OXPHOS; oxidative phoshorylation; PBS; phosphate buffered saline; Poly I:C; polyinosinic: cytidilic acid; RNA; ribonucleic acid; sh; small hairpin; ρ° cells.


Figures

Figure 1.
Figure 1.
ρ° cells show low MHC-I expression. Surface MHC-I expression was analyzed by flow cytometry using FITC-labeled anti-H-2Kb (EL4, EG7 and EL4-ρ° cells) or anti-H-2Kk (L929 and L929-ρ° cells) or isotype control antibodies (gray-filled). The continuous black line represents parental cells and the discontinuous black line corresponds to ρ° cells in each case.
Figure 2.
Figure 2.
EL4 and EL4ρ° cells were equally sensitive to CTLs. (A) CD8+ T cells were purified by MACS from the spleens of C57BL/6 granzyme A−/− mice after 8 d of infection with LCMV, labeled with cell tracker green (CTG) and tested against EL4 or EL4-ρ° cells for 2 h at an effector:target (E:T) ratio of 10:1 in the presence (+gp+CTL) or absence (−gp+CTL) of the LCMV peptide gp33. Then, target cells were gated as the CTG-negative population and, at time 0 (Ctr) or after the 2 h incubation with the CTL, plasma membrane intregrity was tested by nuclear 7-AAD incorporation and PS exposure by labeling with annexin-V-PE and flow cytometry. Numbers in the dot-plots show the percentage of cells in each quadrant. (B) Summary of all experiments performed. Antiviral CTL from gzmA−/− mice were incubated with EL4 or EL4-ρ° cells, as indicated in A. The cytolytic activity was evaluated by the percentages of annexin-V+ cells. Data showed the mean ± SD of at least three different experiments.
Figure 3.
Figure 3.
EL4ρ° cells were more sensitive to NK cells. (A) C57BL/6 granzyme A−/− mice were injected with 100 μg of poly I:C and 16 h later, NK cells were purified by MACS, labeled with cell tracker green (CTG) and tested against EL4 and EL4-ρ° cells for 4 h at the effector:target ratios indicated. Then, target cells were gated as the CTG-negative population at time 0 (Ctr) or after 4 h incubation with NK cells, plasma membrane intregrity was tested by 7-AAD incorporation and PS exposure by annexin-V-PE. Numbers in the dot-plots show the percentage of cells in each quadrant. (B) Activated NK cells were tested for 2 (black symbols) or 4 h (white symbols) against EL4 (circles) or EL4-ρ° cells (squares) target cells at different E:T ratios used. Data showed the percentages of apoptosis in each experimental condition and are the mean ± SD of at least three different experiments. * p < 0.05. (C) Representative experiment as that shown in (A), using activated NK cells from gzmA−/− mice against EG7 or EL4-ρ° cells at an 10:1 E:T ratio.
Figure 4.
Figure 4.
NK cells eliminated EL4ρ° cells in vivo. (A) 5 × 10⁵ EG7 or EL4-ρ° cells were labeled with 0,5 μM (CTGlow) or 5 μM cell tracker green (CTGhigh), respectively, and mixed at a 1:1 ratio (Initial ratio). Labeled target cells were then injected i.p. in 200 μL RPMI 2% heat-inactivated FBS in gzmA−/− mice, untreated (- poly I:C), or injected 16 h before with 0.1 mg poly-IC in 0.1 mL PBS (+poly I:C). Mice were sacrificed 4 h later and peritoneal cells collected, washed in PBS, and analyzed on a FACSCalibur flow cytometer. (B) Relative in vivo clearance of EL4-ρ° cells with respect to EG7 cells in untreated (gray bar) or in gzmA−/− mice pre-treated with poly I:C (black bar). Results are the mean ± SD of 6 gzmA−/− mice for each experimental condition. (C) Wild type mice were injected either with 50 μL of rabbit control serum or with a polyclonal rabbit anti-asialo GM1 serum at days -2 and 0 before injecting the labeled cells. Then, the same experiment as in (A) was performed, using these mice injected 16 h before with poly I:C. The graphic in the right shows the relative in vivo clearance of EL4-ρ° cells with respect to EG7 cells in control mice (gray bar) or in mice pre-treated with the anti-asialo GM1 serum (black bar). Results are the mean ± SD of four mice for each experimental condition. (D) The labeling of NK1.1+ cells in splenocytes from mice untreated (black histogram) or treated with the anti-asialo GM1 serum (gray histogram) was shown in the top right panel. *, p < 0.05
Figure 5.
Figure 5.
L929ρ° cells were more sensitive to NK cells. (A) Allogeneic CTL were generated by culturing C57BL/6 splenocytes with mitomycin-treated C3H splenocytes in the presence of murine IL-2 during 5 d. Aferwards, CD8+ T cells were purified by MACS, labeled with cell tracker green (CTG) and tested against L929 or L929-ρ° cells for 4 h at an effector:target (E:T) ratio of 10:1. Then, target cells were gated as the CTG-negative population at time 0 (controls) or after the 4 h incubation with the CTL. Plasma membrane intregrity was tested by nuclear 7-AAD incorporation and PS exposure by labeling with annexin-V-PE and flow cytometry, as indicated in the panels. Numbers in the figures showed the percentage of cells negative (left) or positive (right) for each parameter. The bottom graphic showed the summary of apoptosis inductin in all experiments perfromed. Data correspond to the annexin-V-PE target cell labeling after incubation with the CTL minus spontaneous labeling. The results represent the mean ± SD of at least four different experiments.(B) C3H mice were injected with 100 μg of poly I:C and 16 h later, NK cells were purified by MACS, labeled with cell tracker green (CTG) and tested against L929, L929-ρ° or YAC-1 cells for 4 h at a 10:1 E:T ratio. Target cells were gated as the CTG-negative population and PS exposure determined by labeling with annexin-V-PE and flow cytometry. Data correspond to the labeling for each target cell after incubation with the NK cells minus spontaneous labeling and represents the mean ± SD of three different experiments.
Figure 6.
Figure 6.
L929dt cells lose MHC-I and ERK5 expression and are resistant to CTL and menadione. (A) MHC-I expression in L929 and L929dt cells was determined as indicated in Fig. 1. (B) L929, L929dt or L929dt cells supplemented or with 15 mM DCA were incubated with allogeneic CTL and cytotoxicity was tested as indicated in Fig. 6A. Histograms showed cell death measured by 7-AAD incorporation (left) and annexin-V+ binding (right). Results represent mean ± SD of at least two different experiments for each experimental condition. ***, p < 0.01; *, p < 0.05. (C) L929, L929dt or L929-ρ° cells were incubated during 24 h with the indicated concentrations of menadione and cell death was determined by Trypan blue staining. (D) ERK5 expression was determined by immunoblot on extracts from L929, L929dt or L929-ρ° cells, as indicated. β-actin immunobloting was used as a loading control.
Figure 7.
Figure 7.
Changing tumor cell metabolism sensitize them to CTL. (A) Cell growth of EL4 and EL4-ρ° cells in the presence or absence of 15 mM DCA was determined by counting the number of viable cells during 4 d of culture and the results expressed as the ratio between the number of cells at a given time (N(t)) and the initial number of cells (N(o)). (B) EL4 and EL4-ρ° cells (left graphic) or L929 and L929dt cells (right graphic) were incubated during 72 h with the indicated concentrations of DCA or in the absence of glucose and in the presence of 12.5 mM pyruvate/malate. Cell death was determined by Trypan blue exclusion. (C) L929dt cells were incubated during 72 h in the absence or presence of the indicated concentrations of DCA or with pyruvate/malate in the absence of glucose, viable cells gated by flow cytometry, and MHC-I expression determined as indicated in Fig. 1. In each panel, the black histogram represents the labeling with a control Ig and the gray histogram the labeling with the anti-MHC-I antibody.
Figure 8.
Figure 8.
DCA effects on MHC-I expression in EL4 cells and sensitivity to CTL and NK cells. (A) EL4 cells were cultured during 3 d in medium containing 25 mM glucose in the absence (black histogram) or in the presence of 15 mM DCA (pointed histogram). MHC-I expression was analyzed by flow cytometry as indicated in the legend of Fig. 1. The black histogram corresponds to the labeling by a control Ig. (B) Antiviral CD8+ T cells were tested against EL4 cells supplemented or not with DCA, as indicated in the legend of Fig. 3. The percentages of Annexin-V+ cells are shown, at the basal level (white bar), or after the 2 h incubation with the antiviral CTL from wild type mice (black bar) Results were the mean ± SD of three different experiments. (C) NK cell-mediated cytotoxicity was tested on EL4 cells supplemented or not with DCA, as indicated in the legend of Fig. 4. The percentages of Annexin-V+ cells are shown, at the basal level (white bar), or after the 4 h incubation with activated NK cells from wt mice (black bar). Results are the mean ± SD of four different experiments. (D) 5 × 10⁵ EL4 cells cultured during 3 d in medium containing 25 mM glucose in the presence of 15 mM DCA were labeled with 0, 5 μM (CTGlow) and those cultured in the absence of DCA were labeled with 5 μM cell tracker green (CTGhigh), respectively, and mixed at a 1:1 ratio (Control. Time 0). Labeled target cells were then injected i.p. in 200 μL RPMI 2% heat-inactivated FBS in wild type mice injected 16 h before with 0.1 mg poly-IC in 0.1 mL PBS (+poly I:C). Mice were sacrificed 4 h later and peritoneal cells collected, washed in PBS, and analyzed on a FACSCalibur flow cytometer.
Figure 9.
Figure 9.
The sensitivity of L929dt cells to NK cells is not increased despite loss of MHC-I expression.(A) C3H mice were injected with 100 μg of poly I:C and 16 h later, NK cells were purified by MACS, labeled with cell tracker green (CTG) and tested against L929, L929dt or YAC-1 cells for 4 h at a 10:1 E:T ratio. Target cells were gated as the CTG-negative population and the percentage of dead cells was determined by labeling with annexin-V-PE and 7-AAD and flow cytometry. Data correspond to the labeling for each target cell after incubation with the NK cells minus spontaneous labeling and represents the mean ± SD of three different experiments. (B, C) Expression of NKG2D and NKp46 (NCR1) ligands on the surface of L929, L929-ρ° (B) and L929dt cells (C) was analyzed by flow cytometry using NKG2D-Fc and NKp46-Fc chimeras and a secondary FITC-labeled anti-human IgG mAb. The gray-filled histograms represent the labeling with the secondary mAb alone, and, in (C), the pointed-line histogram represents the labeling for L929dt cells, while the black-line histogram represents the labeling for L929 cells.

References

    1. Warburg O. On respiratory impairment in cancer cells. Science 1956; 124:269y-70; PMID: - PubMed
    1. Charni S, de Bettignies G, Rathore MG, Aguiló JI, van den Elsen PJ, Haouzi D, Hipskind RA, Enriquez JA, Sanchez-Beato M, Pardo J, et al. Oxidative phosphorylation induces de novo expression of the MHC class I in tumor cells through the ERK5 pathway. J Immunol 2010; 185:3498-503; PMID:; http://dx.doi.org/10.4049/jimmunol.1001250 - DOI - PubMed
    1. Dunn C, Wiltshire C, MacLaren A, Gillespie DAF. Molecular mechanism and biological function of JNK signaling via the c-Jun transcription factor. Cell Signal 2002; 14:585-93; PMID:; http://dx.doi.org/10.1016/S0898-6568(01)00275-3 - DOI - PubMed
    1. Villalba M, Rathore MG, López-Royuela N, Krzywinska E, Garaude J, Allende-Vega N. From tumor cell metabolism to tumor immune escape. Int J Biochem Cell Biol 2013; 45:106-13; PMID:; http://dx.doi.org/10.1016/j.biocel.2012.04.024 - DOI - PubMed
    1. Garaude J, Kaminski S, Charni S, Aguiló JI, Jacquet C, Plays M, Rodriguez F, Hernández J, Hipskind RA, Anel A, et al. Impaired anti-leukemic immune response in PKCq-deficient mice. Mol Immunol 2008; 45:3463-9; PMID:; http://dx.doi.org/10.1016/j.molimm.2008.03.016 - DOI - PubMed

Publication types