. 2015 Feb 25;4(2):e978709.
doi: 10.4161/2162402X.2014.978709. eCollection 2015 Feb.

Tumor stroma and chemokines control T-cell migration into melanoma following Temozolomide treatment

Affiliations

Tumor stroma and chemokines control T-cell migration into melanoma following Temozolomide treatment

Kar Wai Tan et al. Oncoimmunology. .

Abstract

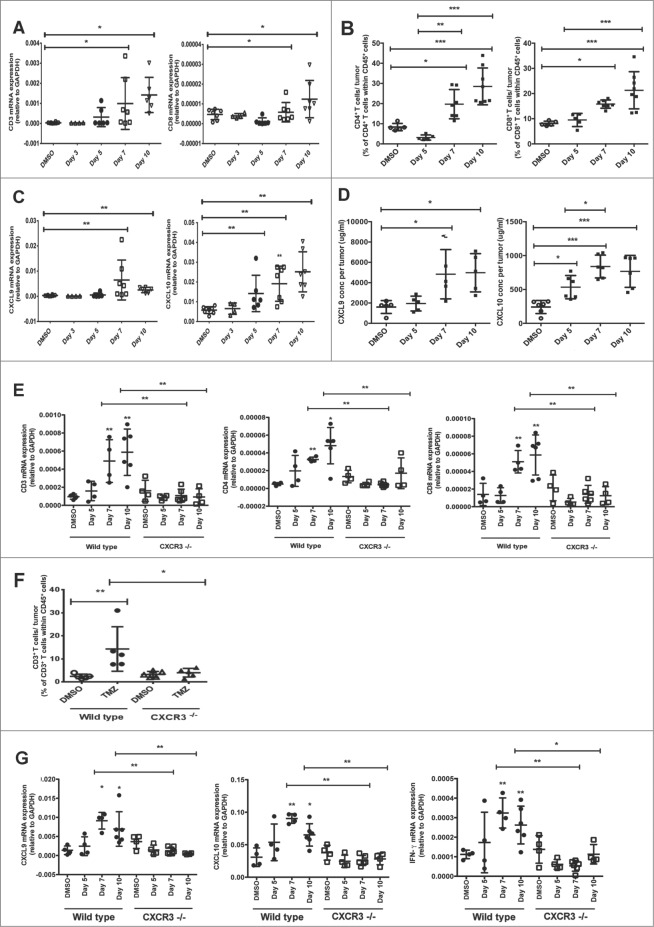
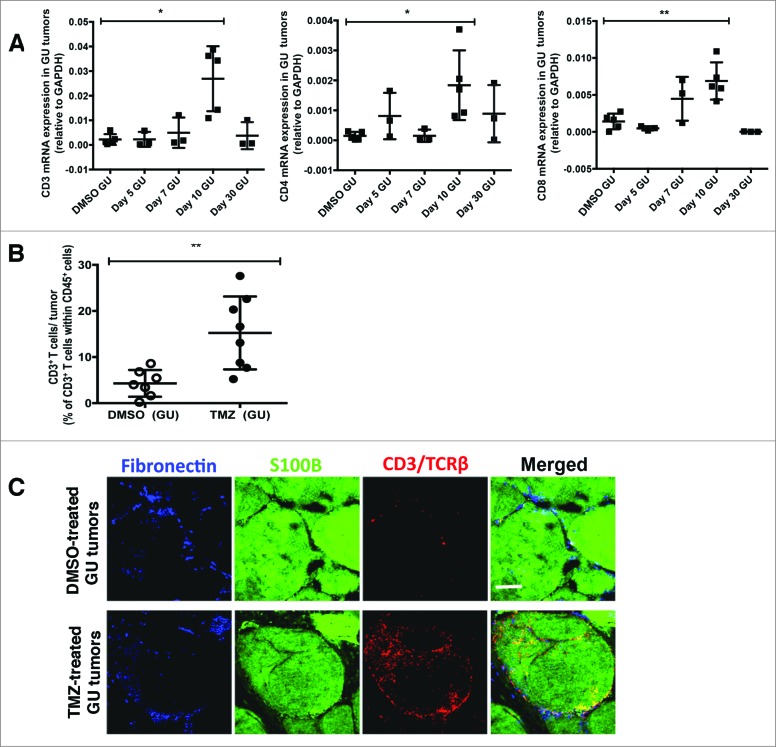
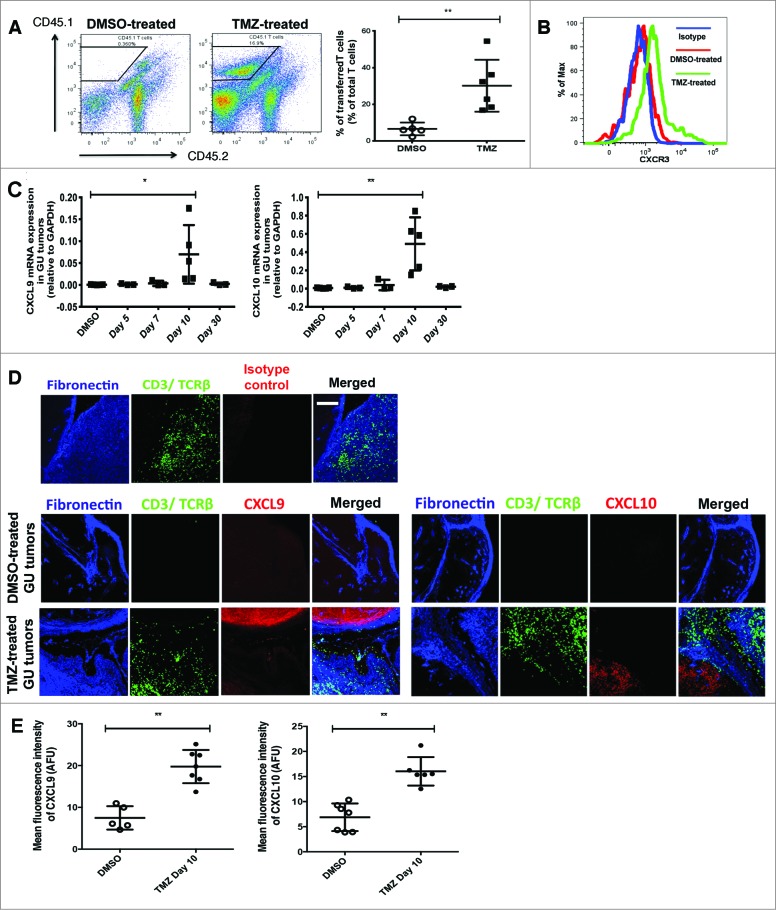
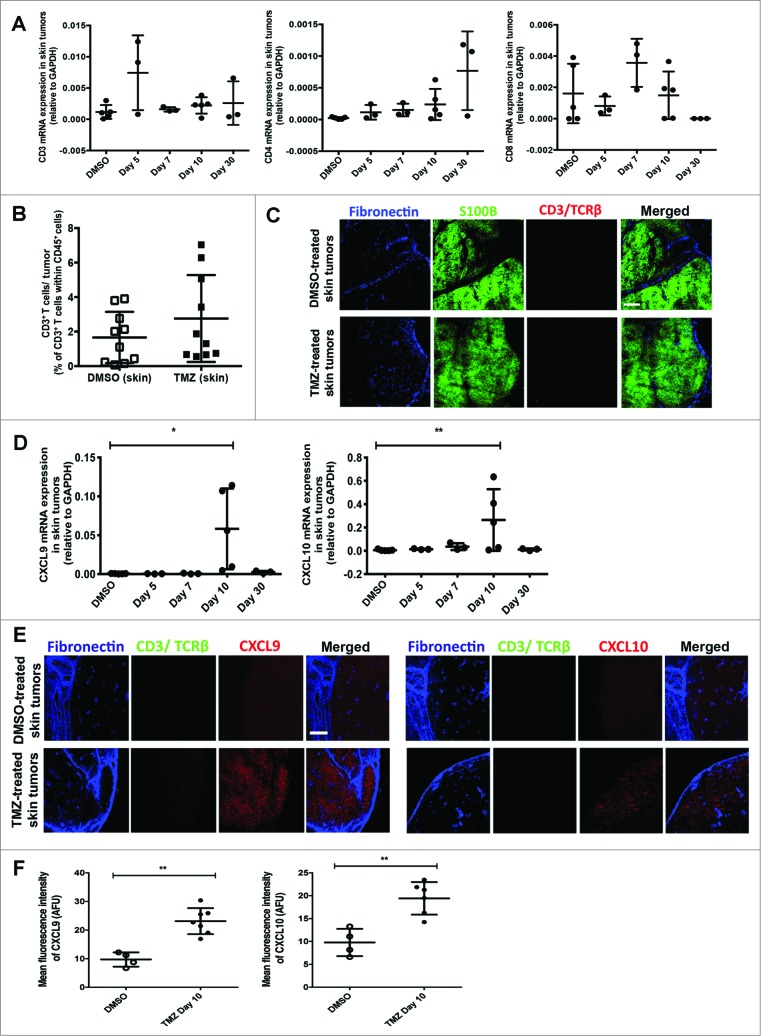
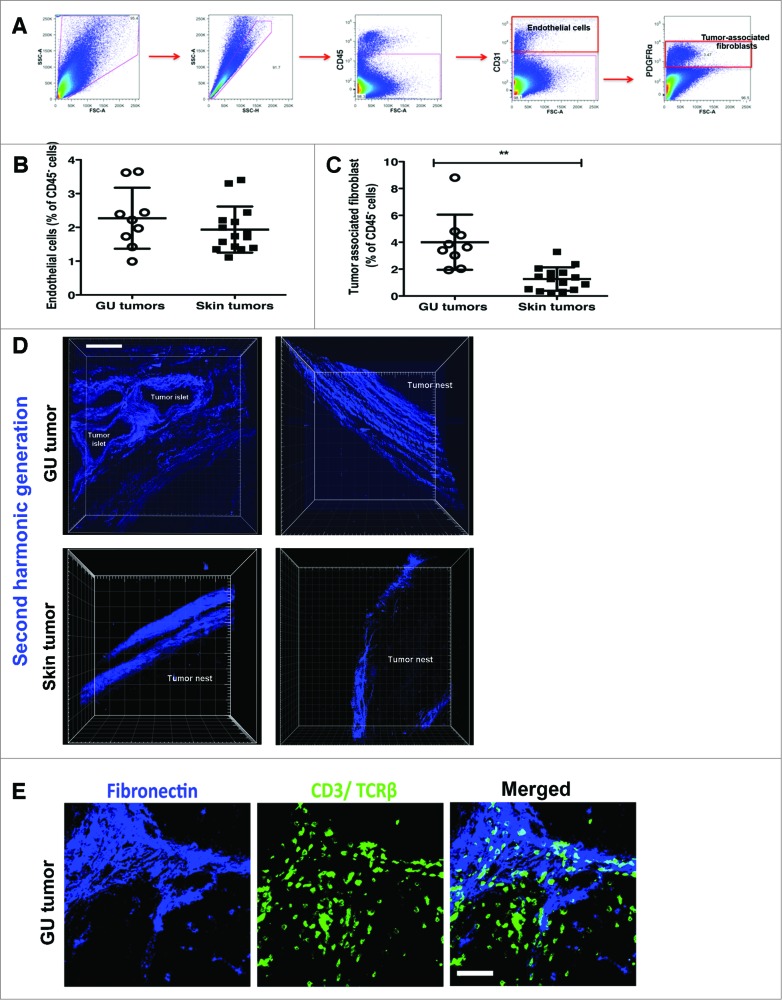
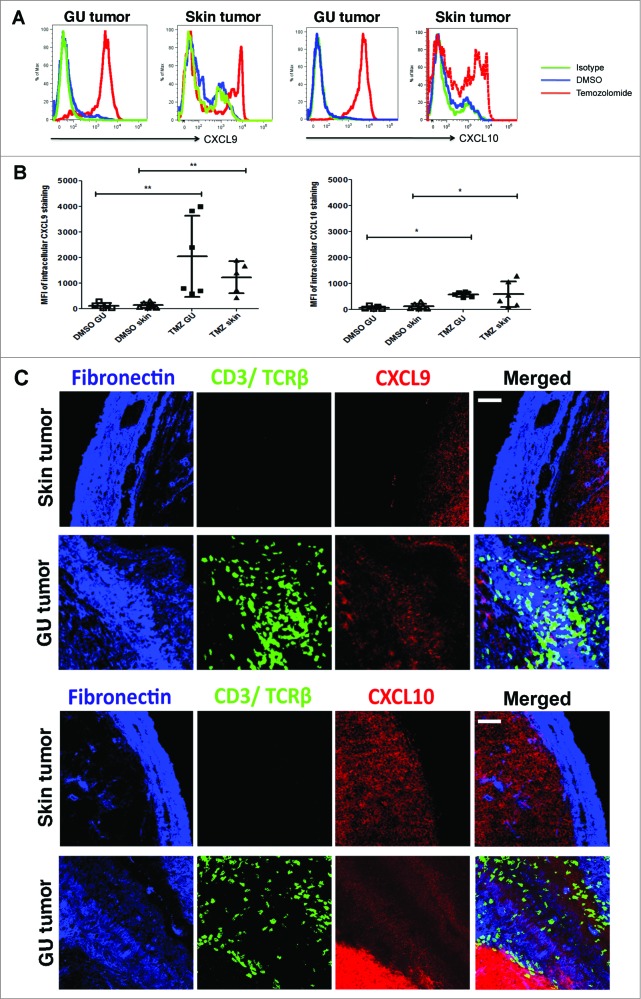
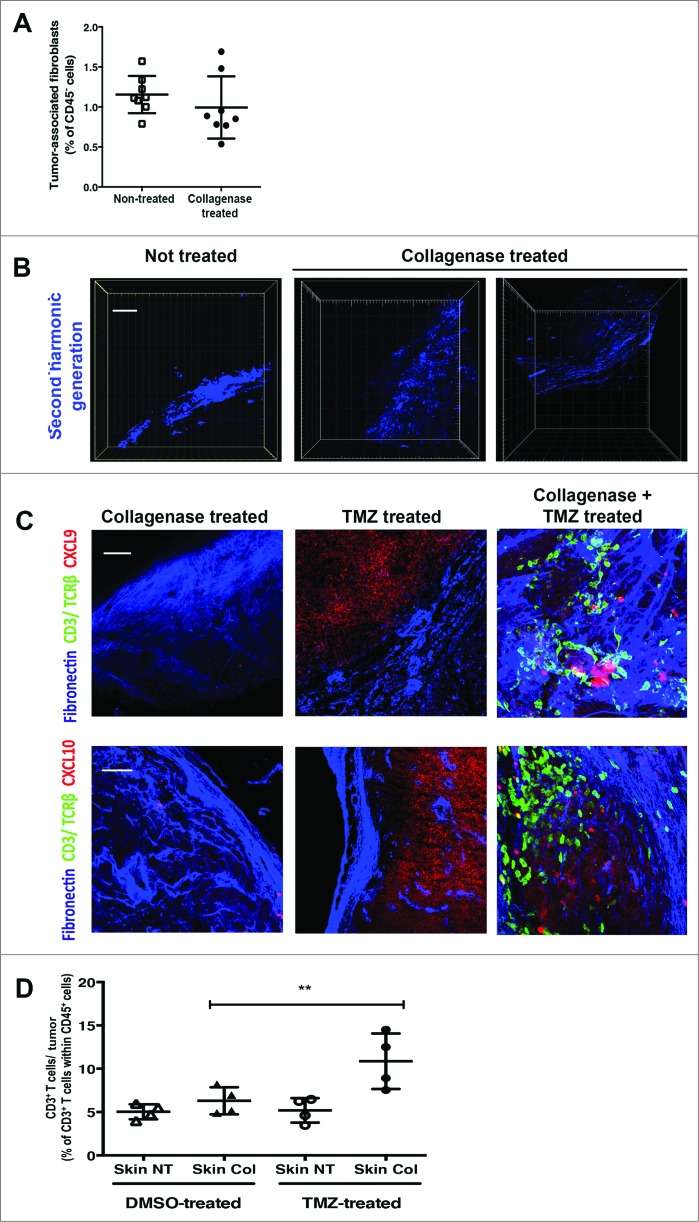
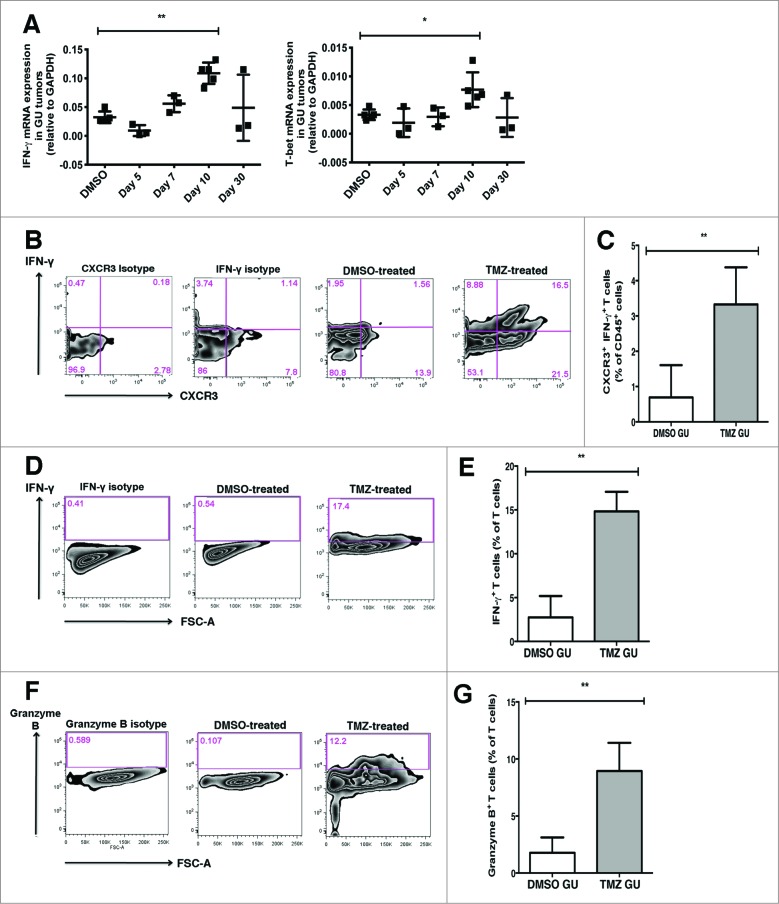
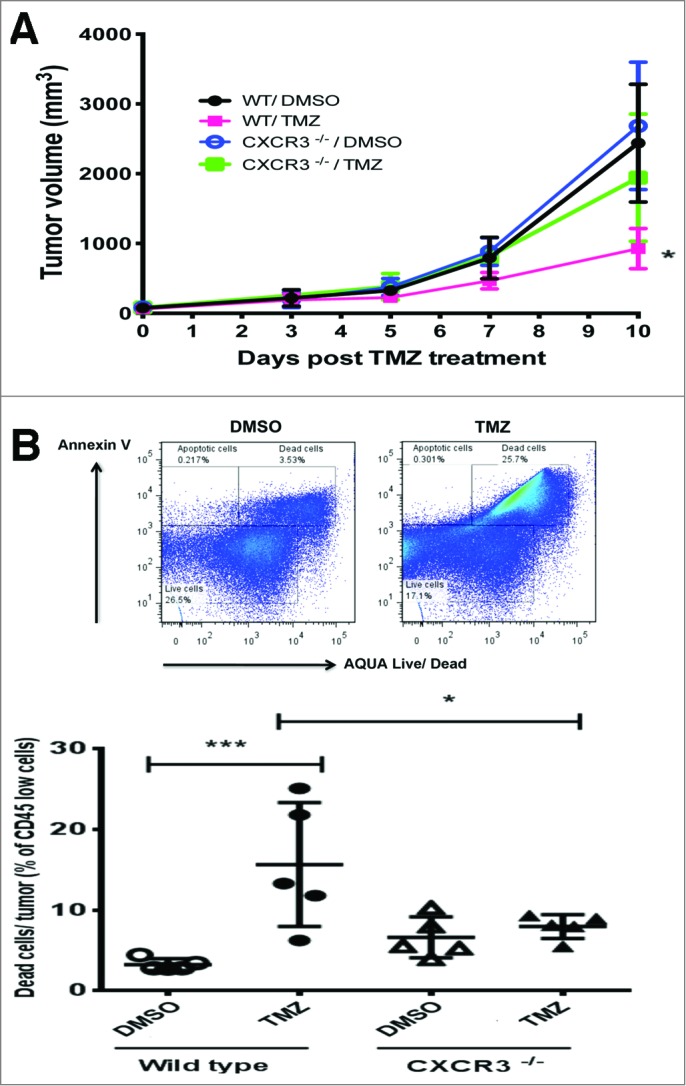
The infiltration of T lymphocytes within tumors is associated with better outcomes in cancer patients, yet current understanding of factors that influence T-lymphocyte infiltration into tumors remains incomplete. In our study, Temozolomide (TMZ), a chemotherapeutic drug used to treat metastatic melanoma, induced T-cell infiltration into transplanted melanoma and into genitourinary (GU) tumors in mice developing spontaneous melanoma. In contrast, TMZ treatment did not increase T-cell infiltration into cutaneous tumors, despite similar increases in the expression of the (C-X-C) chemokines CXCL9 and CXCL10 in all sites after TMZ exposure. Our findings reveal that the matrix architecture of the GU tumor stroma, and its ability to present CXCL9 and CXCL10 after TMZ treatment played a key role in favouring T-cell infiltration. We subsequently demonstrate that modifications of these key elements by combined collagenase and TMZ treatment induced T-cell infiltration into skin tumors. T cells accumulating within GU tumors after TMZ treatment exhibited T helper type-1 effector and cytolytic functional phenotypes, which are important for control of tumor growth. Our findings highlight the importance of the interaction between tumor stroma and chemokines in influencing T-cell migration into tumors, thereby impacting immune control of tumor growth. This knowledge will aid the development of strategies to promote T-cell infiltration into cancerous lesions and has the potential to markedly improve treatment outcomes.

Keywords: CTL, cytolytic T lymphocyte; CXCL, Chemokine (C-X-C motif) ligand; ECM, extracellular matrix; GU, genitourinary; GZB, Granzyme B; HSPG, heparan sulphate proteoglycan; IFNγ, interferon γ; TAF, tumor-associated fibroblast; TILs, tumor-infiltrating lymphocytes; TMZ, Temozolomide; Th, T helper; Treg, T regulatory; WT, wild-type; chemokines; temozolomide; tumor stroma; tumor-infiltrating lymphocytes.


Figures

Figure 1.
Figure 1.
Temozolomide treatment induces T-cell infiltration into transplanted Melan-ret tumors in a CXCR3-dependent manner. (A-G) C57/BL6 wild type (WT) and Cxcr3−/− mice were injected subcutaneously in each flank with 106 Melan-ret cells and treated with either 2 mg Temozolomide (TMZ) or vehicle [dimethyl sulfoxide (DMSO)] daily for 3 days once tumors became palpable. Tumors were dissociated and analysed as indicated. (A) qRT-PCR analysis of the gene expression of CD3 and CD8 in transplanted tumors at various time points post- treatment. (B) Flow cytometry analysis of CD4+ and CD8+ T cells in transplanted tumors at various time points post-treatment. (C) Gene expression of CXCL9 and CXCL10 in transplanted tumors at various time points post-treatment. (D) ELISA analysis of CXCL9 and CXCL10 protein levels in transplanted tumors at various time points post-treatment. (E) Gene expression of CD3, CD4 and CD8 in transplanted Melan-ret tumors from WT and Cxcr3−/− mice at various time points posttreatment. (F) Flow cytometry analysis for CD3+ T cells in transplanted Melan-ret tumors from WT and Cxcr3−/− mice at day 7 after treatment. (G) Gene expression of CXCL9, CXCL10 and IFNγ in Melan-ret tumors from WT and Cxcr3−/− mice at various time points post-treatment. Data from panels: (A and C) are pooled from 2 independent experiments with 4-5 mice per group in each experiment (n = 6-8/group); (B and D) consist of 5-7 mice per group; (E-G) are pooled from 2 independent experiments with 3-4 mice per group in each experiment (n = 6-8/group). Bars represent mean ± SD. Statistical analyses were performed using one-way ANOVA test with Bonferroni's post-test analysis; *p<0.05, **p<0.01.
Figure 2.
Figure 2.
Temozolomide treatment induces T-cell infiltration into genitourinary tumors in a model of spontaneous melanoma. (A-C) RETAAD mice were treated with Temazolomide (TMZ) only or dimethyl sulfoxide (DMSO) vehicle after they were determined to have developed genitourinary (GU) and cutaneous tumors by clinical examination. (A) qRT-PCR analysis was performed to examine for gene expression of CD3, CD4 and CD8 in GU tumors from RETAAD mice following TMZ treatment. (B) Flow cytometry analysis of T cells in GU tumors from RETAAD mice at day 10 after TMZ treatment. (C) Immunofluorescence imaging to detect T cells in GU tumors from RETAAD mice at day 10 after TMZ treatment. Data from (A) are pooled from 3-5 mice per group and data from (B) are pooled from 2 separate experiments with 3-4 mice per group in each experiment (n = 6-8 in each group). Bars represent mean ± SD. Statistical analyses were performed using one-way ANOVA test with Bonferroni's post-test analysis in (A) and the unpaired two-tailed Student's t-test in (B); *p<0.05, **p<0.01. Images from (C) are representative of 5 independent experiments (n = 5 in each group). Scale bars in (C) represent 200 μm.
Figure 3
Figure 3
(See previous page). Temozolomide treatment of RETAAD mice induces intratumoral upregulation of CXCL9 and CXCL10. (A-E) RETAAD mice were treated with Temazolomide (TMZ) or dimethyl sulfoxide (DMSO) vehicle only after they were determined to have developed genitourinary (GU) and cutaneous tumors by clinical examination. (A) In vitro activated CD45.1 T cells were transferred into RETAAD mice at day 10 following DMSO or TMZ treatment. Recipient mice were sacrificed 5 days after T-cell transfer. Dissociated tumor cells were immunostained and flow cytometry was performed to detect transferred CD45.1 T cells in GU tumors. (B) CXCR3 expression on the surface of infiltrating T cells in GU tumors from DMSO or TMZ-treated mice was examined by immunostaining and flow cytometry analysis. (C) qRT-PCR analysis of gene expression of CXCL9 and CXCL10 in GU tumors at various time points after TMZ treatment. (D) Immunofluorescence imaging was performed to examine CXCL9 and CXCL10 protein expression in GU tumors at day 10 after TMZ treatment. (E) Mean fluorescence index (MFI) quantification of CXCL9 and CXCL10 staining in GU tumors at day 10 after TMZ treatment. Data from panel: (A) are pooled from 2 separate experiments with 3 mice per group in each experiment (n = 6/group); (B) is representative of 4 separate experiments (n = 4/group); (C and E) are pooled from 4-6/group. Bars represent mean ± SD. Statistical analyses were performed using the unpaired two-tailed Student's t-test in (A and E) and the one-way ANOVA test with Bonferroni's post-test analysis in (C); *p<0.05, **p<0.01. Images from (D) are representative of 4-6 independent experiments (n = 4-6/group). Scale bars in (D) represent 200 μm.
Figure 4
Figure 4
(See previous page). Temozolomide treatment does not induce T-cell infiltration into skin tumors from RETAAD mice despite increased CXCL9 and CXCL10 expression. Cutaneous tumor-bearing RETAAD mice were treated with Temazolomide (TMZ) or dimethyl sulfoxide (DMSO) vehicle. (A) qRT-PCR analysis of gene expression of CD3, CD4 and CD8 in skin tumors following Temozolomide (TMZ) treatment. (B) Flow cytometry analysis of T cells in skin tumors from RETAAD mice at day 10 after TMZ treatment. (C) Immunofluorescence imaging to detect T cells in skin tumors at day 10 after TMZ treatment. (D) CXCL9 and CXCL10 gene expression in skin tumors following TMZ treatment. (E) Immunofluorescence imaging was performed to examine CXCL9 and CXCL10 protein expression in skin tumors at day 10 after TMZ treatment. (F) MFI quantification of CXCL9 and CXCL10 staining in skin tumors at day 10 after TMZ treatment. Data from panels: (A and D) are pooled from 3-5 mice per group; (B) are pooled from 2 separate experiments with 3-4 mice per group in each experiment (n = 6-8/group). Data from (F) are from 4-6 mice per group. Bars represent mean ± SD. Statistical analyses were performed using one-way ANOVA test with Bonferroni's post-test analysis in (A and D) and the unpaired two-tailed Student's t-test in (B and F); *p<0.05, **p<0.01. Images from (C and E) are representative of 5 independent experiments (n = 5 in each group) and scale bars in represent 200 μm.
Figure 5
Figure 5
(See previous page). Matrix architecture of GU and skin tumor stroma is characterized by distinct patterns of collagen deposition. Genitourinary (GU) and cutaneous tumors from RETAAD mice were examined for differences in stromal and matrix composition by immunostaining and fluorescence cytometry (A-C) and high-resolution 2-photon microscopy (D-E). (A) Representative dot plots showing flow cytometry gating strategy for CD45 CD31+ endothelial cells and CD45 CD31 PDGFRα+ tumor-associated fibroblasts (TAFs). Flow cytometry analysis was performed to quantify (B) CD45 CD31+ endothelial cells and (C) CD45 CD31 PDGFRα+ TAFs present in GU and skin tumors. (D) High-resolution images of collagen fibres within the GU and skin tumor stroma were generated by second harmonic generation (SHG) using a 2-photon microscope (E) Immunofluorescence imaging were performed to examine T cells interactions with the GU tumor stroma. Data from panels: (B and C) are pooled from 2 separate experiments with 4-5 mice per group in each experiment (n = 9-15/group). Bars represent mean ± SD. Statistical analyses were performed using the unpaired two-tailed Student's t-test; **p<0.01. Images from (D and E) are representative of 5 independent experiments (n = 5/group). Scale bars in (D) and (E) represent 75 μm and 50 μm, respectively.
Figure 6.
Figure 6.
Chemokine presentation on GU tumor stroma differs from that in skin tumor stroma. Genitourinary (GU) and cutaneous tumor-bearing RETAAD mice were treated with Temazolomide (TMZ) or dimethyl sulfoxide (DMSO) vehicle. (A) Flow cytometry analysis to evaluate intracellular CXCL9 and CXCL10 expression by GU and skin tumor-associated fibroblasts (TAFs) at day 10 after DMSO or TMZ treatment. (B) Flow cytometry assessment of CXCL9 and CXCL10 expression by TAFs from skin and GU tumors after DMSO or TMZ treatment. (C) High magnification immunofluorescence images were obtained to examine CXCL9 and CXCL10 protein expression on GU and skin tumor stroma. Data from (A) and (B) are representative of and pooled from 2 separate experiments with 3 mice per group in each experiment (n = 6/group). Images from (C) are representative of 5 independent experiments (n = 5/group). Scale bars in (C) represent 50 μm.
Figure 7.
Figure 7.
Combined treatment of RETAAD skin tumors with topical collagenase and systemic TMZ induces T cell infiltration. Cutaneous tumor-bearing RETAAD mice were treated with Temazolomide (TMZ) or dimethyl sulfoxide (DMSO) vehicle with or without topical collagenase. (A) Flow cytometry analysis of tumor-associated fibroblasts (TAFs) in control and collagenase-treated RETAAD skin tumors. (B) 2-photon high-resolution microscopic images of collagen fibres in skin tumor stroma following collagenase treatment. (C) High magnification images to examine CXCL9 and CXCL10 expression on skin tumor stroma from mice treated with collagenase only, TMZ only or collagenase plus TMZ. (D) Flow cytometry analysis for T cells in skin tumors from RETAAD mice treated with collagenase only, TMZ only or collagenase plus TMZ. Data from panel: (A) are derived from non-treated and collagenase-treated skin tumors pooled from 4 mice per group; (D) are from skin tumors pooled from 4 mice per treatment group. Bars represent mean ± SD. Statistical analyses were performed using the paired two-tailed Student's t-test for (A) and the one-way ANOVA test with Bonferroni's post-test analysis for (D); **p<0.01. Images from (B and C) are representative of 4 independent experiments (n = 4/group). Scale bars in (B) and (C) represent 75 μm and 50 μm, respectively.
Figure 8.
Figure 8.
T cells accumulating in GU tumors following TMZ treatment exhibit Th1 effector and cytolytic T cell phenotypes. Genitourinary (GU) tumor-bearing RETAAD mice were treated with Temazolomide (TMZ) or dimethyl sulfoxide (DMSO) vehicle. (A) qRT-PCR analysis of gene expression of interferon γ (INFγ) and T-box 21 (Tbx21/T-bet) in GU tumors following TMZ treatment. (B) Representative dot plots showing intracellular cytokine labelling for IFNγ. To determine frequency of CXCR3+ IFN-γ-producing T cells within tumors, tumor cell suspensions were incubated with Brefeldin A for 4 h before intracellular cytokine labelling for IFNγ was performed. (C) Flow cytometry quantification to examine abundance of CXCR3+ IFNγ-producing T cells in GU tumors from TMZ-treated and control mice. (D) Representative dot plots showing intracellular cytokine labelling for IFNγ after an overnight stimulation with anti-CD3 and anti-CD28 antibodies. (E) Flow cytometry quantification to examine abundance of IFNγ-producing T cells in GU tumors from TMZ-treated and control mice. (F) Representative dot plots showing intracellular cytokine labelling for granzyme B after an overnight stimulation with anti-CD3 and anti-CD28 antibodies. (G) Flow cytometry quantification to examine abundance of granzyme B-producing T cells in GU tumors from TMZ-treated and control mice. Data from panels (A) are pooled from 3-5 mice per group; data from (C, E and G) are pooled from 2 separate experiments with 3-5 mice per group in each experiment (n = 6-8/group). Bars represent mean ± SD.. Statistical analyses were performed using one-way ANOVA test with Bonferroni's post-test analysis in (A) and the unpaired two-tailed Student's t-test in (C, E and G); *p<0.05, **p<0.01.
Figure 9.
Figure 9.
TMZ-induced T cell infiltration inhibits tumor growth. C57/BL6 wild type (WT) and Cxcr3−/− mice were injected subcutaneously in each flank with 106 Melan-ret cells and treated with either 2 mg Temozolomide (TMZ) or vehicle [dimethyl sulfoxide (DMSO)] daily for 3 days once tumors became palpable. (A) Growth kinetics of transplanted Melan-ret tumors in WT or Cxcr3−/− mice treated with DMSO or TMZ. (B) Frequency of tumor cell death measured by the proportion of Annexin+ AQUA+ CD45 tumor cells and quantified by flow cytometry analysis. Data from panel (A) are pooled from 8-10 mice per group and data from (B) are pooled from 5 mice per group. Bars represent mean ± SD. Statistical analyses were performed using one-way ANOVA test with Bonferroni's post-test analysis; *p<0.05, **: p<0.01.

Similar articles

Cited by

References

    1. Pages F, Galon J, Dieu-Nosjean MC, Tartour E, Sautes-Fridman C, Fridman WH. Immune infiltration in human tumors: a prognostic factor that should not be ignored. Oncogene. 2010;29(8):1093-102. - PubMed
    1. Galon J, Costes A, Sanchez-Cabo F, Kirilovsky A, Mlecnik B, Lagorce-Pages C, et al. . Type, density, and location of immune cells within human colorectal tumors predict clinical outcome. Science. 2006;313(5795):1960-4. - PubMed
    1. Sato E, Olson SH, Ahn J, Bundy B, Nishikawa H, Qian F, et al. . Intraepithelial CD8 +tumor-infiltrating lymphocytes and a high CD8+/regulatory T cell ratio are associated with favorable prognosis in ovarian cancer. Proc Natl Acad Sci U S A. 2005;102(51):18538-43. - PMC - PubMed
    1. Erdag G, Schaefer JT, Smolkin ME, Deacon DH, Shea SM, Dengel LT, et al. . Immunotype and immunohistologic characteristics of tumor-infiltrating immune cells are associated with clinical outcome in metastatic melanoma. Cancer Res. 2012;72(5):1070-80. - PMC - PubMed
    1. Clemente CG, Mihm MC, Jr., Bufalino R, Zurrida S, Collini P, Cascinelli N. Prognostic value of tumor infiltrating lymphocytes in the vertical growth phase of primary cutaneous melanoma. Cancer. 1996;77(7):1303-10. - PubMed