. 2015 May 7;10(5):e0126373.
doi: 10.1371/journal.pone.0126373. eCollection 2015.

Random versus Game Trail-Based Camera Trap Placement Strategy for Monitoring Terrestrial Mammal Communities

Affiliations

Random versus Game Trail-Based Camera Trap Placement Strategy for Monitoring Terrestrial Mammal Communities

Jeremy J Cusack et al. PLoS One. .

Abstract

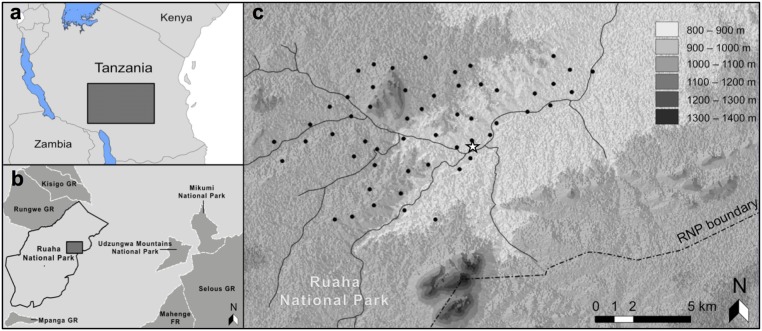
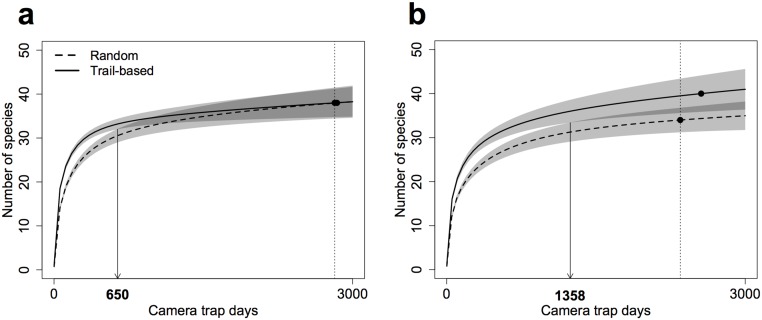
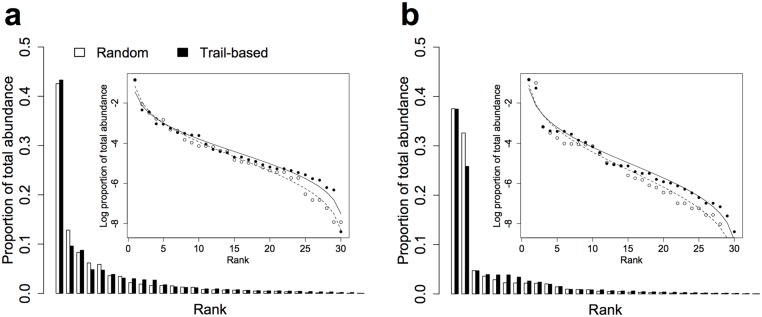
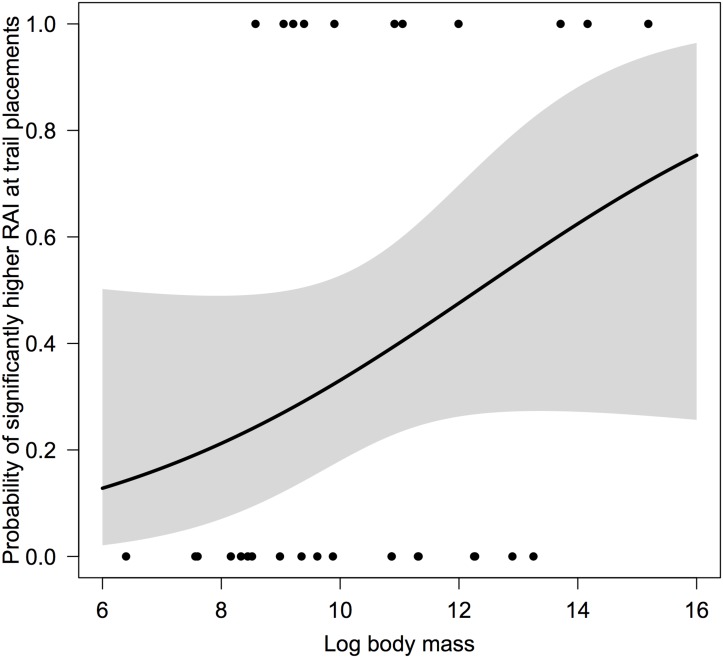
Camera trap surveys exclusively targeting features of the landscape that increase the probability of photographing one or several focal species are commonly used to draw inferences on the richness, composition and structure of entire mammal communities. However, these studies ignore expected biases in species detection arising from sampling only a limited set of potential habitat features. In this study, we test the influence of camera trap placement strategy on community-level inferences by carrying out two spatially and temporally concurrent surveys of medium to large terrestrial mammal species within Tanzania's Ruaha National Park, employing either strictly game trail-based or strictly random camera placements. We compared the richness, composition and structure of the two observed communities, and evaluated what makes a species significantly more likely to be caught at trail placements. Observed communities differed marginally in their richness and composition, although differences were more noticeable during the wet season and for low levels of sampling effort. Lognormal models provided the best fit to rank abundance distributions describing the structure of all observed communities, regardless of survey type or season. Despite this, carnivore species were more likely to be detected at trail placements relative to random ones during the dry season, as were larger bodied species during the wet season. Our findings suggest that, given adequate sampling effort (> 1400 camera trap nights), placement strategy is unlikely to affect inferences made at the community level. However, surveys should consider more carefully their choice of placement strategy when targeting specific taxonomic or trophic groups.


Conflict of interest statement

Competing Interests: The Ruaha Carnivore Project, via Dr. Amy Dickman, received funding from a commercial source (SeaWorld Busch Gardens). This does not alter the authors' adherence to PLOS ONE policies on sharing data and materials.

Figures

Fig 1
Fig 1. Location of random camera placements within Ruaha National Park, southern Tanzania.
Insets (a) and (b) show the location of Ruaha National Park (RNP) in Southern Tanzania and that of the study area on the eastern side of RNP. In (c), solid black lines symbolise the river system present around the study area and the white star marks the location of RNP headquarters. Trail-based camera placements were chosen within 50 m of the random placements (back dots).
Fig 2
Fig 2. Sample-based species accumulation curves describing the medium to large mammal community richness in the study area during the (a) dry and (b) wet season.
Shaded polygons denote the 95% confidence intervals drawn from 200 randomisations performed with replacement and based on the unconditional variance. Confidence interval overlap is shown in a darker shade of grey. For each season, curves were compared at sampling efforts symbolised by the dotted vertical lines. Downward pointing arrows and bold numbers on the x-axis mark the level of effort at which the richness of observed communities could not be considered as significantly different.
Fig 3
Fig 3. Rank abundance distributions and lognormal model fits (inset plots) for the (a) dry and (b) wet season.
A set of 30 species was considered in order to facilitate comparison, with ranks based on RAIs measured at the survey level. Species are ranked from 1 to 30 on the x-axis according to decreasing proportion of total abundance.
Fig 4
Fig 4. Influence of log body mass on the probability for a species to be caught significantly more often at trail placements during the wet season.
The shaded polygon represents the 95% confidence interval surrounding the regression line and black dots represent the species-specific binomial responses used in the generalised linear model.

References

    1. Ahumada JA, Silva CE, Gajapersad K, Hallam C, Hurtado J, Martin E, et al. (2011) Community structure and diversity of tropical forest mammals: data from a global camera trap network. Philosophical Transactions of the Royal Society B: Biological Sciences 366: 2703–2711. - PMC - PubMed
    1. Rovero F, Martin E, Rosa M, Ahumada JA, Spitale D (2014) Estimating species richness and modelling habitat preferences of tropical forest mammals from camera trap data. PloS ONE 9: e103300 10.1371/journal.pone.0103300 - DOI - PMC - PubMed
    1. Tobler MW, Carillo-Percastegui SE, Leite Pitman R, Mares R, Powell G (2008) An evaluation of camera traps for inventorying large- and medium-sized terrestrial rainforest mammals. Animal Conservation 11: 169–178.
    1. Ahumada JA, Hurtado J, Lizcano D (2013) Monitoring the status and trends of tropical forest terrestrial vertebrate communities from camera trap data: a tool for conservation. PloS ONE 8(9): e73707 10.1371/journal.pone.0073707 - DOI - PMC - PubMed
    1. Jones JP (2011) Monitoring species abundance and distribution at the landscape scale. Journal of Applied Ecology 48: 9–13.

Publication types