. 2015 May 7;6(5):e1739.
doi: 10.1038/cddis.2015.113.

Impairment of enzymatic antioxidant defenses is associated with bilirubin-induced neuronal cell death in the cerebellum of Ugt1 KO mice

Affiliations

Impairment of enzymatic antioxidant defenses is associated with bilirubin-induced neuronal cell death in the cerebellum of Ugt1 KO mice

G Bortolussi et al. Cell Death Dis. .

Abstract

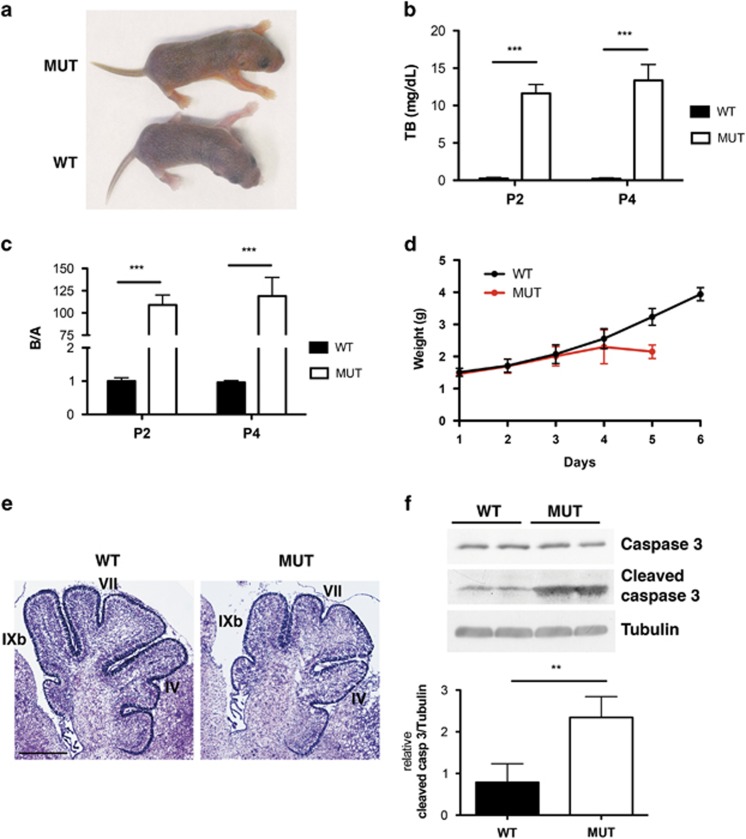
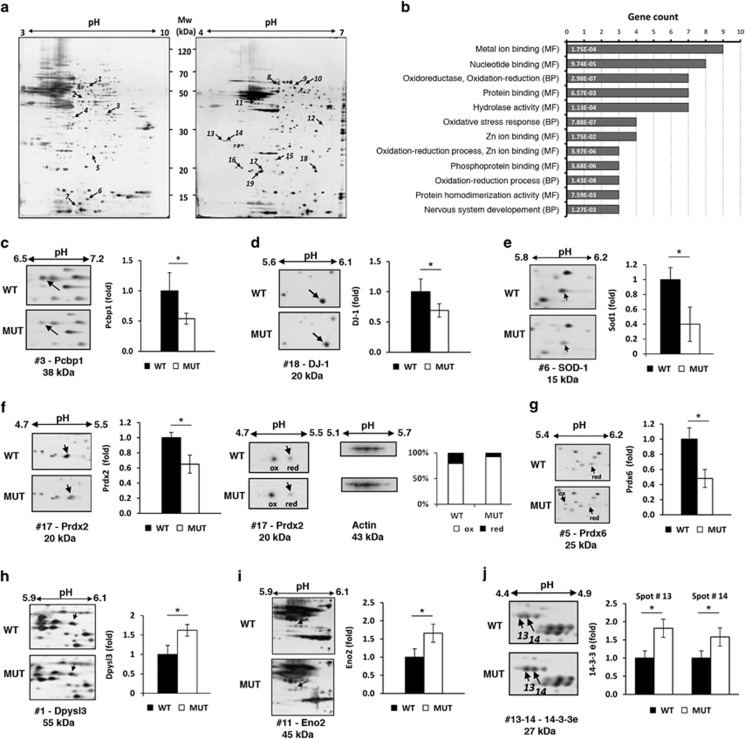
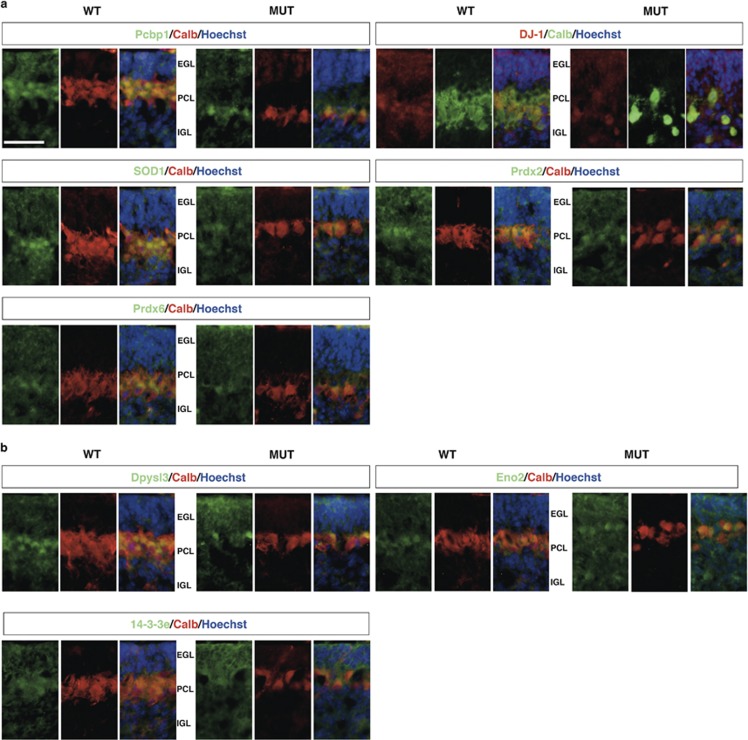
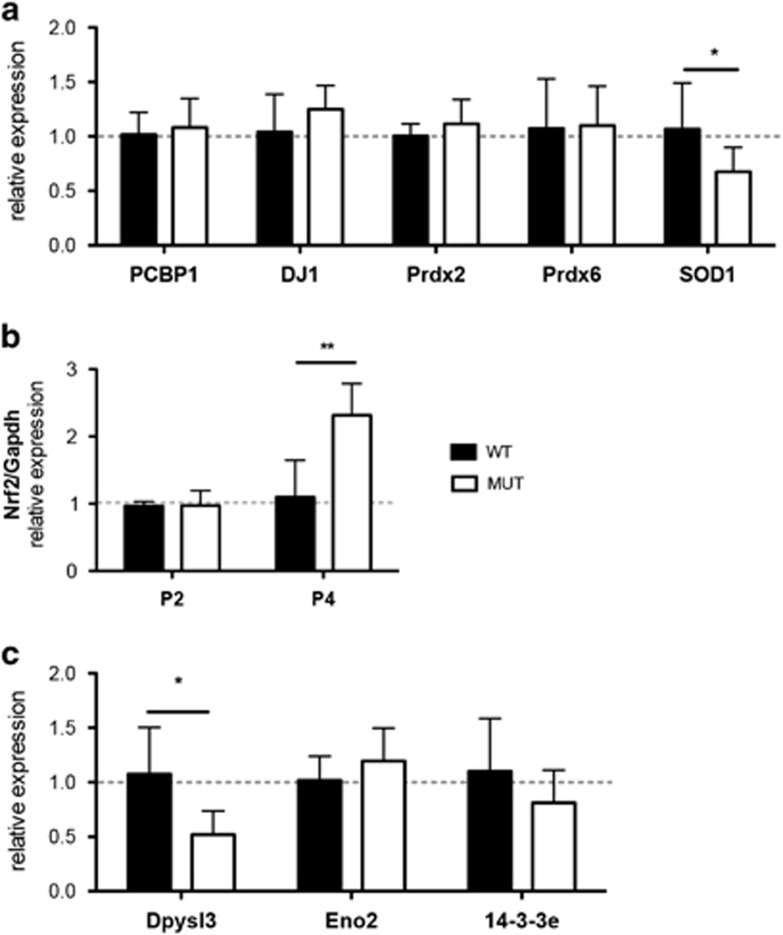
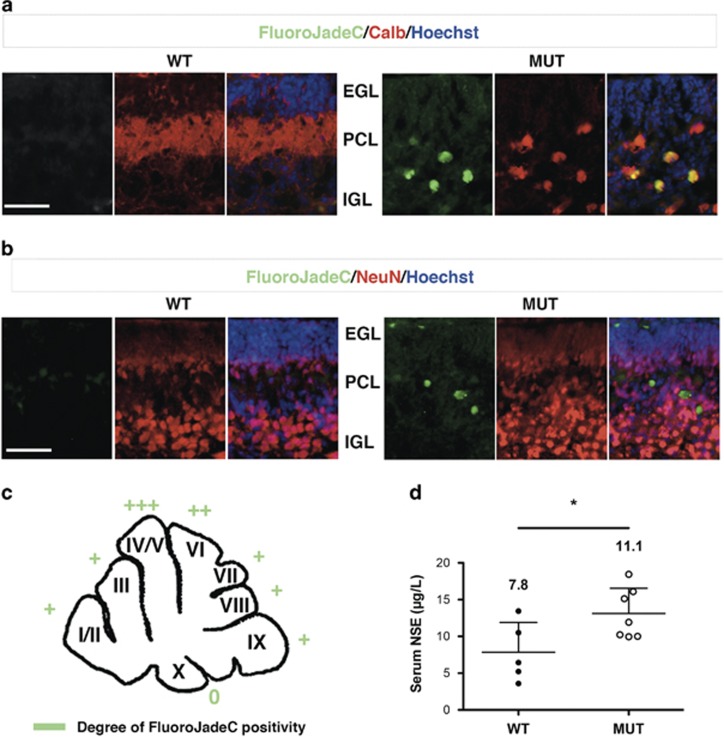
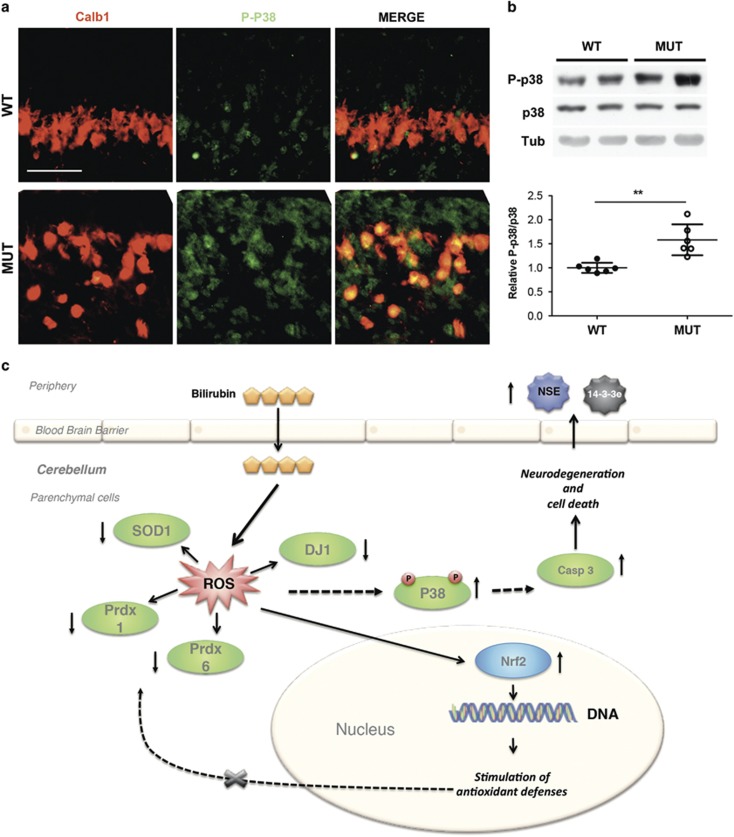
Severe hyperbilirubinemia is toxic during central nervous system development. Prolonged and uncontrolled high levels of unconjugated bilirubin lead to bilirubin-induced encephalopathy and eventually death by kernicterus. Despite extensive studies, the molecular and cellular mechanisms of bilirubin toxicity are still poorly defined. To fill this gap, we investigated the molecular processes underlying neuronal injury in a mouse model of severe neonatal jaundice, which develops hyperbilirubinemia as a consequence of a null mutation in the Ugt1 gene. These mutant mice show cerebellar abnormalities and hypoplasia, neuronal cell death and die shortly after birth because of bilirubin neurotoxicity. To identify protein changes associated with bilirubin-induced cell death, we performed proteomic analysis of cerebella from Ugt1 mutant and wild-type mice. Proteomic data pointed-out to oxidoreductase activities or antioxidant processes as important intracellular mechanisms altered during bilirubin-induced neurotoxicity. In particular, they revealed that down-representation of DJ-1, superoxide dismutase, peroxiredoxins 2 and 6 was associated with hyperbilirubinemia in the cerebellum of mutant mice. Interestingly, the reduction in protein levels seems to result from post-translational mechanisms because we did not detect significant quantitative differences in the corresponding mRNAs. We also observed an increase in neuro-specific enolase 2 both in the cerebellum and in the serum of mutant mice, supporting its potential use as a biomarker of bilirubin-induced neurological damage. In conclusion, our data show that different protective mechanisms fail to contrast oxidative burst in bilirubin-affected brain regions, ultimately leading to neurodegeneration.


Figures

Figure 1
Figure 1
Ugt1 KO mutant mice phenotype and neurological damage. (a) As a consequence of Ugt1a inactivation, the mutant pup (top) appears jaundiced compared with its WT littermate (bottom). (b) Total plasma bilirubin levels were determined at post natal days 2 and 4 in WT and mutant mice (n≥4 time per genotype). Values represent the mean±S.D. (mg/dl). Two-way ANOVA, ***P<0.001. Interaction time genotype, NS; genotype, ***P<0.001; time, NS. (c) Bilirubin/albumin ratios were determined at P2 and P4 in WT and mutant mice (n≥4 time/genotype). Values represent the mean±S.D. of the calculated molar ratio between bilirubin and albumin. Two-way ANOVA, ***P<0.001. Interaction time genotype, NS; genotype, ***P<0.001; time, NS. (d) Weight curve of WT (black line, n=7) and mutant mice (red line, n=7). (e) Nissl staining of 4-day-old (P4) WT and mutant mice. IV, VII and IXb indicate the cerebellar fissures. Scale bar: 200 μm. (f) Western blot analysis (top panels) of cerebellar protein extracts from P4 WT and untreated mutant mice, with anti-caspase-3 and anti-cleaved caspase-3 antibodies. Tubulin was used as loading control. Lower panel shows the densitometric quantification of WB analysis (n=4 genotype), results are expressed as the mean±S.D. of cleaved caspase-3/tubulin relative ratio
Figure 2
Figure 2
Changes in expression levels of selected proteins identified by proteomic analysis. (a) Representative proteomic maps of mutant mice cerebella. Mixture of cerebellar proteins were separated by 2-DE using two immobilized pH gradients, pH 3–10 (left) and pH 4–7 (right), 13-cm in length. Protein patterns were visualized by ammoniacal silver staining. Vertical and horizontal axes indicate apparent molecular mass and pI values, respectively. Differentially represented protein spots in the mutant mice are highlighted; numbering in Figure corresponds to numbering in Tables 1 and 2. These spots were subjected to nLC-ESI-LIT-MS/MS analysis for protein identification. (b) Functional clustering of the identified proteins. Functional enrichment analysis of the protein species identified by proteomic analysis according to molecular function (MF) and biological process (BP) is shown. GeneCodis analysis of the differentially represented proteins was performed. For simplicity, only the most representative functional categories are represented. The number of genes for each category is provided on horizontal axis and list only the first 13 co-occurrence terms. Statistical significance belonging to each category is shown within each bar. See Supplementary Table S2 in Supplementary Material for the full list of annotations. (c–j) Representative gel regions of 2-DE gels stained by ammoniacal silver were cropped. Protein variation in Ugt1 mutant mice (MUT) with respect to control (WT) are reported in the histograms. Histograms represent the normalized volume values of each spot of interests as obtained from four independent replicas. Data are the mean±S.D. of four independent experiments. Black boxes represent protein-normalized expression in the control (WT) mice cerebella, whereas white boxes represent the counterpart in the mutant mice cerebella. For Prdx2 (panel f), the histogram corresponding to the western blot analysis represents the relative amount of each forms (reduced or oxidized) expressed as percentage of the total amount of protein. Statistical significance is indicated by an asterisk, P<0.05
Figure 3
Figure 3
Immunohistochemical analysis of the candidate proteins. Representative fluorescent immunohistochemistry of cerebellar sections from WT and mutant mice using specific antibodies (green/red) and Hoechst (blue) to mark nuclei. (a) Down-represented proteins; (b) over-represented proteins. Calbindin antibody was used to detect PCs. Scale bar: 50 μm. IGL, internal granular layer; EGL, external germinal layer; PCL, Purkinje cell layer
Figure 4
Figure 4
Relative expression of mRNA as assessed by qRT-PCR. (a) Candidate proteins down-represented in 2-DE, were validated at the mRNA level. WT levels were considered as one. Results are expressed as the mean±S.D. t-test *P<0.05. (b) Expression levels of NF-E2-related factor 2 (Nrf2) at postnatal days 2 and 4 in WT and MUT cerebellar extract. Two-way ANOVA, interaction time genotype *P<0.05; genotype *P<0.05; time **P<0.01. Values represent the mean±S.D. (c) mRNA expression levels of over-represented candidate proteins. Results are expressed as the mean±S.D. t-test *P<0.05
Figure 5
Figure 5
Assessment of bilirubin-induced cell death in the cerebellum at postnatal day 4. (a) Representative fluorescent immunohistochemistry of cerebellar sections from WT and mutant mice using FluoroJadeC (green) to detect degenerating neurons, colocalized with calbindin antibody (red) to highlight PCs. (b) FluoroJadeC staining was performed together with NeuN immunostaining (red) to highlight GNs. Hoechst (blue) was used to mark nuclei. Scale bar: 50 μm. IGL, internal granular layer. (c) Cartoon reporting FluoroJadeC positivity along the entire cerebellum. Values from different sections belonging to the same animal were averaged. Represented values resulted from the average of four sections per mutant animal (four animals). 0, less than one positive cell/fissure analyzed; +, 1–3 cells; ++, 3–5; +++, 5–10. (d) Serum from WT (n=5) and MUT (n=7) mice was collected at P4 and Eno2 was quantified by ELISA test. Each dot represents a single animal. The mean value for each genotype is indicated (mean±S.D.). t-test *P<0.05
Figure 6
Figure 6
Cerebellar bilirubin-induced neurotoxicity in neonatal mice is associated with the activation of P38 pathway. (a) Representative fluorescent immunohistochemistry of cerebellar sections of WT and mutant mice using P-p38 antibody (green), anti-calbindin-1 antibody (red) to mark PCs and Hoechst (blue) to mark nuclei. Scale bar: 50 μm. IGL, internal granular layer. (b) Western blot analysis of total cerebellar protein extracts using anti-P-p38 and -p38 antibodies in WT and MUT mice. Tubulin was used as loading control. Lower panel shows the densitometric quantification of the bands. Error bars S.D. t-test **P<0.01. (c) Model of cerebellar bilirubin-induced neurotoxicity in neonatal mice. Severe hyperbilirubinemia in vivo leads to cerebellar neurodegeneration and neuronal cell death. Despite increasing transcription levels of Nrf2, a key sensor of oxidative stress that regulates gene expression of antioxidant genes, proteins involved in the cellular antioxidant defenses are down-represented in the cerebellum of mutant mice. Increase in p38 MAPK phosphorylation leads to apoptosis, as demonstrated by the activation of caspase-3 and the increase in TUNEL-positive cells., As a consequence of neuronal cell death, neuronal-specific enolase (NSE) is released into the body fluids and then detected in the serum of Ugt1 mutant mice

References

    1. Stocker R, Yamamoto Y, McDonagh AF, Glazer AN, Ames BN. Bilirubin is an antioxidant of possible physiological importance. Science 1987; 235: 1043–1046. - PubMed
    1. Shapiro SM. Bilirubin toxicity in the developing nervous system. Pediatr Neurol 2003; 29: 410–421. - PubMed
    1. Seppen J, Bosma PJ, Goldhoorn BG, Bakker CT, Chowdhury JR, Chowdhury NR et al. Discrimination between Crigler-Najjar type I and II by expression of mutant bilirubin uridine diphosphate-glucuronosyltransferase. J Clin Invest 1994; 94: 2385–2391. - PMC - PubMed
    1. Strauss KA, Robinson DL, Vreman HJ, Puffenberger EG, Hart G, Morton DH. Management of hyperbilirubinemia and prevention of kernicterus in 20 patients with Crigler-Najjar disease. Eur J Pediatr 2006; 165: 306–319. - PubMed
    1. Pett S, Mowat AP. Crigler-Najjar syndrome types I and II. Clinical experience—King's College Hospital 1972-1978. Phenobarbitone, phototherapy and liver transplantation. Mol Aspects Med 1987; 9: 473–482. - PubMed

Publication types

MeSH terms