. 2015 May 7;10(5):e0126702.
doi: 10.1371/journal.pone.0126702. eCollection 2015.

Marked Genetic Differentiation between Western Iberian and Italic Populations of the Olive Fly: Southern France as an Intermediate Area

Affiliations

Marked Genetic Differentiation between Western Iberian and Italic Populations of the Olive Fly: Southern France as an Intermediate Area

Barbara van Asch et al. PLoS One. .

Abstract

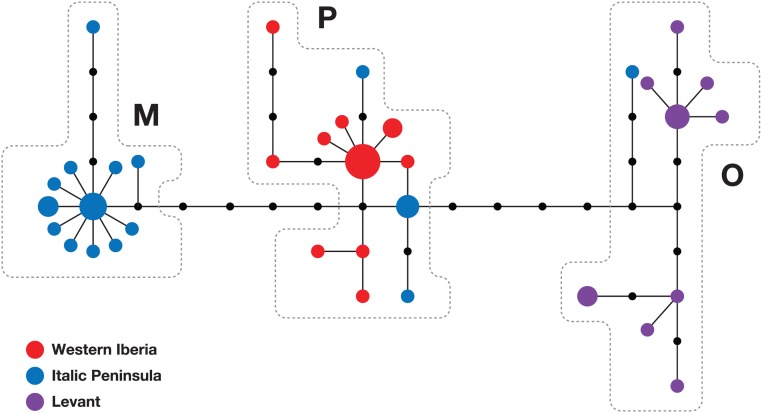
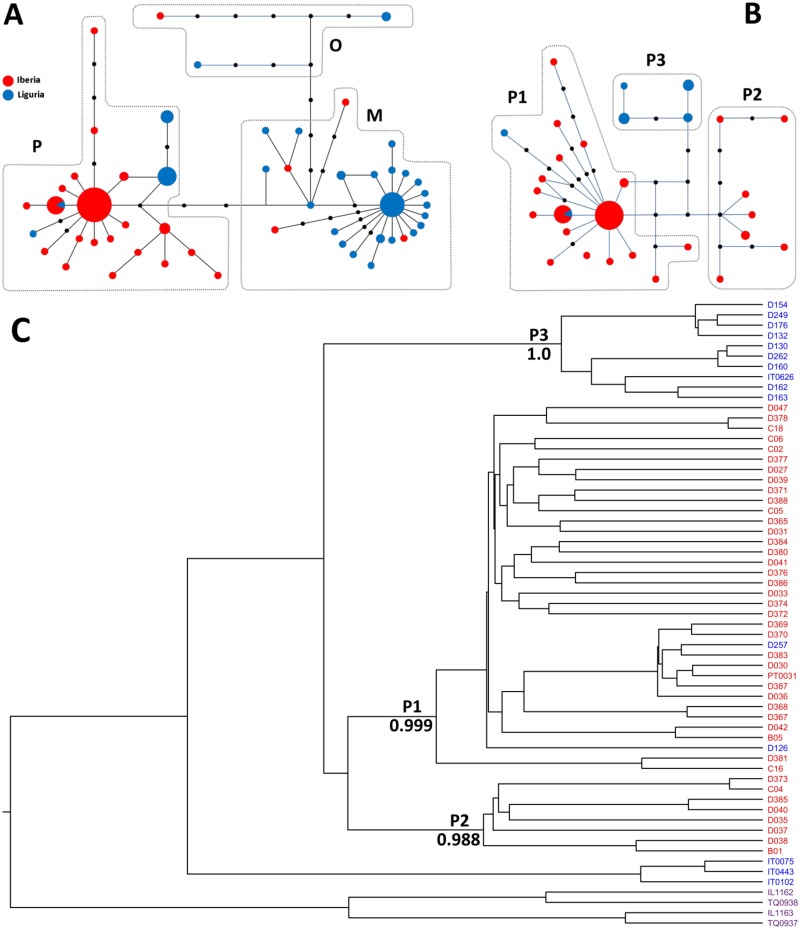
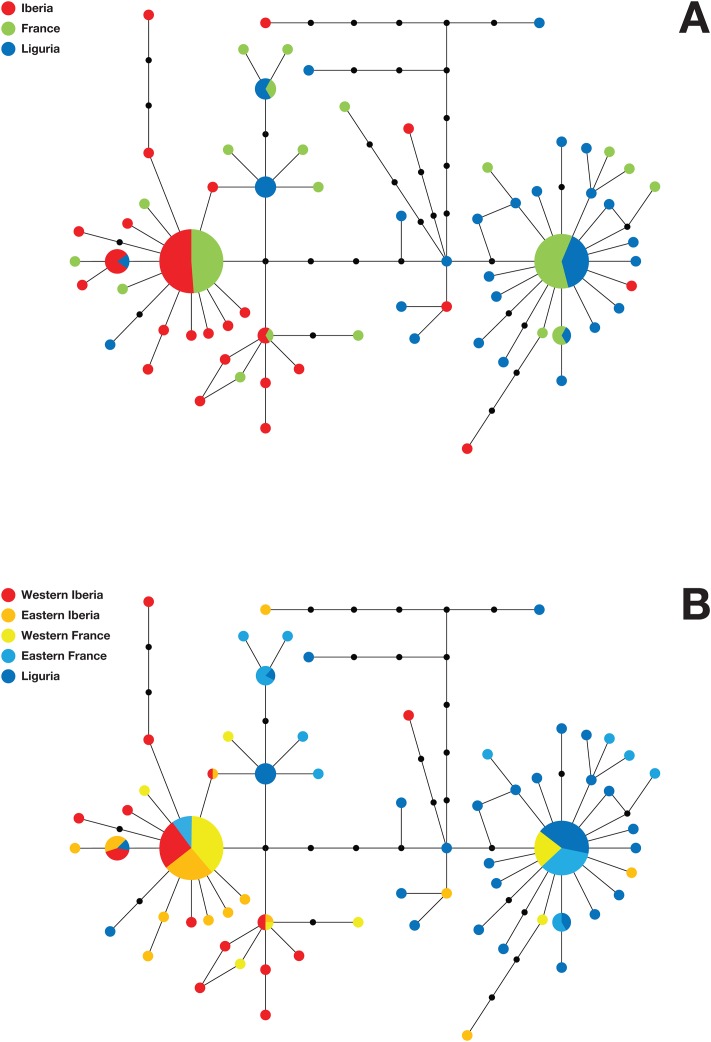
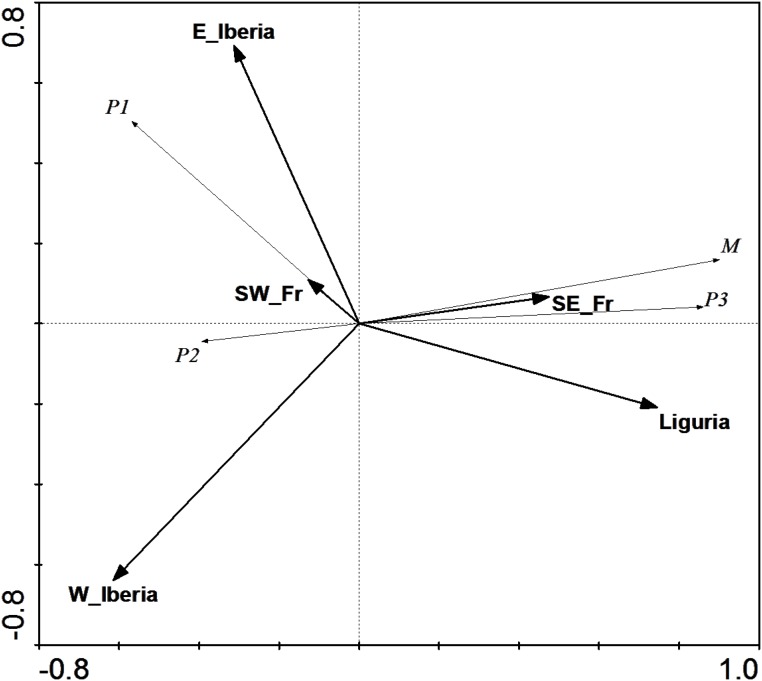
The olive fly, Bactrocera oleae, is the most important pest affecting the olive industry, to which it is estimated to cause average annual losses in excess of one billion dollars. As with other insects with a wide distribution, it is generally accepted that the understanding of B. oleae population structure and dynamics is fundamental for the design and implementation of effective monitoring and control strategies. However, and despite important advances in the past decade, a clear picture of B. oleae's population structure is still lacking. In the Mediterranean basin, where more than 95% of olive production is concentrated, evidence from several studies suggests the existence of three distinct sub-populations, but the geographical limits of their distributions, and the level of interpenetration and gene flow among them remain ill-characterized. Here we use mitochondrial haplotype analysis to show that one of the Mediterranean mitochondrial lineages displays geographically correlated substructure and demonstrate that Italic populations, though markedly distinct from their Iberian and Levantine counterparts are more diverse than previously described. Finally, we show that this distinction does not result from extant hypothetical geographic limits imposed by the Alps or the Pyrenees nor, more generally, does it result from any sharp boundary, as intermixing is observed in a broad area, albeit at variable levels. Instead, Bayesian phylogeographic analysis suggests the interplay between isolation-mediated differentiation during glacial periods and bi-directional dispersal and population intermixing in the interglacials has played a major role in shaping current olive fly population structure.


Conflict of interest statement

Competing Interests: The authors have declared that no competing interests exist.

Figures

Fig 1
Fig 1. Olive fly mtDNA diversity in the Italic peninsula, Western Iberia and the Levant.
Median-joining phylogenetic network of B. oleae mtDNA haplotypes found in 18 samples from Western Iberia (red), 27 from the Italic peninsula (blue) and 14 from the Levant (purple). Circles represent haplotypes, black circles represent unobserved intermediate haplotypes, the length of the connections is proportional to the number of mutational steps that separate the haplotypes, and the size of the circles is proportional to the frequency of the haplotype.
Fig 2
Fig 2. The P mtDNA lineage displays phylogeographically-correlated substructure.
A) and B) Median-joining phylogenetic networks of B. oleae mtDNA haplotypes found in Iberia (red) and Liguria (blue) constructed using (A) two mtDNA segments (1,826 bp) or (B) four mtDNA segments (3,051 bp) of haplotypes belonging to the P lineage. Circles represent haplotypes, black circles represent unobserved intermediate haplotypes, the length of the connections is proportional to the number of mutational steps that separate the haplotypes, and the size of the circles is proportional to the frequency of the haplotype. C) Maximum clade credibility phylogenies for B. oleae mtDNA haplotypes found in Iberia (red), Italy (blue) and the Levant (purple) obtained using four mtDNA segments (3,051 bp).
Fig 3
Fig 3. Geographic structure of olive fly population transition between Northwestern Italy and Western Iberia.
Median-joining phylogenetic networks comparing B. oleae mtDNA haplotype distributions in Iberia, France and Liguria. A) Iberia (red), France (green), and Liguria (blue); B) Western Iberia (red), Eastern Iberia (orange), Western France (yellow), Eastern France (light Blue), and Liguria (blue). Circles represent haplotypes, black circles represent unobserved intermediate haplotypes, the length of the connections is proportional to the number of mutational steps that separate the haplotypes, and the size of the circles is proportional to the frequency of the haplotype.
Fig 4
Fig 4. Redundancy analysis (RDA) with sampling regions as explanatory variables.
RDA of olive fly mitochondrial haplotype distributions using lineage frequencies as response variables and sampling regions as explanatory variables. These explained 68.4% of the lineage distribution variability (Monte Carlo test, P<0.005). W_Iberia—Western Iberia; E_Iberia—Eastern Iberia; SW_Fr—Southwestern France; SE_Fr—Southeastern France.
Fig 5
Fig 5. Redundancy analysis (RDA) with geographic coordinates as explanatory variables.
RDA of olive fly mitochondrial haplotype distributions using latitude (Lat) and longitude (Long) as explanatory variables and lineage frequencies as response variables. Longitude alone explained 52.0% of lineage distribution variability (Monte Carlo test, P<0.005).
Fig 6
Fig 6. Bayesian phylogeographic analysis using the full sample set suggests both eastward and westward ancient olive fly dispersal in the Mediterranean basin.
Maximum clade credibility phylogenies for olive fly partial mtDNA. Numbers indicate ages (in thousands of years BP) and probabilities of location (in percentage) for key, well-supported (posterior >0.95) nodes (including MRCAs of several clades). Bars represent confidence intervals (95% HPD) for ages. Red—Iberia, Green—France, Blue—Italy, Purple—Levant. The last two glacial periods are indicated by light blue bars.
Fig 7
Fig 7. Bayesian phylogeographic analysis restricted to Iberian and Italian samples suggests both eastward and westward ancient olive fly dispersal in the Mediterranean basin.
Maximum clade credibility phylogenies for olive fly partial mtDNA. Numbers indicate probabilities of location (in percentage) for key, well-supported (posterior >0.95) nodes (including MRCAs of several clades). Bars represent confidence intervals (95% HPD) for ages. Red—Iberia, Blue—Italy.

Similar articles

Cited by

References

    1. Rice R, Phillips P, Stewart-Leslie J, Sibbett G. Olive fruit fly populations measured in Central and Southern California. Calif Agr 2003;57(4):122–7. 10.3733/ca.v057n04p122 - DOI
    1. Haniotakis GE. Olive pest control: present status and prospects. IOBC/WPRS Bulletins. 2005;28(9):1–9.
    1. Montiel Bueno A, Jones O. Alternative methods for controlling the olive fly, Bactrocera oleae, involving semiochemicals. IOBC/WPRS Bulletin. 2002;25(9):147–56.
    1. Daane KM, Johnson MW. Olive fruit fly: managing an ancient pest in modern times. Annu Rev Entomol. 2010;55:151–69. 10.1146/annurev.ento.54.110807.090553 . - DOI - PubMed
    1. Segura MD, Callejas C, Ochando MD. Bactrocera oleae: a single large population in Northern Mediterranean basin. J Appl Ent. 2008;(132):706–13. 10.1111/j.1439-0418.2008.01366.x - DOI

Publication types

Substances