. 2015 Aug;144(2):133-46.
doi: 10.1007/s00418-015-1326-2. Epub 2015 May 8.

Multispectral imaging reveals the tissue distribution of tetraspanins in human lymphoid organs

Affiliations

Multispectral imaging reveals the tissue distribution of tetraspanins in human lymphoid organs

Charlotte M de Winde et al. Histochem Cell Biol. 2015 Aug.

Abstract

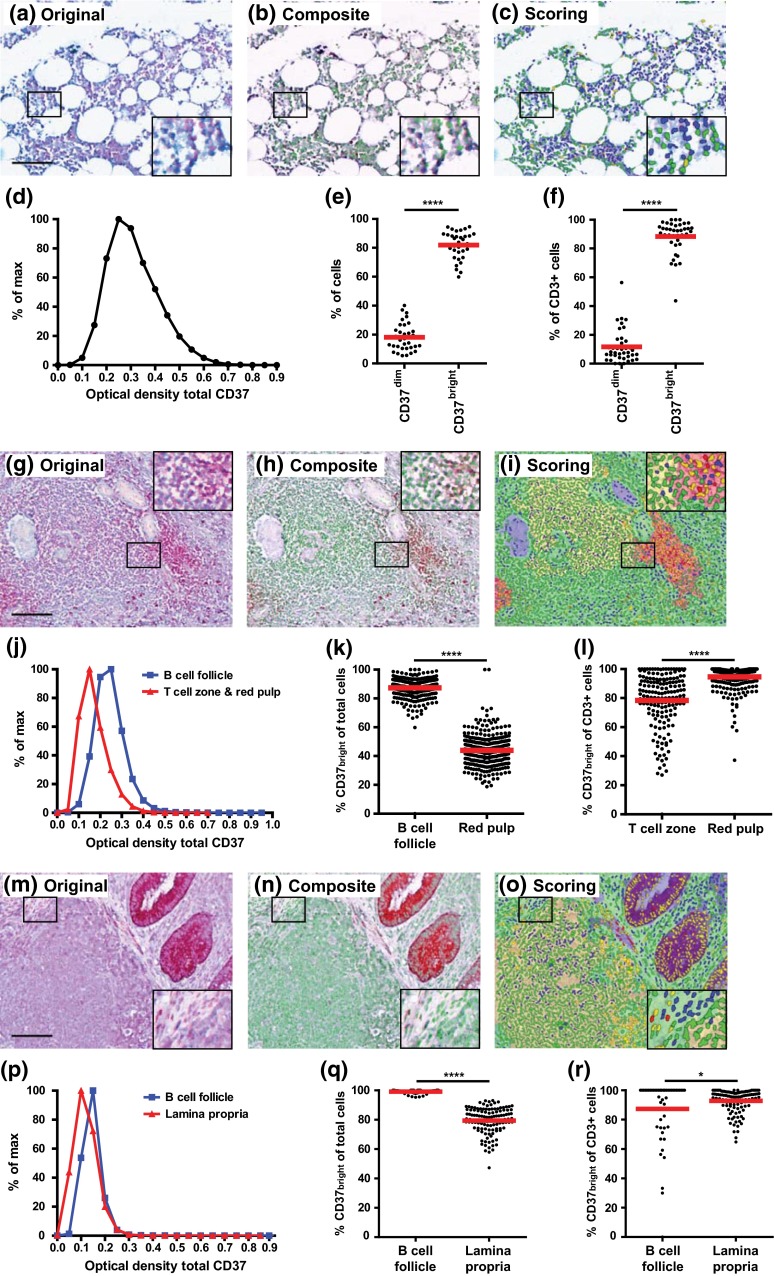
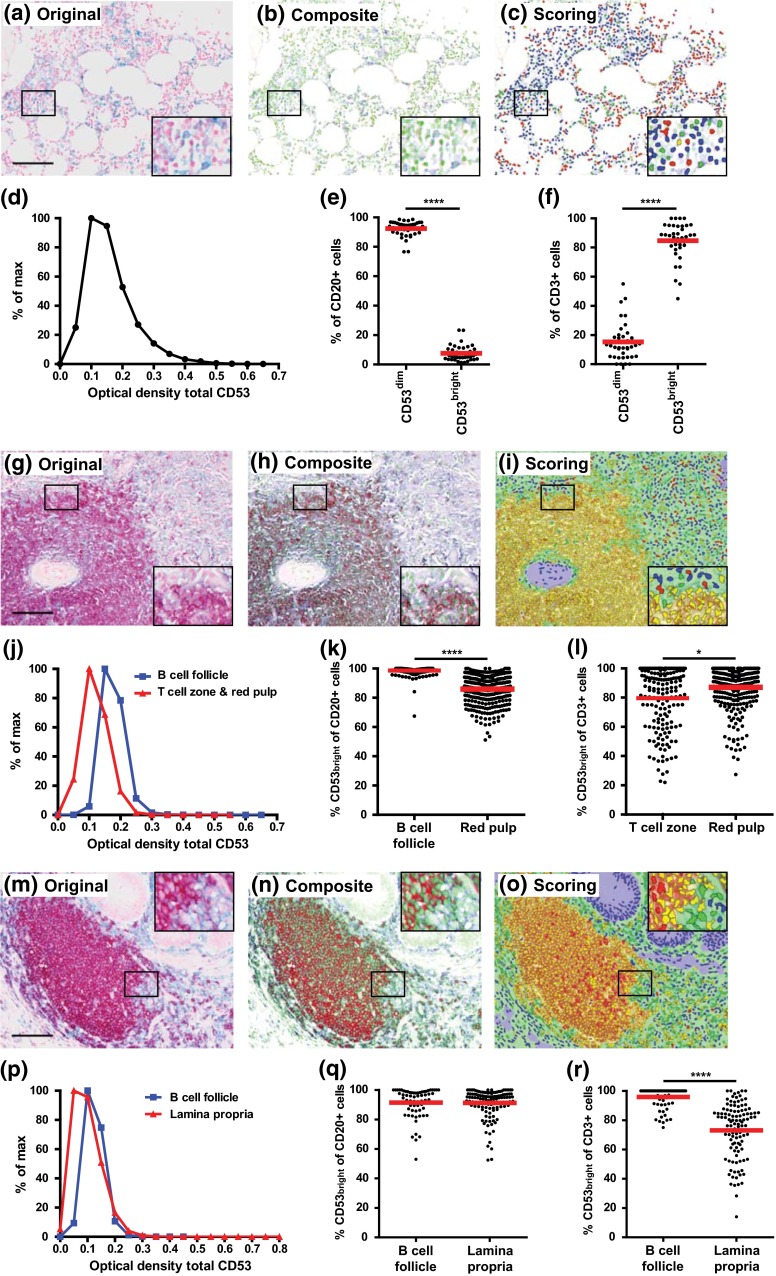
Multispectral imaging is a novel microscopy technique that combines imaging with spectroscopy to obtain both quantitative expression data and tissue distribution of different cellular markers. Tetraspanins CD37 and CD53 are four-transmembrane proteins involved in cellular and humoral immune responses. However, comprehensive immunohistochemical analyses of CD37 and CD53 in human lymphoid organs have not been performed so far. We investigated CD37 and CD53 protein expression on primary human immune cell subsets in blood and in primary and secondary lymphoid organs. Both tetraspanins were prominently expressed on antigen-presenting cells, with highest expression of CD37 on B lymphocytes. Analysis of subcellular distribution showed presence of both tetraspanins on the plasma membrane and on endosomes. In addition, CD53 was also present on lysosomes. Quantitative analysis of expression and localization of CD37 and CD53 on lymphocytes within lymphoid tissues by multispectral imaging revealed high expression of both tetraspanins on CD20(+) cells in B cell follicles in human spleen and appendix. CD3(+) T cells within splenic T cell zones expressed lower levels of CD37 and CD53 compared to T cells in the red pulp of human spleen. B cells in human bone marrow highly expressed CD37, whereas the expression of CD53 was low. In conclusion, we demonstrate differential expression of CD37 and CD53 on primary human immune cells, their subcellular localization and their quantitative distribution in human lymphoid organs. This study provides a solid basis for better insight into the function of tetraspanins in the human immune response.


Figures

Fig. 1
Fig. 1
Expression of CD37 and CD53 on immune cell subsets in blood. a Flow cytometry analysis of expression of CD37 or CD53 (black line) on CD4 and CD8 T cells, B cells, monocytes and NK cells versus isotype control (gray line). Gating strategy is presented in Supplementary Figure 1. Expression levels of CD37 (b) and CD53 (c) were normalized for isotype staining by background subtraction. Experiments were performed with PBLs from three healthy donors. Data present mean ± SD. d Flow cytometry analysis of expression of CD37 or CD53 (black line) on mDCs (BDCA1+CD19) or pDCs (BDCA2+) versus isotype control (gray line). Expression levels of CD37 (e) and CD53 (f) were normalized for isotype staining by background subtraction. Experiments were performed with PBLs from two healthy donors. Data present mean ± SD
Fig. 2
Fig. 2
Subcellular localization of CD37 and CD53. Localization of a CD37 or b CD53 (green) in monocytes was studied by dual staining with calreticulin (ER), syntaxin 13 (endosomes) or Lamp1 (lysosomes) (red). Merge: co-localization in yellow (white arrows). Scale bar 5 μm
Fig. 3
Fig. 3
Expression of CD37 and CD53 on human spleen. a Original multispectral image of human spleen stained for CD37 (Alexa488), CD53 (Alexa568) and cell nuclei (DAPI). Scale bar 100 μm. Composite RGB image (b) of unmixed CD37 (c in green), CD53 (d in red) and DAPI (e in blue) signal after correction for autofluorescence. One representative image is shown
Fig. 4
Fig. 4
Spectral imaging analysis of human spleen stained for CD20 (Warp Red), CD53 (True Blue) and cell nuclei (Nuclear Red). a A spectral library of three chromogens (Warp Red (red line), True Blue (blue line) and Nuclear Red (green line)) was built in Nuance software using single-stained human spleen tissues. b Representative original multispectral image. Scale bar 100 μm. Composite RGB image (c) of unmixed CD20 (d in red), CD53 (e in blue) and nuclei (f in green in composite RGB image) signal. g Tissue segmentation; B cell follicle (B, yellow), red pulp (RP, green) and other tissue (blood vessels, collagen; blue). h Segmentation of individual cells (green) based on Nuclear Red staining. i Thresholds for Warp Red and True Blue staining were set to score CD20CD53dim (blue), CD20+CD53dim (red), CD20+CD53bright (yellow) or CD20CD53bright (green) cells. j–l Scatter plots showing optical densities for CD20 (Y-axis) and CD53 (X-axis) of individual cells in B cell follicles (j, l blue) and red pulp (k–l red) and thresholds used for scoring (dotted lines). A representative of 2000 cells per tissue region is plotted
Fig. 5
Fig. 5
Spectral imaging analysis of human spleen stained for CD3 (Warp Red), CD37 (True Blue) and cell nuclei (Nuclear Red). a Representative original multispectral image. Scale bar = 100 μm. Composite RGB image (b) of unmixed CD3 (c in red), CD37 (d in blue) and Nuclear Red (e in green in composite RGB image) signal using the spectral library (Fig. 4a). f Tissue segmentation; B cell follicle (B, yellow), T cell zone (T, red), red pulp (RP, green) and other tissue (blood vessels, collagen; blue). g Segmentation of individual cells (green) based on Nuclear Red staining. h Thresholds for Warp Red and True Blue staining were set to score CD3CD37dim (blue), CD3+CD37dim (red), CD3+CD37bright (yellow) or CD3CD37bright (green) cells. i–l Scatter plots showing optical densities for CD3 (Y-axis) and CD37 (X-axis) of individual cells in T cell zones (i, l green), B cell follicles (j, l blue) and red pulp regions (k–l red) and thresholds used for scoring (dotted lines). A representative of 2000 cells per tissue region is plotted
Fig. 6
Fig. 6
Localization and expression of CD37 in bone marrow (a–f), spleen (g–l) and appendix (m–r). a, g, m Representative original multispectral image of lymphoid organ stained for CD3 (Warp Red), CD37 (True Blue) and cell nuclei (Nuclear Red). Scale bars = 100 μm. b, h, n Composite RGB image after spectral unmixing of original image (red CD3, blue CD37, green nuclei). c, i, o Image showing scoring of CD3CD37dim (blue), CD3+CD37dim (red), CD3+CD37bright (yellow) or CD3CD37bright (green) cells. Optical density of CD37 on individual cells in human bone marrow (d), in B cell follicle (blue line) and in T cell zone and in red pulp (red line) in human spleen (j) and in B cell follicle (blue line) and in lamina propria (red line) in human appendix (p). Optical densities were binned per 0.05 and normalized to % of max. Percentage of CD37dim and CD37bright cells in total bone marrow (e) and in the CD3+ cell population in human bone marrow (f). Percentage of total CD37bright cells in B cell follicle and red pulp (k) and in the CD3+ cell population in T cell zone and red pulp (l) in human spleen. Percentage of total CD37bright cells (q) and in the CD3+ cell population (r) in B cell follicle and lamina propria in human appendix. Each dot represents data of one ×20 image from the lymphoid tissue. The red line represents the mean. *P < 0.05, ****P < 0.0001
Fig. 7
Fig. 7
Localization and expression of CD53 in bone marrow (a–f), spleen (g–l) and appendix (m–r). a, g, m Representative original multispectral image of lymphoid organ stained for CD20 (Warp Red), CD53 (True Blue) and cell nuclei (Nuclear Red). Scale bars in a, g, m = 100 μm. b, h, n, Composite RGB image after spectral unmixing of original image (red CD20, blue CD53, green nuclei). c, i, o, Image showing scoring of CD20CD53dim (blue), CD20+CD53dim (red), CD20+CD53bright (yellow) or CD20CD53bright (green) cells. d, j, p, Optical density of CD53 on individual cells in human bone marrow (d), in B cell follicle (blue line) and in T cell zone and in red pulp (red line) in human spleen (j) and in B cell follicle (blue line) and in lamina propria (red line) in human appendix (p). Optical densities were binned per 0.05 and normalized to % of max. Percentage of CD53dim and CD53bright cells in the CD20+ cell population (e) and in the CD3+ cell population (f) in human bone marrow. Percentage of CD53bright cells in the CD20+ cell population in the B cell follicle and red pulp (k), and in the CD3+ cell population in the T cell zone and red pulp (l) in human spleen. Percentage of CD53bright cells in the CD20+ cell population (q) and in the CD3+ cell population (r) in the B cell follicle and lamina propria in human appendix. Each dot represents data of one ×20 image from the lymphoid tissue. The red line represents the mean. *P < 0.05, ****P < 0.0001

References

    1. Barrena S, Almeida J, Yunta M, et al. Aberrant expression of tetraspanin molecules in B-cell chronic lymphoproliferative disorders and its correlation with normal B-cell maturation. Leukemia. 2005;19:1376–1383. doi: 10.1038/sj.leu.2403822. - DOI - PubMed
    1. Berditchevski F, Odintsova E. Tetraspanins as regulators of protein trafficking. Traffic. 2007;8:89–96. doi: 10.1111/j.1600-0854.2006.00515.x. - DOI - PubMed
    1. Canene-Adams K (2013) Preparation of formalin-fixed paraffin-embedded tissue for immunohistochemistry. In: Lorsch J (ed) Methods enzymology. Academic Press, Waltham, pp 225–233 - PubMed
    1. Charrin S, Jouannet S, Boucheix C, Rubinstein E. Tetraspanins at a glance. J Cell Sci. 2014 - PubMed
    1. Escola JM, Kleijmeer MJ, Stoorvogel W, et al. Selective enrichment of tetraspan proteins on the internal vesicles of multivesicular endosomes and on exosomes secreted by human B-lymphocytes. J Biol Chem. 1998;273:20121–20127. doi: 10.1074/jbc.273.32.20121. - DOI - PubMed

Publication types

LinkOut - more resources