. 2015 Dec;22(12):1922-34.
doi: 10.1038/cdd.2015.51. Epub 2015 May 8.

RCAD/Ufl1, a Ufm1 E3 ligase, is essential for hematopoietic stem cell function and murine hematopoiesis

Affiliations

RCAD/Ufl1, a Ufm1 E3 ligase, is essential for hematopoietic stem cell function and murine hematopoiesis

M Zhang et al. Cell Death Differ. 2015 Dec.

Abstract

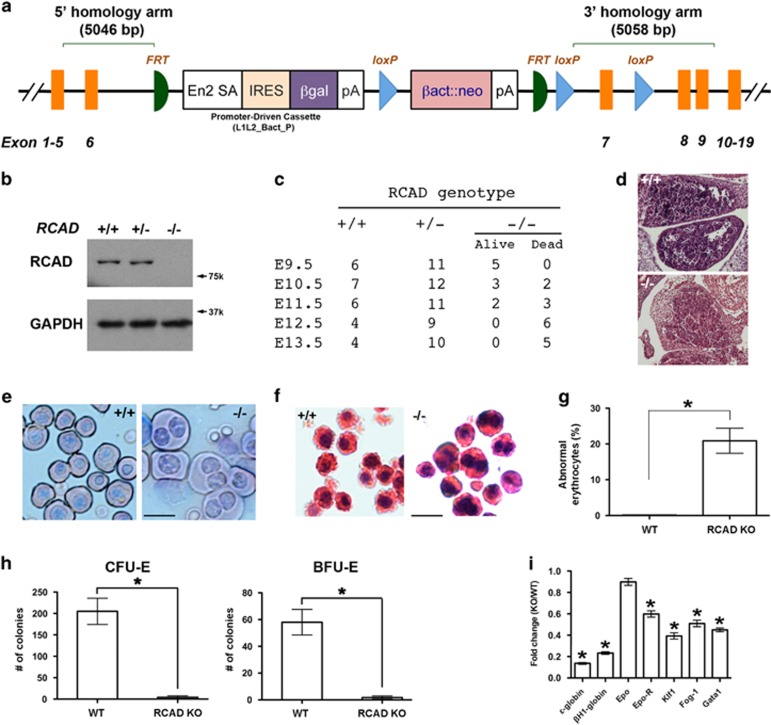
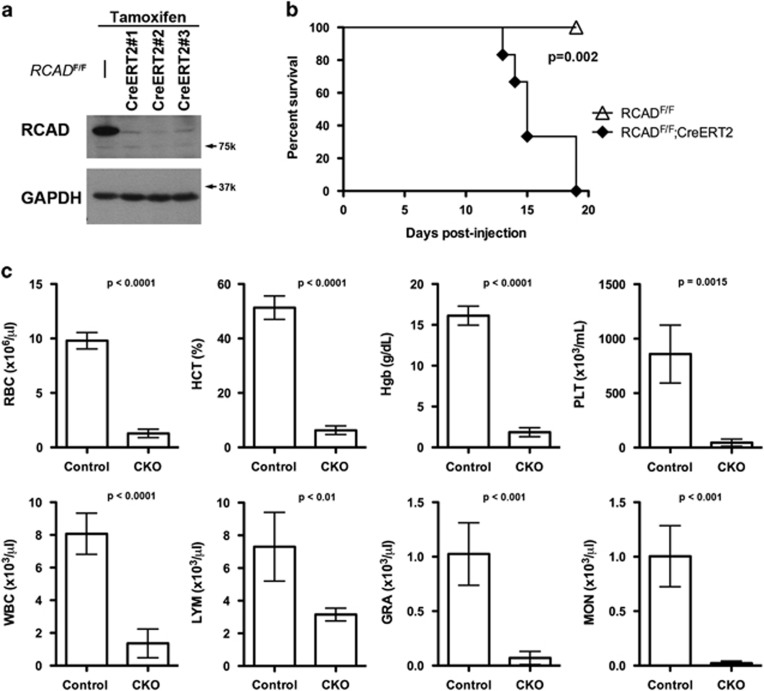
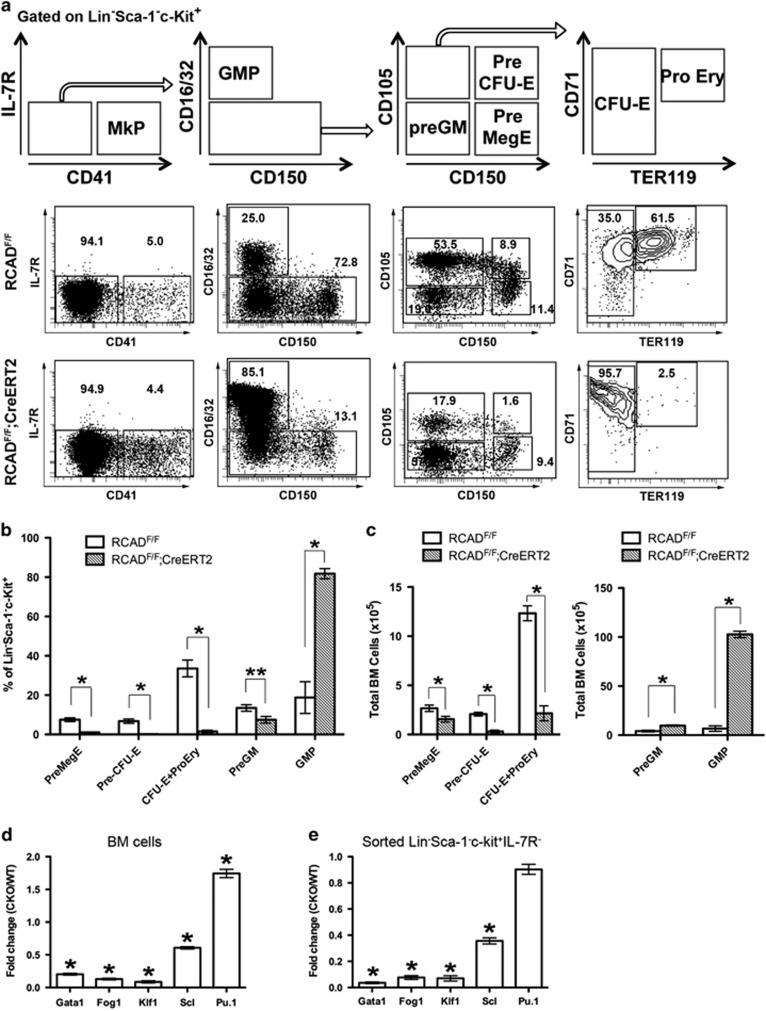
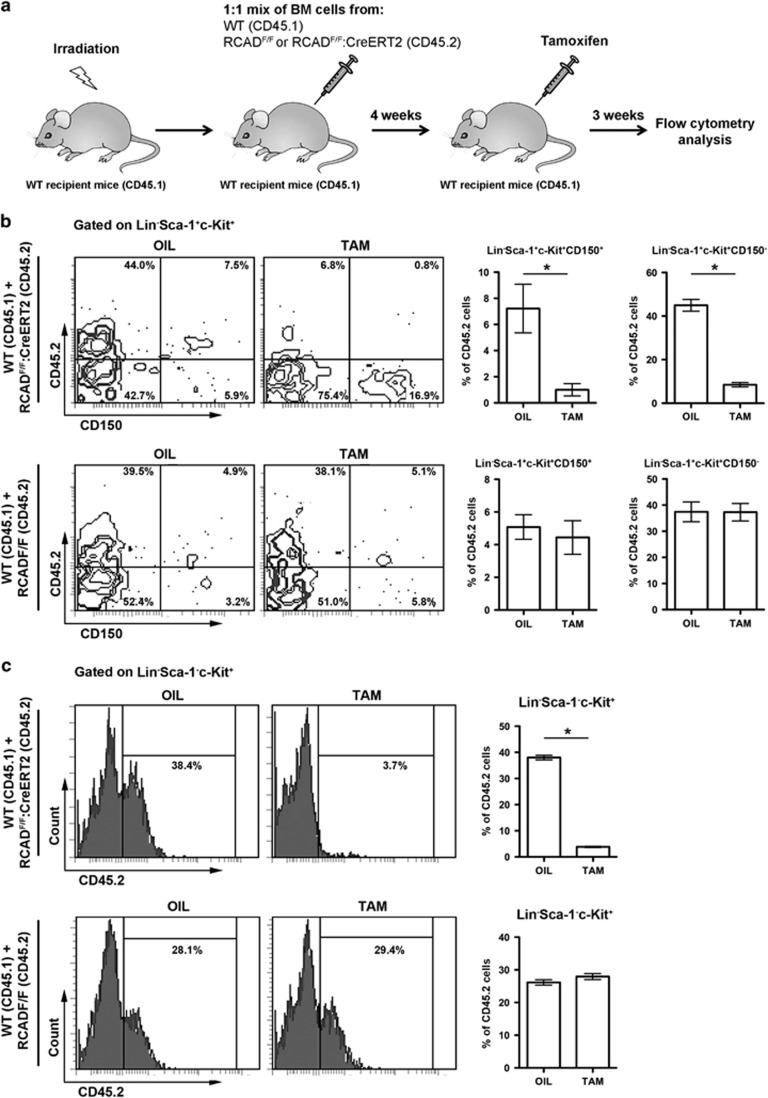
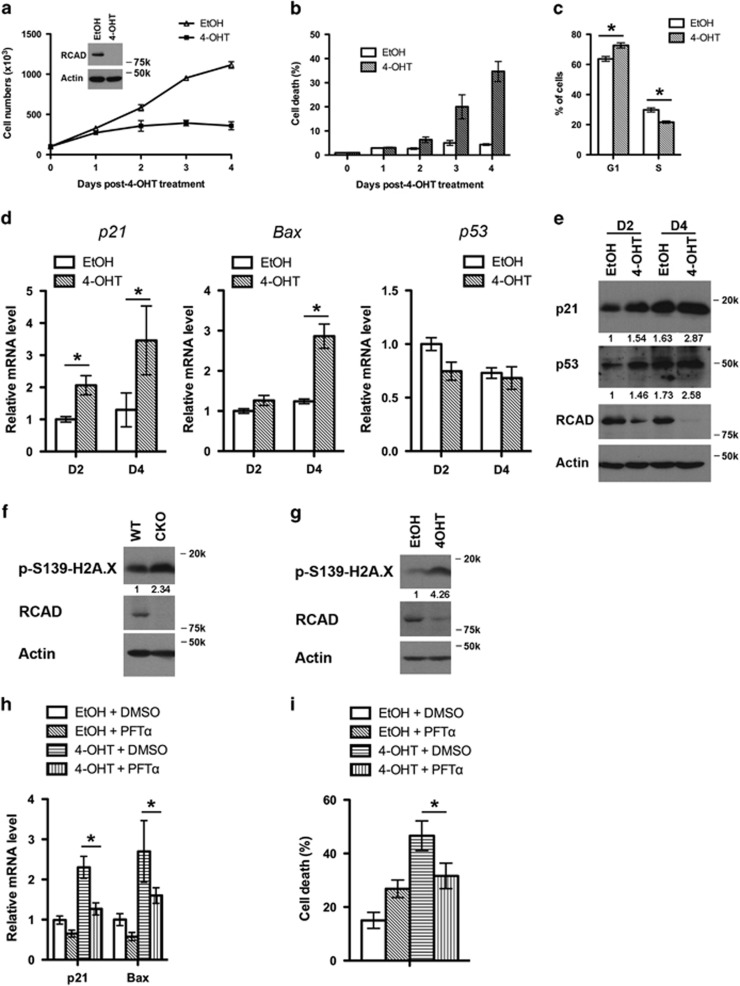
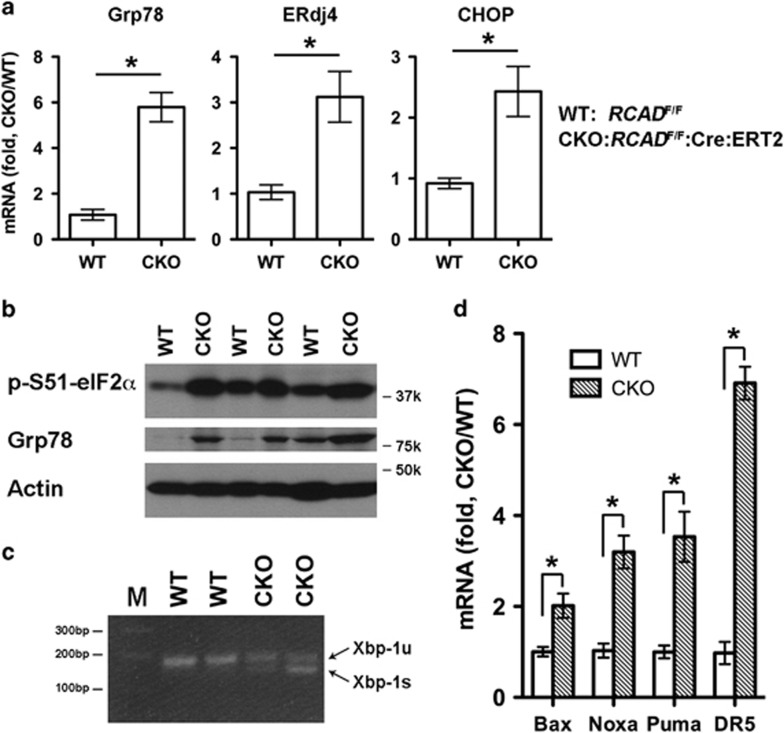
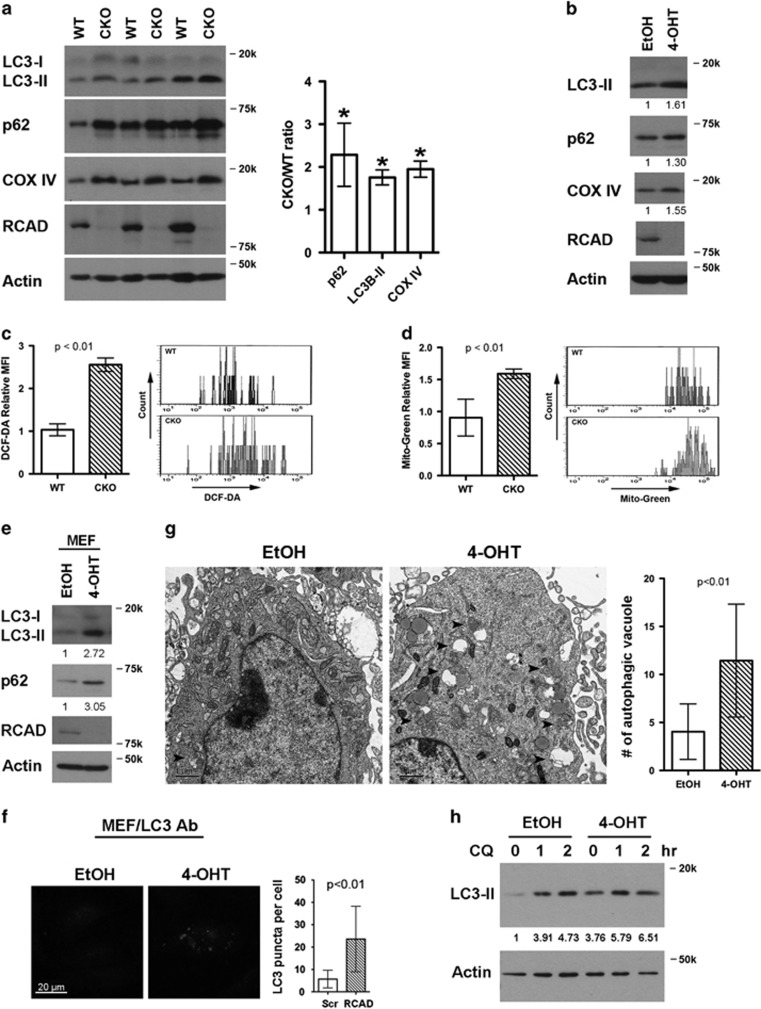
The Ufm1 conjugation system is a novel ubiquitin-like modification system, consisting of Ufm1, Uba5 (E1), Ufc1 (E2) and poorly characterized E3 ligase(s). RCAD/Ufl1 (also known as KIAA0776, NLBP and Maxer) was reported to function as a Ufm1 E3 ligase in ufmylation (Ufm1-mediated conjugation) of DDRGK1 and ASC1 proteins. It has also been implicated in estrogen receptor signaling, unfolded protein response (UPR) and neurodegeneration, yet its physiological function remains completely unknown. In this study, we report that RCAD/Ufl1 is essential for embryonic development, hematopoietic stem cell (HSC) survival and erythroid differentiation. Both germ-line and somatic deletion of RCAD/Ufl1 impaired hematopoietic development, resulting in severe anemia, cytopenia and ultimately animal death. Depletion of RCAD/Ufl1 caused elevated endoplasmic reticulum stress and evoked UPR in bone marrow cells. In addition, loss of RCAD/Ufl1 blocked autophagic degradation, increased mitochondrial mass and reactive oxygen species, and led to DNA damage response, p53 activation and enhanced cell death of HSCs. Collectively, our study provides the first genetic evidence for the indispensable role of RCAD/Ufl1 in murine hematopoiesis and development. The finding of RCAD/Ufl1 as a key regulator of cellular stress response sheds a light into the role of a novel protein network including RCAD/Ufl1 and its associated proteins in regulating cellular homeostasis.


Figures

Figure 1
Figure 1
RCAD is essential for embryonic erythropoiesis. (a) The targeting vector of RCAD allele. (b) Immunoblotting of RCAD protein in WT and KO embryos. (c) The number of embryos from timed-pregnant mice. (d) Hematoxylin & eosin staining of fetal livers of WT and KO E11.5 embryos. (e) Wright-Giemsa staining of peripheral blood cells from WT and KO E11.5 embryos. Scale bar: 20 μm. (f) Hematoxylin & eosin staining of representative circulating erythrocytes in WT and KO E11.5 embryos. Scale bar: 20 μm. (g) Percentage of abnormal multinucleated erythrocytes in peripheral blood cells of E11.5 embryos. *P<0.001 (n=3). (h) CFU-Es and BFU-Es in E11.5 fetal livers. The data represent the values of three embryos from each group. *P<0.001 (n=3). (i) Expression of the erythroid genes in E11.5 fetal livers. Total RNAs were purified from fetal livers of E11.5 embryos and subject to RT-PCR analysis. The ratio of KO to WT was presented. *P<0.01 (n=3). Data are presented as means±S.D.
Figure 2
Figure 2
Loss of RCAD in adult mice results in severe anemia, cytopenia and animal death. (a) Confirmation of RCAD loss in bone marrow cells of TAM-injected CKO (RCADF/F:CreERT2) mice. Floxed mice were IP injected with tamoxifen according to a standard protocol. BM cells were collected and subject to immunoblotting of RCAD. (b) Survival curve of RCAD-deficient mice after TAM injection, P<0.002 (n=5 each group). (c) The result of CBC counts. Data are presented as means±S.D. The blood was drawn from control (RCADF/F) (n=4) and RCAD-deficient mice (RCADF/F:CreERT2) (n=5) when RCAD-deficient mice became moribund and/or lost 20% of body weight after TAM injection (2–3 weeks post-TAM treatment). The blood samples were subjected to CBC counting. The mice used in this experiment were ~8-week-old male mice. Female RCAD-deficient mice exhibited the similar phenotype (data not shown). GRA, granulocyte; HCT, hematocrit; Hgb, hemoglobin; LYM, lymphocyte; MON, monocyte; PLT, platelet; RBC, red blood cell; WBC, white blood cell
Figure 3
Figure 3
RCAD deficiency impairs lineage development of erythroid cells. (a) Flow cytometry analysis of erythroid and myeloid lineages in control and RCAD-deficient mice after TAM injection. BM cells were collected from TAM-injected control (n=3) and floxed (n=3) male mice when RCAD-deficient mice exhibited significant weight loss and became moribund. The following markers were used for flow analysis: BV510-Sca-1, APC780-c-Kit, PE-Cy7-CD150, Alexa 700-CD16/32, PE-IL-7R, APC-CD41, BV650-CD105, FITC-CD71 and BV421-TER119, and lineage markers including PerCP-Cy5.5 conjugated CD4, CD8, CD3, CD5, Gr-1, CD11b, CD19 and B220. (b) The percentages of each lineage in L-S-K+ cells. *P<0.01, and **P<0.05 (n=3). (c) The absolute cell numbers of each lineage in BMs. There was no significant difference in the total BM cell numbers between control and RCAD-deficient mice (around 5 × 10⁷ cells). *P<0.01 (n=3). (d) Quantitative analysis of gene expression in total BM cells. *P <0.01 (n=3). (e) Quantitative analysis of gene expression in sorted myeloerythroid precursor cells. *P <0.01 (n=3). Data are presented as means±S.D.
Figure 4
Figure 4
RCAD is essential for maintaining HSC function. (a) Experimental scheme for competitive repopulation assay. The unfractionated BM cells from either RCADF/F or RCADF/F:CreERT2 (CD45.2) were mixed with wild-type (CD45.1) BM cells at a 1:1 ratio, and co-transplanted into lethally irradiated recipient CD45.1 mice. Four weeks after transplantation, the mice were treated with either oil or TAM. Three weeks after initiation of the treatment, the BM cells were isolated and subjected to flow analysis using indicated markers. (b) Contribution of RCAD-deficient cells (CD45.2) to long-term HSCs (L-S+K+CD150+) and multipotent progenitors (L-S+K+CD150-). *P<0.001 (n=5). (c) Contribution of RCAD-deficient cells (CD45.2) to oligopotent progenitor cells (L-S-K+). *P<0.001 (n=5). Data are presented as means±S.D.
Figure 5
Figure 5
Loss of RCAD leads to p53 activation and cell death of HSCs. (a) Proliferation of wild-type and RCAD-deficient HSCs. HSCs were sorted from BM of RCADF/F:CreERT2 mice, and cultured in the absence or presence of 4-OHT (1 μM) for indicated period of time. Cell numbers were manually scored. The experiment was performed three times independently. (b) Cell death of RCAD-deficient HSC cells. Cell death was elevated by DNA dye exclusion assay. (c) Cell cycle profile of RCAD-deficient HSCs. Cell cycle profile of HSCs was analyzed by PI staining after 4-day treatment of either EtOH or 4-OHT (1 μM). *P<0.01 (n=3). (d) Upregulation of p21 and Bax genes in RCAD-deficient cells. Relative mRNA levels of p21, Bax and p53 were evaluated by RT-PCR analysis. *P<0.01 (n=3). (e) Immunoblotting of p21 and p53 in EtOH and 4-OHT-treated HSCs. HSCs were harvested at indicated time points, and subjected to immunoblotting of p21, p53, RCAD and β-actin. (f) Phosphorylation of H2A.X in RCAD-deficient BM cells. After tamoxifen treatment, BM cells from either RCADF/F (WT) or RCADF/F:CreERT2 (CKO) mice were harvested. Cell lysates were subjected to immunoblotting of indicated antibodies. (g) Phosphorylation of H2A.X in RCAD-deficient HSCs. Sorted HSCs were treated with either EtOH or 4-OHT (1 μM) for 2 days. (h) The effect of PFT-α on induction of p21 and Bax in RCAD-deficient HSCs. HSCs were cultured in the media containing indicated reagents (4-OHT, 1 μM; PFT-α, 10 μM) for 4 days and harvested. Total RNA was isolated and subjected to RT-PCR analysis. The results were normalized to the mRNA levels of p21 and Bax in HSCs treated with solvent (EtOH and DMSO), respectively. *P<0.01 (n=3). (i) The effect of PFT-α on cell death of HSCs. HSCs were cultured in the media containing indicated reagents (4-OHT, 1 μM; PFT-α, 10 μM) for 4 days, and cell death was scored by DNA dye exclusion assay. *P<0.01 (n=3). Data are presented as means±S.D.
Figure 6
Figure 6
Loss of RCAD leads to elevated ER stress and activation of the UPR. (a) Upregulation of UPR genes including Grp78, ERdj4 and CHOP. Total RNA was isolated from BM cells that were harvested from three pairs of littermate treated with tamoxifen treatment, and subjected to RT-PCR analysis. *P<0.01 (n=3). (b) Elevation of phosphorylation of eIF2α and Grp78 expression in RCAD-deficient BM cells. The total cell lysates were subjected to immunoblotting of indicated antibodies. (c) Xbp-1 mRNA splicing in RCAD-deficient BM cells. Total RNA were isolated from BM cells of control and tamoxifen treated mice, and subjected to Xbp-1 splicing assay as described in 8. (d) Upregulation of cell death genes in RCAD-deficient BM cells. *P<0.01 (n=3)
Figure 7
Figure 7
Depletion of RCAD blocks autophagic degradation. (a) Accumulation of LC3-II, p62 and COX IV in RCAD-deficient BM cells. The relative ratio of CKO versus WT for each protein is presented as means±S.D. (n=3) with normalization against actin (Image J software, NIH, Bethesda, MD, USA). *P<0.001 (n=3). (b) Accumulation of LC3-II, p62 and COX IV in RCAD-deficient HSC cells. Sorted HSCs were treated with either ethanol (EtOH) or 4-OHT for 2 days. The levels of indicated proteins were quantified with Image J software and normalized against actin. (c) Increase of ROS in RCAD-deficient HSCs. WT and RCAD-deficient BM cells were collected and stained with Lineage, Sca-1 and c-Kit markers along with DCF-DA. Relative MFI (mean fluorescent intensity) was normalized against WT cells, and data are presented as means±S.D. (n=4). (d) Increase of mitochondrial mass in RCAD-deficient HSCs. WT and RCAD-deficient BM cells were collected and stained with Lin, Sca-1 and c-Kit markers along with Mitotracker-Green. Relative MFI (mean fluorescent intensity) was normalized against WT cells, and data are presented as means±S.D. (n=4). (e) Accumulation of LC3-II and p62 in RCAD-deficient MEF cells. Large T-transformed RCADF/F:CreERT2 MEF cells were treated with either EtOH or 4-OHT for 4 days, and subject to immunoblotting of indicated antibodies. (f) Accumulation of LC3 puncta in RCAD-deficient MEF cells. The number of endogenous LC3 puncta was manually scored in more than 100 cells. Data are presented as means±S.D. (g) Accumulation of autophagic vacuoles in RCAD-deficient MEF cells. The number of autophagic vacuoles was manually scored in more than 20 cells. Autophagic vacuoles are indicated by filled arrowheads. Data are presented as means±S.D. (h) Autophagic flux in RCAD-deficient MEF cells. The control (EtOH-treated) and RCAD-deficient (4-OHT-treated for 3 days) MEF cells were treated with CQ (200 μM) for 1 and 2 h, and the cell lysates were subjected to immunoblotting of specific antibodies. LC3-II level was quantified by Image J software with normalization against actin

References

    1. Komatsu M, Chiba T, Tatsumi K, Iemura S, Tanida I, Okazaki N et al. A novel protein-conjugating system for Ufm1, a ubiquitin-fold modifier. EMBO J 2004; 23: 1977–1986. - PMC - PubMed
    1. Tatsumi K, Yamamoto-Mukai H, Shimizu R, Waguri S, Sou YS, Sakamoto A et al. The Ufm1-activating enzyme Uba5 is indispensable for erythroid differentiation in mice. Nat Commun 2011; 2: 181. - PMC - PubMed
    1. Tatsumi K, Sou YS, Tada N, Nakamura E, Iemura S, Natsume T et al. A novel type of E3 ligase for the Ufm1 conjugation system. J Biol Chem 2010; 285: 5417–5427. - PMC - PubMed
    1. Shiwaku H, Yoshimura N, Tamura T, Sone M, Ogishima S, Watase K et al. Suppression of the novel ER protein Maxer by mutant ataxin-1 in Bergman glia contributes to non-cell-autonomous toxicity. EMBO J 2010; 29: 2446–2460. - PMC - PubMed
    1. Kwon J, Cho HJ, Han SH, No JG, Kwon JY, Kim H. A novel LZAP-binding protein, NLBP, inhibits cell invasion. J Biol Chem 2010; 285: 12232–12240. - PMC - PubMed

Publication types

MeSH terms

Substances