

Hepatocellular Shuttling and Recirculation of Sorafenib-Glucuronide Is Dependent on Abcc2, Abcc3, and Oatp1a/1b
- PMID: 25952649
- PMCID: PMC4490028
- DOI: 10.1158/0008-5472.CAN-15-0280
Hepatocellular Shuttling and Recirculation of Sorafenib-Glucuronide Is Dependent on Abcc2, Abcc3, and Oatp1a/1b
Abstract
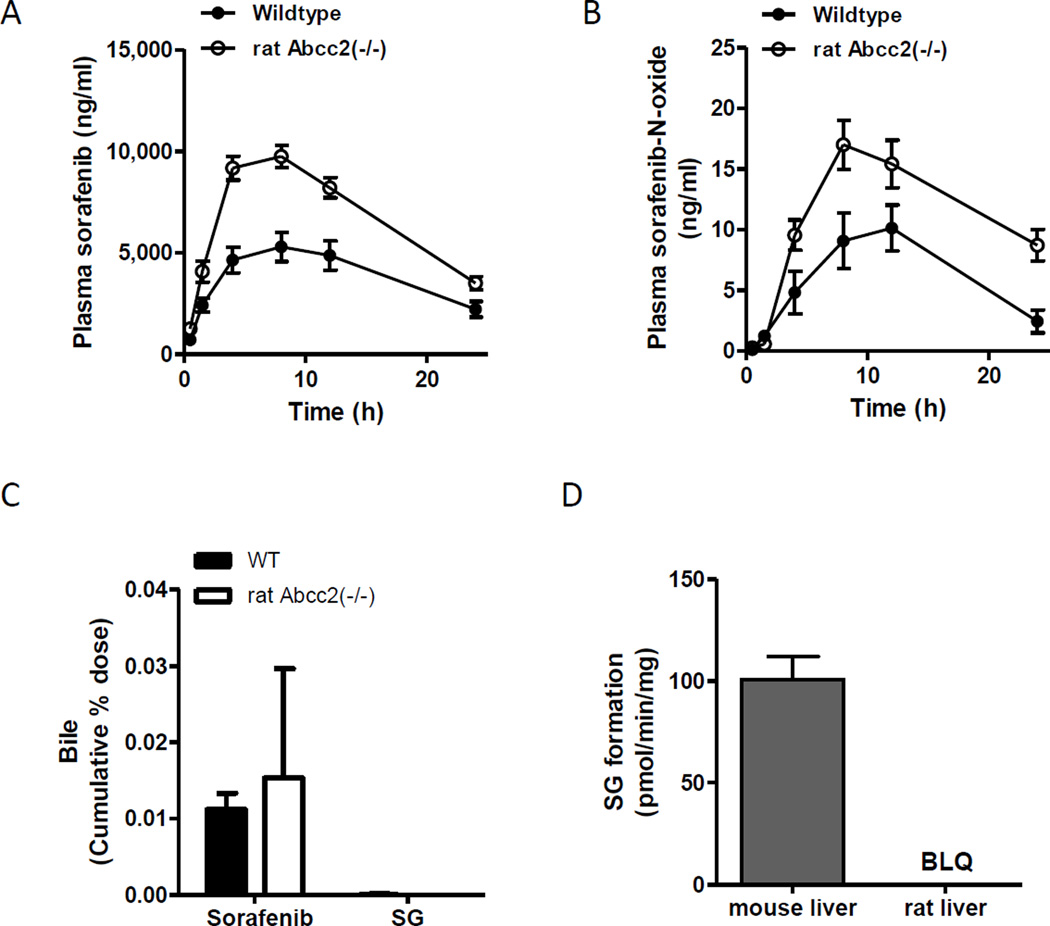
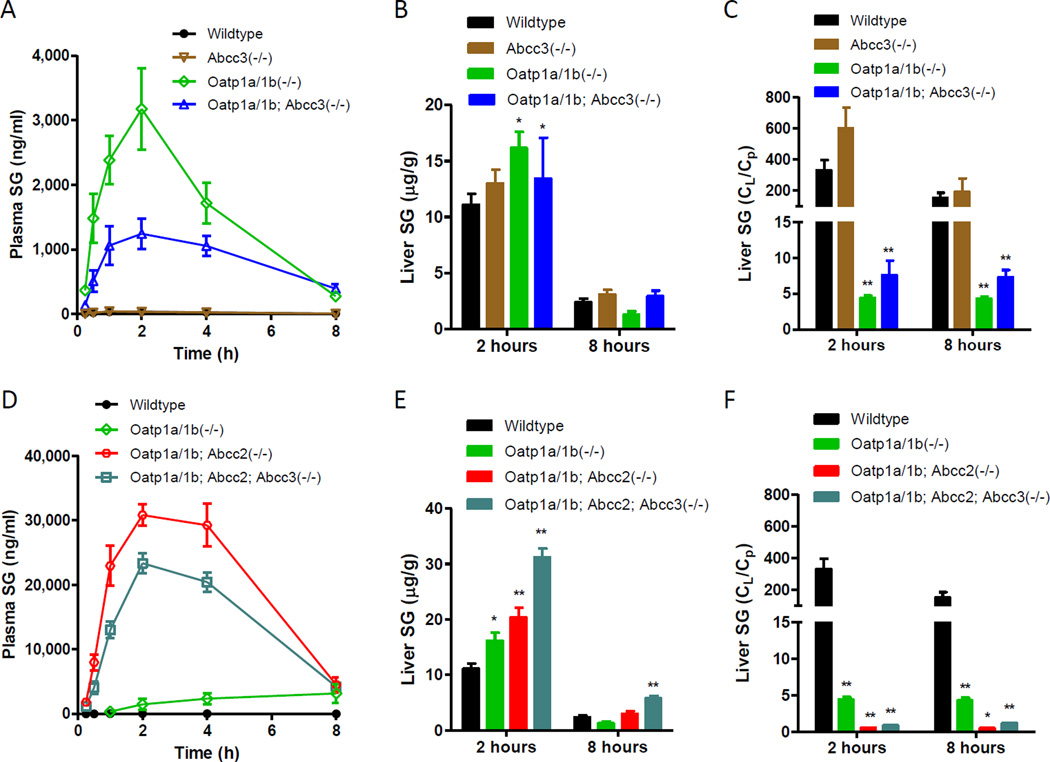
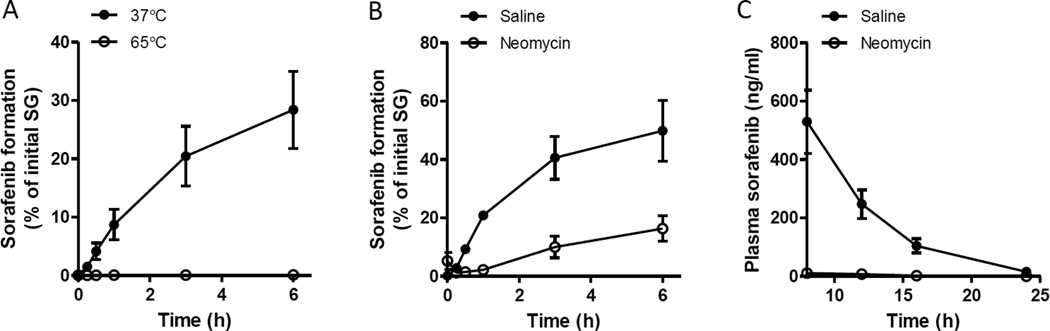
Recently, an efficient liver detoxification process dubbed "hepatocyte hopping" was proposed on the basis of findings with the endogenous compound, bilirubin glucuronide. According to this model, hepatocytic bilirubin glucuronide can follow a liver-to-blood shuttling loop via Abcc3 transporter-mediated efflux and subsequent Oatp1a/1b-mediated liver uptake. We hypothesized that glucuronide conjugates of xenobiotics, such as the anticancer drug sorafenib, can also undergo hepatocyte hopping. Using transporter-deficient mouse models, we show here that sorafenib-glucuronide can be extruded from hepatocytes into the bile by Abcc2 or back into the systemic circulation by Abcc3, and that it can be taken up efficiently again into neighboring hepatocytes by Oatp1a/1b. We further demonstrate that sorafenib-glucuronide excreted into the gut lumen can be cleaved by microbial enzymes to sorafenib, which is then reabsorbed, supporting its persistence in the systemic circulation. Our results suggest broad relevance of a hepatocyte shuttling process known as "hepatocyte hopping"-a novel concept in clinical pharmacology-for detoxification of targeted cancer drugs that undergo hepatic glucuronidation, such as sorafenib.
©2015 American Association for Cancer Research.
Conflict of interest statement
The research group of A.H. Schinkel receives revenue from the commercial distribution of some of the mouse strains described in this study. The authors declared no other conflict of interest. The content is solely the responsibility of the authors and does not necessarily represent the official views of the funding agencies.
Figures


Similar articles
-
Influence of OATP1B1 Function on the Disposition of Sorafenib-β-D-Glucuronide.Clin Transl Sci. 2017 Jul;10(4):271-279. doi: 10.1111/cts.12458. Epub 2017 Mar 31. Clin Transl Sci. 2017. PMID: 28371445 Free PMC article. Clinical Trial.
-
The impact of Organic Anion-Transporting Polypeptides (OATPs) on disposition and toxicity of antitumor drugs: Insights from knockout and humanized mice.Drug Resist Updat. 2016 Jul;27:72-88. doi: 10.1016/j.drup.2016.06.005. Epub 2016 Jun 25. Drug Resist Updat. 2016. PMID: 27449599 Review.
-
Sorafenib metabolism, transport, and enterohepatic recycling: physiologically based modeling and simulation in mice.Cancer Chemother Pharmacol. 2016 May;77(5):1039-52. doi: 10.1007/s00280-016-3018-6. Epub 2016 Apr 6. Cancer Chemother Pharmacol. 2016. PMID: 27053087 Free PMC article.
-
P-glycoprotein (P-gp/Abcb1), Abcc2, and Abcc3 determine the pharmacokinetics of etoposide.Clin Cancer Res. 2010 Jan 1;16(1):130-40. doi: 10.1158/1078-0432.CCR-09-1321. Epub 2009 Dec 22. Clin Cancer Res. 2010. PMID: 20028753
-
Effect of glucuronidation on transport and tissue accumulation of tyrosine kinase inhibitors: consequences for the clinical management of sorafenib and regorafenib.Expert Opin Drug Metab Toxicol. 2015 May;11(5):785-94. doi: 10.1517/17425255.2015.1030392. Epub 2015 Mar 25. Expert Opin Drug Metab Toxicol. 2015. PMID: 25809423 Review.
Cited by
-
Pharmacokinetic Drug Interaction Study of Sorafenib and Morphine in Rats.Pharmaceutics. 2021 Dec 16;13(12):2172. doi: 10.3390/pharmaceutics13122172. Pharmaceutics. 2021. PMID: 34959453 Free PMC article.
-
The Role of Uptake and Efflux Transporters in the Disposition of Glucuronide and Sulfate Conjugates.Front Pharmacol. 2022 Jan 13;12:802539. doi: 10.3389/fphar.2021.802539. eCollection 2021. Front Pharmacol. 2022. PMID: 35095509 Free PMC article. Review.
-
Development and validation of a UPLC-MS/MS method for simultaneous detection of doxorubicin and sorafenib in plasma: Application to pharmacokinetic studies in rats.Saudi Pharm J. 2023 Jul;31(7):1317-1326. doi: 10.1016/j.jsps.2023.05.025. Epub 2023 Jun 1. Saudi Pharm J. 2023. PMID: 37323919 Free PMC article.
-
In vivo assessment of pharmacokinetic interactions of empagliflozin and henagliflozin with sorafenib: an animal-based study.PeerJ. 2025 Jul 8;13:e19662. doi: 10.7717/peerj.19662. eCollection 2025. PeerJ. 2025. PMID: 40656939 Free PMC article.
-
Robust combination of liver stereotactic body radiotherapy modulates pharmacokinetics of sorafenib toward preferable parameters.Sci Rep. 2020 Jun 12;10(1):9575. doi: 10.1038/s41598-020-66583-9. Sci Rep. 2020. PMID: 32533042 Free PMC article.
References
-
- Gild ML, Bullock M, Robinson BG, Clifton-Bligh R. Multikinase inhibitors: a new option for the treatment of thyroid cancer. Nat Rev Endocrinol. 2011;7:617–624. - PubMed
-
- Iacovelli R, Alesini D, Palazzo A, Trenta P, Santoni M, De Marchis L, et al. Targeted therapies and complete responses in first line treatment of metastatic renal cell carcinoma. A meta-analysis of published trials. Cancer Treat Rev. 2014;40:271–275. - PubMed
-
- Abdel-Rahman O, Fouad M. Sorafenib-based combination as a first line treatment for advanced hepatocellular carcinoma: A systematic review of the literature. Crit Rev Oncol Hematol. 2014;91:1–8. - PubMed
-
- Inaba H, Rubnitz JE, Coustan-Smith E, Li L, Furmanski BD, Mascara GP, et al. Phase I pharmacokinetic and pharmacodynamic study of the multikinase inhibitor sorafenib in combination with clofarabine and cytarabine in pediatric relapsed/refractory leukemia. J Clin Oncol. 2011;29:3293–3300. - PMC - PubMed
-
- Smolle E, Taucher V, Petru E, Haybaeck J. Targeted treatment of ovarian cancer--the multiple - kinase - inhibitor sorafenib as a potential option. Anticancer Res. 2014;34:1519–1530. - PubMed
Publication types
MeSH terms
Substances
Grants and funding
LinkOut - more resources
Full Text Sources
Molecular Biology Databases
