

A novel procedure for statistical inference and verification of gene regulatory subnetwork
- PMID: 25952938
- PMCID: PMC4423581
- DOI: 10.1186/1471-2105-16-S7-S7
A novel procedure for statistical inference and verification of gene regulatory subnetwork
Abstract
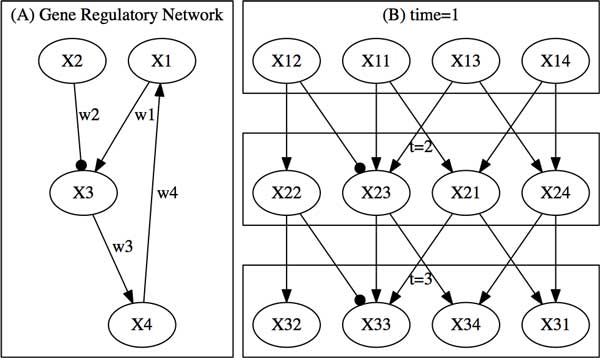
Background: The reconstruction of gene regulatory network from time course microarray data can help us comprehensively understand the biological system and discover the pathogenesis of cancer and other diseases. But how to correctly and efficiently decifer the gene regulatory network from high-throughput gene expression data is a big challenge due to the relatively small amount of observations and curse of dimensionality. Computational biologists have developed many statistical inference and machine learning algorithms to analyze the microarray data. In the previous studies, the correctness of an inferred regulatory network is manually checked through comparing with public database or an existing model.
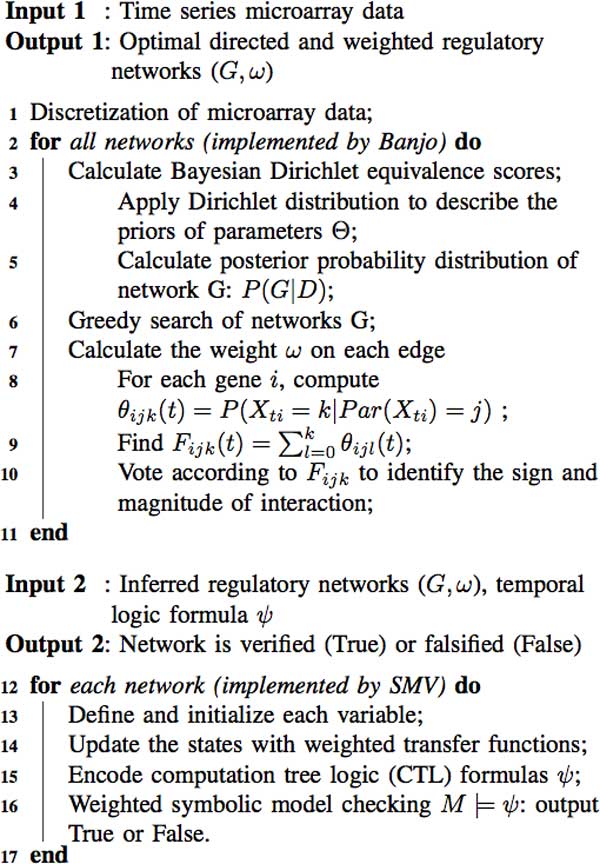
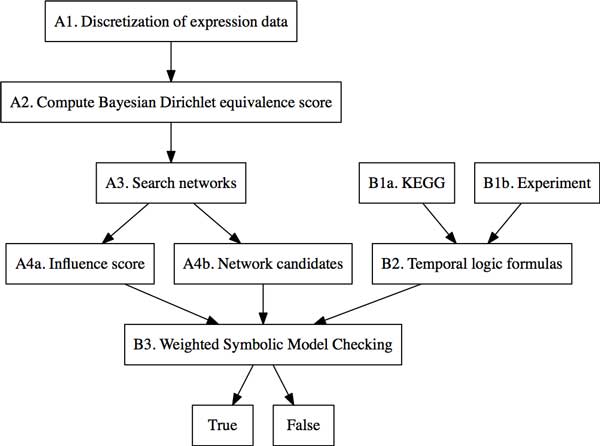
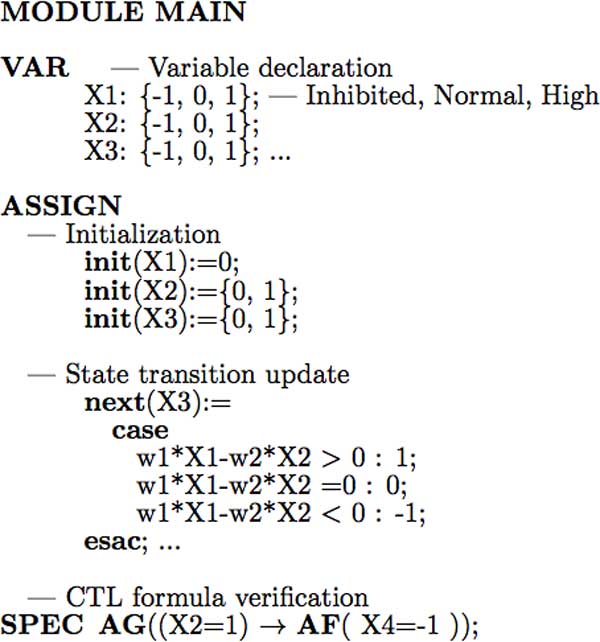
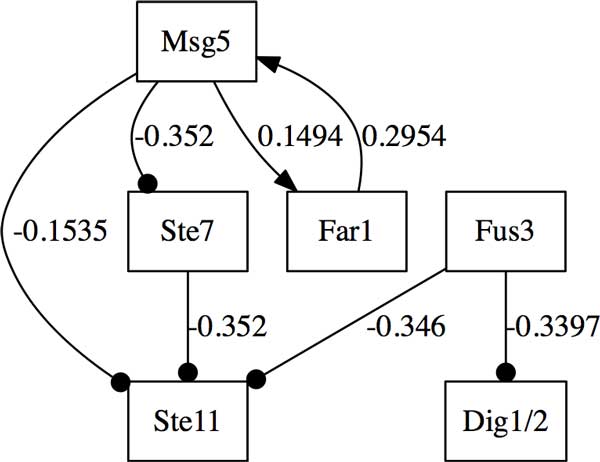
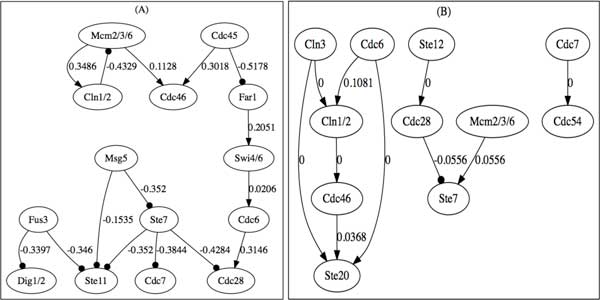
Results: In this work, we present a novel procedure to automatically infer and verify gene regulatory networks from time series expression data. The dynamic Bayesian network, a statistical inference algorithm, is at first implemented to infer an optimal network from time series microarray data of S. cerevisiae, then, a weighted symbolic model checker is applied to automatically verify or falsify the inferred network through checking some desired temporal logic formulas abstracted from experiments or public database.
Conclusions: Our studies show that the marriage of statistical inference algorithm with model checking technique provides a more efficient way to automatically infer and verify the gene regulatory network from time series expression data than previous studies.
Figures
Similar articles
-
TimeDelay-ARACNE: Reverse engineering of gene networks from time-course data by an information theoretic approach.BMC Bioinformatics. 2010 Mar 25;11:154. doi: 10.1186/1471-2105-11-154. BMC Bioinformatics. 2010. PMID: 20338053 Free PMC article.
-
MICRAT: a novel algorithm for inferring gene regulatory networks using time series gene expression data.BMC Syst Biol. 2018 Dec 14;12(Suppl 7):115. doi: 10.1186/s12918-018-0635-1. BMC Syst Biol. 2018. PMID: 30547796 Free PMC article.
-
Quantitative inference of dynamic regulatory pathways via microarray data.BMC Bioinformatics. 2005 Mar 7;6:44. doi: 10.1186/1471-2105-6-44. BMC Bioinformatics. 2005. PMID: 15748298 Free PMC article.
-
Learning Differential Module Networks Across Multiple Experimental Conditions.Methods Mol Biol. 2019;1883:303-321. doi: 10.1007/978-1-4939-8882-2_13. Methods Mol Biol. 2019. PMID: 30547406 Review.
-
Biological Network Inference and analysis using SEBINI and CABIN.Methods Mol Biol. 2009;541:551-76. doi: 10.1007/978-1-59745-243-4_24. Methods Mol Biol. 2009. PMID: 19381531 Review.
Cited by
-
Determining interaction directionality in complex biochemical networks from stationary measurements.Sci Rep. 2025 Jan 23;15(1):3004. doi: 10.1038/s41598-025-86332-0. Sci Rep. 2025. PMID: 39849082 Free PMC article.
-
Reconstructing Dynamic Gene Regulatory Networks Using f-Divergence from Time-Series scRNA-Seq Data.Curr Issues Mol Biol. 2025 May 30;47(6):408. doi: 10.3390/cimb47060408. Curr Issues Mol Biol. 2025. PMID: 40699807 Free PMC article.
-
An Integrative Analysis of Time-varying Regulatory Networks From High-dimensional Data.Proc IEEE Int Conf Big Data. 2018 Dec;2018:3798-3807. doi: 10.1109/BigData.2018.8622361. Epub 2019 Jan 24. Proc IEEE Int Conf Big Data. 2018. PMID: 31544173 Free PMC article.
References
-
- Wu TT, Wang S. Doubly regularized cox regression for high-dimensional survival data with group structures. Statisstics and Its Interface. 2013;6:175–186. doi: 10.4310/SII.2013.v6.n2.a2. - DOI
MeSH terms
LinkOut - more resources
Full Text Sources
Molecular Biology Databases
