Randomized Controlled Trial
. 2015 Jul;14(7):1959-76.
doi: 10.1074/mcp.M115.049783. Epub 2015 May 7.

Activating PIK3CA Mutations Induce an Epidermal Growth Factor Receptor (EGFR)/Extracellular Signal-regulated Kinase (ERK) Paracrine Signaling Axis in Basal-like Breast Cancer

Affiliations
Randomized Controlled Trial

Activating PIK3CA Mutations Induce an Epidermal Growth Factor Receptor (EGFR)/Extracellular Signal-regulated Kinase (ERK) Paracrine Signaling Axis in Basal-like Breast Cancer

Christian D Young et al. Mol Cell Proteomics. 2015 Jul.

Abstract

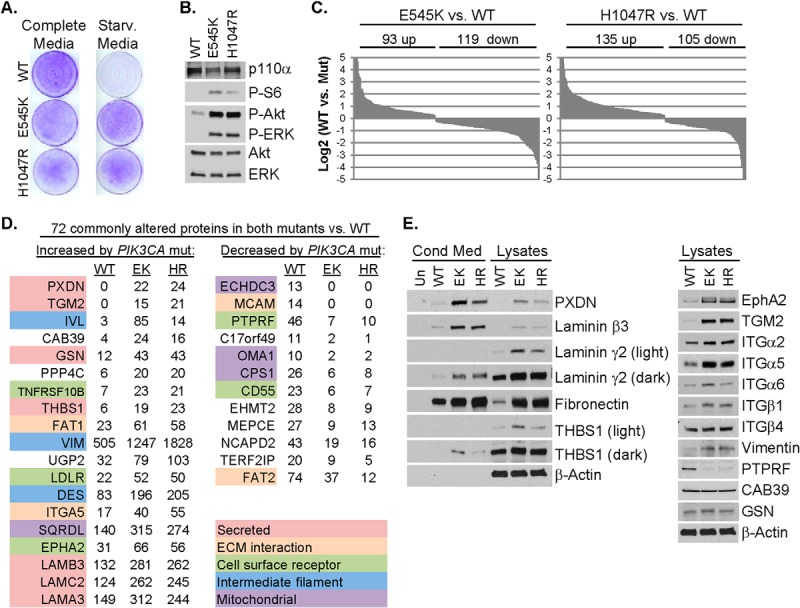
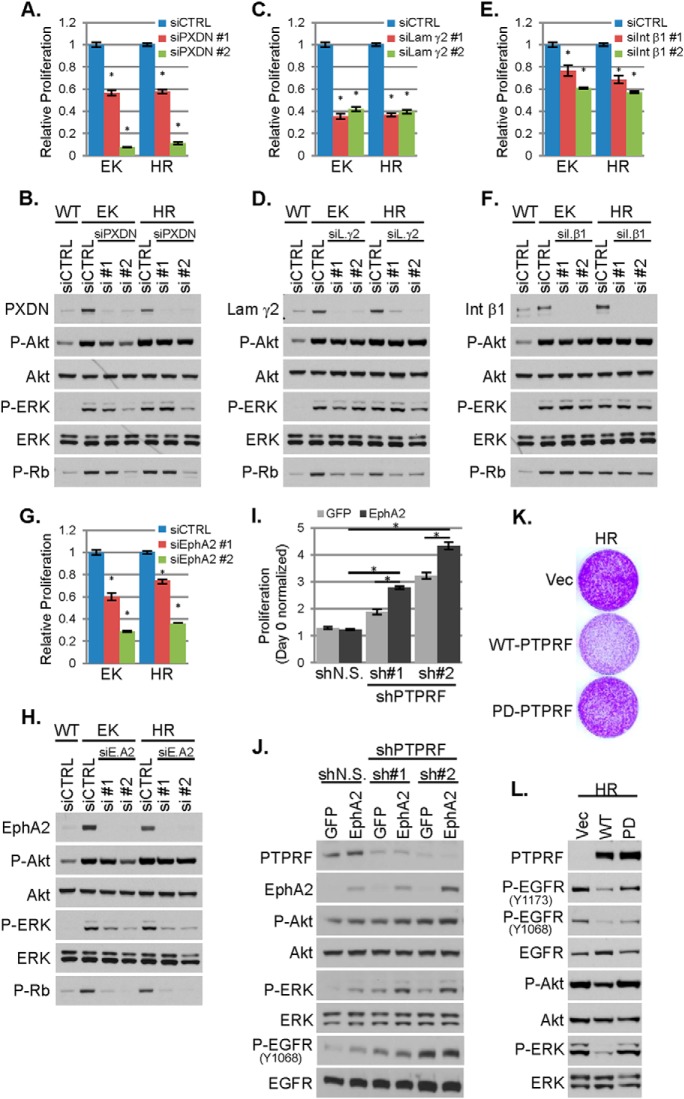
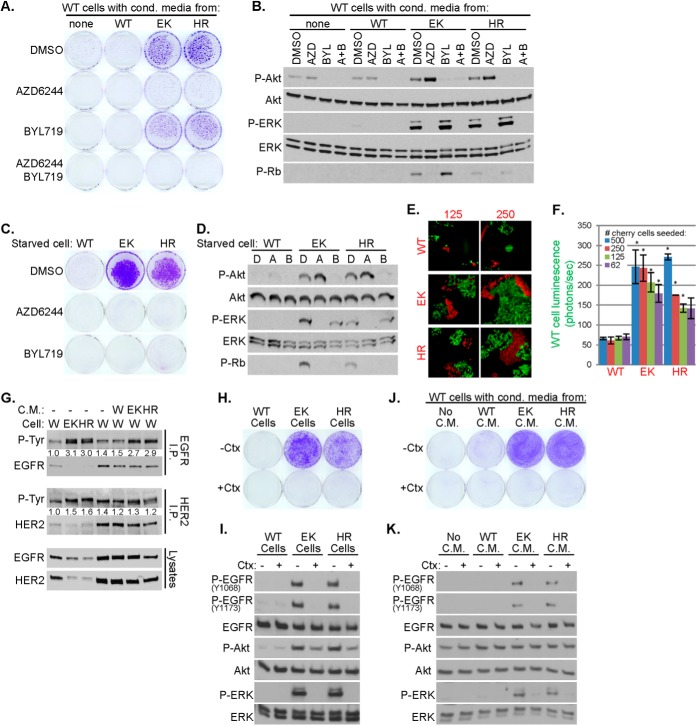
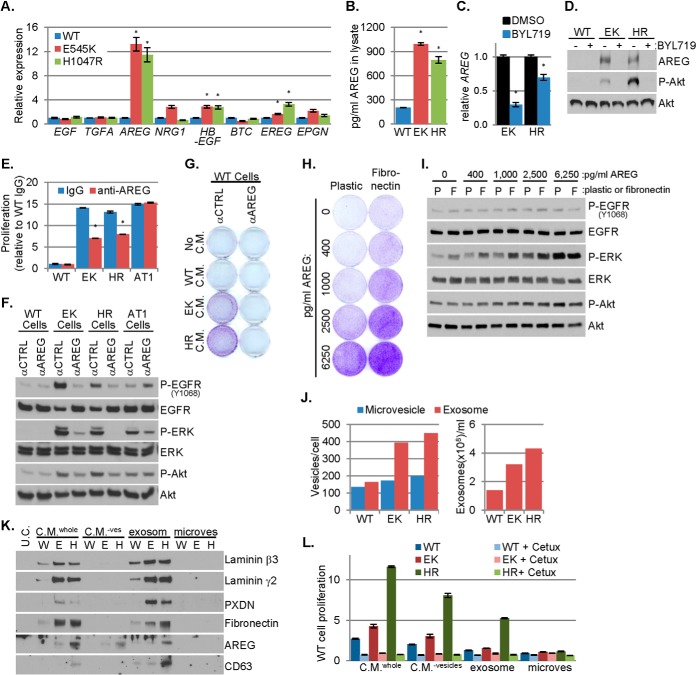
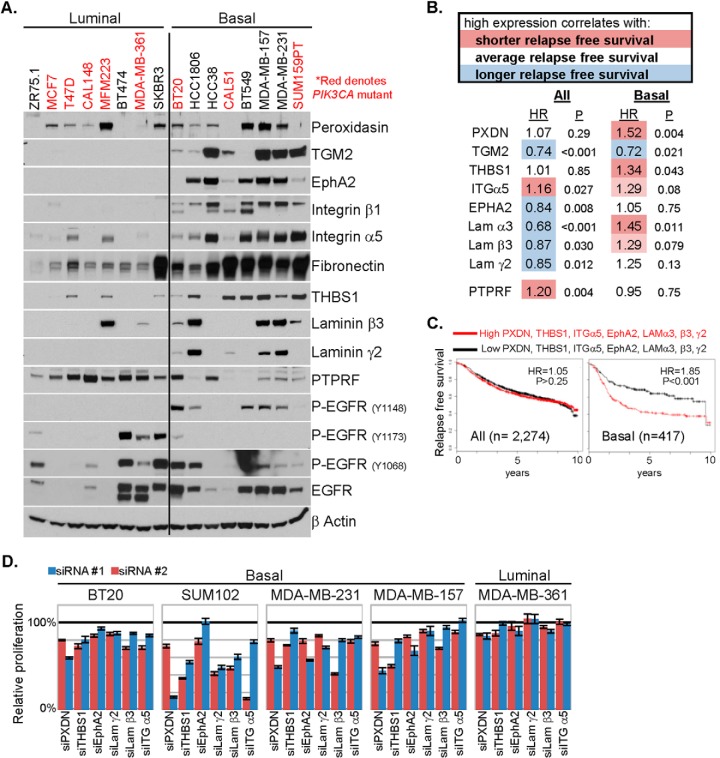
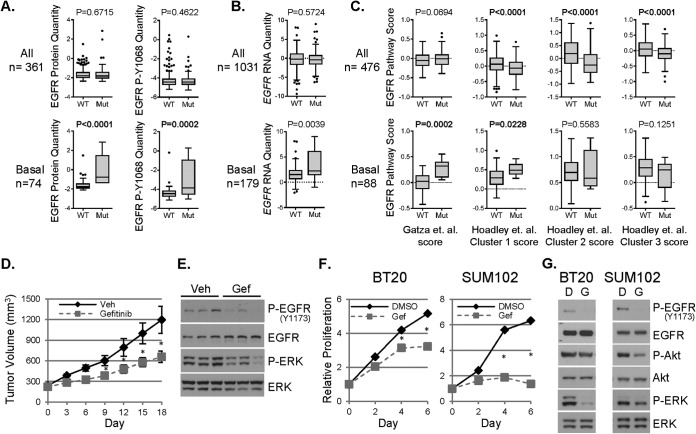
Mutations in PIK3CA, the gene encoding the p110α catalytic subunit of phosphoinositide 3-kinase (PI3K) have been shown to transform human mammary epithelial cells (MECs). These mutations are present in all breast cancer subtypes, including basal-like breast cancer (BLBC). Using liquid chromatography-tandem mass spectrometry (LC-MS/MS), we identified 72 protein expression changes in human basal-like MECs with knock-in E545K or H1047R PIK3CA mutations versus isogenic MECs with wild-type PIK3CA. Several of these were secreted proteins, cell surface receptors or ECM interacting molecules and were required for growth of PIK3CA mutant cells as well as adjacent cells with wild-type PIK3CA. The proteins identified by MS were enriched among human BLBC cell lines and pointed to a PI3K-dependent amphiregulin/EGFR/ERK signaling axis that is activated in BLBC. Proteins induced by PIK3CA mutations correlated with EGFR signaling and reduced relapse-free survival in BLBC. Treatment with EGFR inhibitors reduced growth of PIK3CA mutant BLBC cell lines and murine mammary tumors driven by a PIK3CA mutant transgene, all together suggesting that PIK3CA mutations promote tumor growth in part by inducing protein changes that activate EGFR.


Figures

Fig. 1.
Fig. 1.
Proteomic analysis of PIK3CA mutant MCF10A cells shows upregulation of secreted factors and ECM–cell interacting molecules. A, Wild type (WT) or PIK3CA mutant (E545K or H1047R) MCF10A cells were cultured in complete or starvation media for 6 days; proliferation was assessed by crystal violet staining of cell monolayers. B, Lysates of cells cultured for 2 days in starvation media were assessed by immunoblot analysis using the indicated antibodies. C, LC-MS/MS analysis of cell lysates was performed to determine relative protein abundance in E545K or H1047R PIK3CA MCF10A compared with WT PIK3CA MCF10A cells. Each protein which differed between WT and mutant cells with a p < 0.005 is presented as the log2 spectral count value of mutant versus WT. D, Partial list of the most highly up or downregulated proteins common in E545K (EK) and H1047R (HR) MCF10A cells compared with WT MCF10A cells presented as total spectral counts. E, Cells were cultured in starvation media. After 48 h, lysates and conditioned media were prepared and subjected to immunoblot analysis with the indicated antibodies.
Fig. 2.
Fig. 2.
Loss of PTPRF and upregulation of EphA2 cooperate to promote EGF-independent proliferation and EGFR activation. WT or PIK3CA mutant (EK or HR) MCF10A cells were transfected with 25 nm control siRNA or two different siRNA sequences targeting PXDN, A–B, Laminin γ2, C–D, Integrin β1, E–F, or EphA2, G–H, in starvation media. A, C, E, G, Relative proliferation, normalized to control siRNA transfected cells, was assessed at 96 h by SRB assay (average of six biological replicates ± S.E.). B, D, F, H, Cells were harvested 48 h after transfection and cell lysates evaluated by immunoblot analysis with the indicated antibodies. I, Proliferation of WT MCF10A cells stably expressing GFP or EphA2 and nonsilencing shRNA (shN.S.) or PTPRF-targeted shRNA (sh#1 or sh#2) was determined by SRB assay after 5 days of culture in starvation media (average of six biological replicates ± S.E.). J, Cells treated as described in panel I were lysed after 3 days and evaluated by immunoblot analysis. K, PIK3CAH1047R (HR) MCF10A cells stably expressing empty vector (vec), wild type (WT) PTPRF, or phosphatase-deficient (PD) PTPRF were seeded in equal numbers and cultured for 9 days in starvation media (with media replenished every 3 days); proliferation was assessed by crystal violet staining of cell monolayers. L, Cells treated as described in panel K were harvested after 3 days of culture and lysates evaluated by immunoblot analysis with the indicated antibodies. *p < 0.05 Student's t test.
Fig. 3.
Fig. 3.
Secreted factors from PIK3CA mutant MCF10A cells are sufficient to promote growth factor- and p110α-independent proliferation and EGFR activation. A–B, WT MCF10A cells in starvation media were treated with conditioned media harvested from WT or PIK3CA mutant (EK or HR) cells and DMSO, 1 μm AZD6244 or 1 μm BYL719. Cell proliferation was assessed by staining monolayers with crystal violet on day 18, A. After 5 days, lysates were prepared and evaluated by immunoblot analysis, B. C–D, WT or PIK3CA mutant MCF10A cells were cultured in starvation media in the presence of DMSO, 1 μm AZD6244 or 1 μm BYL719. Proliferation was assessed after 8 days, C. After 24 h, lysates were prepared for immunoblot analysis, D. E–F, One-thousand WT GFP-luciferase-expressing MCF10A cells were incubated in starvation media with 62, 125, 250, or 500 mCherry labeled WT, EK, or HR MCF10A cells. Cells were cultured for 14 days before being photomicrographed, E, or imaged with an IVIS200 bioimager, F, to quantitate luciferase expression (average photons/sec of biological duplicates ± S.E.; *p < 0.05 Student's t test). G, WT (W), E545K (EK) or H1047R (HR) MCF10A cells were cultured in starvation media for 2 days (lanes 1–3); WT cells were treated with the indicated conditioned media for 7 days (lanes 4–7). Cell lysates were harvested and subjected to immunoprecipitation and P-Tyr immunoblot analysis. P-Tyr band intensities were quantitated and normalized to lane 1. H–I, WT, EK, or HR MCF10A cells were cultured in starvation media ±10 μg/ml cetuximab. Cell proliferation was assessed after 8 days, H, and cell lysates prepared for immunoblot analysis after 2 days, I. J–K, Starvation media conditioned by WT, EK, or HR MCF10A cells were applied to WT MCF10A cells plated in starvation media ±10 μg/ml cetuximab. Cell proliferation was assessed after 8 days, J, and cell lysates prepared for immunoblot analysis after 2 days, K. Media and drugs were replenished every 3 days in all experiments.
Fig. 4.
Fig. 4.
Amphiregulin induced by PIK3CA mutation promotes EGF-independent cell proliferation. A, The expression of eight EGFR-family ligands in WT and PIK3CA mutant MCF10A cells cultured in starvation media was determined by qPCR and normalized to the expression of RPLP0; the normalized expression of each ligand in each mutant cell line is presented relative to WT cells (average of biological quadruplicates ± S.E.). B, Amphiregulin (AREG) concentration in 25 μg of WT or PIK3CA mutant MCF10A cell lysate was determined by ELISA (average of technical duplicates ± S.E.). Lysates were harvested from cells cultured in starvation media. C–D, WT or PIK3CA mutant MCF10A cells were cultured in starvation media containing DMSO or 1 μm BYL719. C, After 48 h, RNA was harvested and qPCR was used to determine the RPLP0 normalized expression of AREG in each mutant cell line, presented relative to the DMSO control (average of biological triplicates ± S.E.). D, After 72 h, cell lysates were prepared and analyzed by immunoblot analysis with the indicated antibodies. E–F, WT, PIK3CA mutant (EK and HR), or HRAS mutant (AT1) MCF10A cells were cultured in starvation media containing 25 μg/ml mouse IgG or AREG neutralizing antibody. Relative proliferation was assessed by SRB assay after 6 days of treatment (E; average of biological triplicates ± S.E.) and lysates were prepared for immunoblot analysis after 2 days, F. G, Starvation media conditioned by WT, EK or HR MCF10A cells were applied to WT MCF10A cells cultured in starvation media containing 25 μg/ml mouse IgG or AREG neutralizing antibody. After 9 days, monolayers were stained with crystal violet to assess cell proliferation. H–I, Growth factor starved WT MCF10A cells were seeded to plastic or fibronectin-coated plates and treated with the indicated doses of AREG. After 7 days, proliferation was assessed by crystal violet staining, H. Lysates were prepared for immunoblot analysis after 3 days, I. J, The number of microvesicles or exosomes harvested from starvation media conditioned by WT or PIK3CA mutant MCF10A cells was determined by Nano Sight and normalized to the number of cells (left) or to volume (right). K–L, Unconditioned starvation media (U.C.), whole conditioned media (C.M.whole), conditioned media depleted of vesicles (C.M.−ves), and exosome fraction or microvesicle fraction were evaluated by immunoblot analysis with the indicated antibodies, K. WT MCF10A cells plated in starvation media were treated with these fractions ±10 μg/ml cetuximab; proliferation was assessed by SRB assay after 7 days in culture (L; average of six biological replicates ± S.E.). Media and drugs were replenished every 3 days in all experiments. *p < 0.05 Student's t test.
Fig. 5.
Fig. 5.
Proteins upregulated by PIK3CA mutation correlate with decreased relapse free survival in BLBC. A, Lysates of a panel of luminal and BLBC cell lines were prepared and evaluated by immunoblot analysis with the indicated antibodies. B, A data set that includes RFS time and cDNA gene expression profiling data of the tumors from 2274 breast cancer patients (all) or a subset of 417 BLBC was queried (16). For each of the indicated genes, groups were divided equally in half (high expressors and low expressors); the RFS hazard ratio (HR) attributed to high expression and logrank p value between the two groups are presented. C, The same data set was queried with a multiple comparison of high versus low expression of the seven indicated genes. The Kaplan-Meier survival plots, hazard ratio and logrank p values for all patients and patients with BLBC are presented. D, The five indicated cell lines were transfected with control siRNA or two different siRNA sequences targeting PXDN, THBS1, EphA2, laminin γ2, laminin β3, or integrin α5 at a siRNA concentration of 25 nm in complete media. Relative proliferation, normalized to control siRNA transfected cells, was assessed at 96 h by SRB assay (average of five biological replicates ± S.E.).
Fig. 6.
Fig. 6.
PIK3CA mutations correlate with EGFR activity in basal-like breast cancer. A, TCGA reverse phase protein array data were analyzed to determine EGFR and P-Y1068 EGFR levels comparing PIK3CA WT versus PIK3CA mutant tumors in all breast cancers (top) or in the basal-like subtype (bottom). B, TCGA gene expression data were analyzed to determine EGFR levels comparing PIK3CA WT versus PIK3CA mutant tumors in all breast cancers (top) or in the basal-like subtype (bottom). C, TCGA gene expression data was used to compute four different EGFR pathway scores (17, 18) comparing PIK3CA WT to PIK3CA mutant tumors in all breast cancers (top) or in the basal-like subtype (bottom). D, Mammary tumors derived from MMTV/rtTA × tet-op/PIK3CAH1047R transgenic mice were transplanted into the mammary fat pad of athymic nude mice. Once tumors reached ≥250 mm3, mice were treated daily with vehicle or gefitinib (100 mg/kg orogastric gavage). Average tumor volume ±S.E. of six vehicle-treated and nine gefitinib-treated tumors is presented in mm3 (*p < 0.05 Student's t test). E, Tumor-bearing mice were treated for 4 days. 1 h after final treatment, tumors were harvested, and lysates prepared followed by immunoblot analyses. F–G, BT20 and SUM102 cells were cultured in starvation media with DMSO (D) or 1 μm Gefitinib, (G). Plates were fixed on days 0, 2, 4, and 6. Media and drugs were replenished every 3 days. Relative proliferation was assessed by SRB assay (F; average of six biological replicates ± S.E.). After 4 days of treatment, cell lysates were prepared for immunoblot analyses, G.

Similar articles

Cited by

References

    1. TCGA (2012) Comprehensive molecular portraits of human breast tumours. Nature 490, 61–70 - PMC - PubMed
    1. Debnath J., Brugge J. S. (2005) Modeling glandular epithelial cancers in three-dimensional cultures. Nat. Rev. Cancer 5, 675–688 - PubMed
    1. Gustin J. P., Karakas B., Weiss M. B., Abukhdeir A. M., Lauring J., Garay J. P., Cosgrove D., Tamaki A., Konishi H., Konishi Y., Mohseni M., Wang G., Rosen D. M., Denmeade S. R., Higgins M. J., Vitolo M. I., Bachman K. E., Park B. H. (2009) Knockin of mutant PIK3CA activates multiple oncogenic pathways. Proc. Natl. Acad. Sci. U.S.A. 106, 2835–2840 - PMC - PubMed
    1. Neve R. M., Chin K., Fridlyand J., Yeh J., Baehner F. L., Fevr T., Clark L., Bayani N., Coppe J. P., Tong F., Speed T., Spellman P. T., DeVries S., Lapuk A., Wang N. J., Kuo W. L., Stilwell J. L., Pinkel D., Albertson D. G., Waldman F. M., McCormick F., Dickson R. B., Johnson M. D., Lippman M., Ethier S., Gazdar A., Gray J. W. (2006) A collection of breast cancer cell lines for the study of functionally distinct cancer subtypes. Cancer Cell 10, 515–527 - PMC - PubMed
    1. Wang H., Qian W. J., Mottaz H. M., Clauss T. R., Anderson D. J., Moore R. J., Camp D. G., 2nd, Khan A. H., Sforza D. M., Pallavicini M., Smith D. J., Smith R. D. (2005) Development and evaluation of a micro- and nanoscale proteomic sample preparation method. J. Proteome Res. 4, 2397–2403 - PMC - PubMed

Publication types

MeSH terms