. 2015 Jul;168(3):1122-39.
doi: 10.1104/pp.15.00567. Epub 2015 May 7.

Transcription Factor ATAF1 in Arabidopsis Promotes Senescence by Direct Regulation of Key Chloroplast Maintenance and Senescence Transcriptional Cascades

Affiliations

Transcription Factor ATAF1 in Arabidopsis Promotes Senescence by Direct Regulation of Key Chloroplast Maintenance and Senescence Transcriptional Cascades

Prashanth Garapati et al. Plant Physiol. 2015 Jul.

Abstract

Senescence represents a fundamental process of late leaf development. Transcription factors (TFs) play an important role for expression reprogramming during senescence; however, the gene regulatory networks through which they exert their functions, and their physiological integration, are still largely unknown. Here, we identify the Arabidopsis (Arabidopsis thaliana) abscisic acid (ABA)- and hydrogen peroxide-activated TF Arabidopsis thaliana activating factor1 (ATAF1) as a novel upstream regulator of senescence. ATAF1 executes its physiological role by affecting both key chloroplast maintenance and senescence-promoting TFs, namely GOLDEN2-LIKE1 (GLK1) and ORESARA1 (Arabidopsis NAC092), respectively. Notably, while ATAF1 activates ORESARA1, it represses GLK1 expression by directly binding to their promoters, thereby generating a transcriptional output that shifts the physiological balance toward the progression of senescence. We furthermore demonstrate a key role of ATAF1 for ABA- and hydrogen peroxide-induced senescence, in accordance with a direct regulatory effect on ABA homeostasis genes, including nine-CIS-epoxycarotenoid dioxygenase3 involved in ABA biosynthesis and ABC transporter G family member40, encoding an ABA transport protein. Thus, ATAF1 serves as a core transcriptional activator of senescence by coupling stress-related signaling with photosynthesis- and senescence-related transcriptional cascades.


Figures

Figure 1.
Figure 1.
ATAF1 controls leaf senescence. A, ATAF1 expression increases during leaf aging. Data from two independent biological replicates, obtained from Affymetrix ATH1 microarray hybridizations, are shown. DAE, Days after emergence. B, Early onset of senescence in an OX-17 plant (arrows) compared with Col-0 and ataf1-4 plants grown under long-day condition (25 DAS). C, Delayed leaf senescence in the ataf1-4 mutant compared with Col-0 and OX-17 plants. At top, leaves detached from plants (35 DAS) were numbered from bottom (oldest leaf) to top (youngest leaf); cotyledons were not included in the leaf count. The middle and bottom parts show plants at 45 DAS. D, Chlorophyll content of leaf 9 at 35, 45, and 55 DAS. SPAD values were determined at the center of each leaf. Chlorophyll content decreases more rapidly in 35S:ATAF1 overexpression lines and more slowly in different ataf1 knockout mutants compared with the Col-0 wild type (n = 6). E, Leaf yellowing. Shown are the percentages of leaves that had at least approximately 50% yellow blades (inspected visually) at given DAS (n = 12 for each plant line and time point). F, Higher and lower ion leakage, respectively, in 35S:ATAF1 (OX-17) and ataf1 mutants compared with Col-0. Leaves 9 and 11 were combined and used for measurements. Data are means ± sd of three independent biological replicates. Asterisks indicate significant differences from Col-0 plants (Student’s t test, P ≤ 0.05). G, Expression of senescence marker genes (SAG12 and SAG13) in ATAF1 transgenics (45 DAS). Data are means ± sd of three independent biological replicates with two technical replicates each. Expression was normalized against the expression of ACTIN2.
Figure 2.
Figure 2.
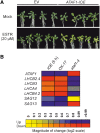
Inducible ATAF1 expression triggers senescence. A, Induction of ATAF1 expression in ATAF1-IOE plants by estradiol (ESTR) treatment results in precocious senescence. Ten-day-old seedlings were transferred to agar plates containing one-half-strength MS medium supplemented with 20 µm estradiol and grown for another 8 d (16 h of light at 22°C/8 h of dark at 18°C). No leaf senescence is visible in estradiol-treated empty-vector (EV) control transformants or in mock-treated seedlings. B, Elevated expression of ATAF1 results in reduced expression of PAGs in ATAF1-IOE (5 h after estradiol induction) and OX-17 plants, while knocking out ATAF1 in the ataf1-4 mutant has the opposite effect (27 DAS). On the contrary, expression of the early-senescence marker gene SAG13 is enhanced in ATAF1 overexpressors but reduced in ataf1-4. The heat map indicates differences in the expression (log2 fold change) of genes in estradiol-induced versus mock-treated ATAF1-IOE plants, and in OX-17 and ataf1-4 plants, respectively, compared with Col-0 (corresponding data are given in Supplemental Table S1). Data represent means of three independent biological replicates, each determined in two technical replicates.
Figure 3.
Figure 3.
Dark-induced senescence. A, ATAF1 expression increases during dark-induced senescence. The graph was reproduced from transcriptomic data reported in supplemental table 1 of Lin and Wu (2004). The x axis indicates the dark treatment period. Time point c6d represents samples from plants grown for 6 d without dark treatment, which were used as controls to verify the differential gene expression specific to dark treatment rather than to developmental alteration after 6 d of darkness. B, Leaves detached from whole rosettes of 3-week-old, long-day-grown Col-0, OX-17, and ataf1-4 plants were placed on moist filter paper in petri dishes. Samples were kept in continuous darkness for 3 d. Senescence is retarded in ataf1-4 in comparison with Col-0 plants, whereas it is enhanced in the overexpression line. Leaves are numbered from 1 (oldest) to 10 (youngest); the two cotyledons are shown as well. C, Chlorophyll content of leaves 5 and 9 from long-day-grown plants before and after 3 d of dark incubation (DDI). SPAD values were determined at the leaf tips. Note the higher and lower levels of chlorophyll content in the older leaf (i.e. leaf 5) in all three ataf1 mutants and 35S:ATAF1 (OX-17 and OX-20) plants, respectively, compared with Col-0 at 3 d of dark incubation. In the younger leaf (i.e. leaf 9), less chlorophyll content in OX-17 and OX-20 than in Col-0 at 3 d of dark incubation supports the conclusion that senescence is promoted by ATAF1 overexpression. Data are means ± sd of three independent biological replicates. Asterisks indicate significant differences from Col-0 plants (P ≤ 0.05). D, Transcript abundance of ATAF1, PAGs, and SAGs after a 3-d dark incubation (leaf 5). The heat map indicates expression differences (log2 fold change) in ATAF1 transgenics compared with Col-0 (for corresponding data, see Supplemental Table S1). E, Transcript abundance of PPDK in dark-incubated leaves (3 d) of ATAF1 OX-17 and ataf1-4 compared with Col-0. Fch, Fold change. Data in D and E represent means of two independent biological replicates, each determined in two technical replicates.
Figure 4.
Figure 4.
ORE1 and GLK1 are direct targets of ATAF1. A, Expression of ORE1 and GLK1 in 2-week-old ATAF1-IOE seedlings treated with estradiol (ESTR) for the indicated times. The heat map indicates expression compared with mock treatment (log2 fold change). Data represent means of three independent biological replicates each. Note the rapid down- and up-regulation of GLK1 and ORE1, respectively (for corresponding data, see Supplemental Table S1). B, EMSA. Purified ATAF1-CELD protein binds specifically to the ATAF1-binding site within the promoters of ORE1 and GLK1. In vitro DNA-binding reactions were performed with 40-bp-long promoter fragments containing the respective ATAF1 motifs (5′-GTTGCCTAACAATCTACGCATCT-3′) and GLK1 (5′-GACCAGTAGTCCTTTTACGAAAGT-3′). C, Nuclear localization of ATAF1-GFP fusion protein in transgenic Arabidopsis plants. D, Expression of ORE1 and GLK1 in 2-week-old 35S:ATAF1-GFP seedlings compared with expression in Col-0 plants. Numbers on the y axis indicate expression fold change (log2 Fch). Data are means ± sd of three independent biological replicates, each determined in two technical replicates. E, ChIP-qPCR. Shoots of 2-week-old 35S:ATAF1-GFP seedlings were harvested for the ChIP experiment. qPCR was used to quantify the enrichment of the ORE1 and GLK1 promoter regions. As a negative control (NC), qPCR was performed on a promoter (CLAVATA1; At1g75820) lacking ATAF1-binding sites. Data represent means ± sd (two independent biological replicates, each with three technical replicates).
Figure 5.
Figure 5.
ATAF1 requires ORE1 for full control over senescence. A, Elevated expression of ATAF1 in anac092-1 mutant plants transformed with the 35S:ATAF1 construct at 25 DAS. Data are means ± sd from three independent biological replications from T3 generation plants. Asterisks indicate significant differences from anac092-1 (Student’s t test, P ≤ 0.05). dCT, Delta cycle threshold. B, Comparison of ATAF1 overexpressors with Col-0 and the anac092-1 mutant grown in long-day conditions. Note the earlier leaf yellowing in OX-17 compared with 35S:ATAF1/anac092-1 plants. C, Leaf yellowing. Values on the y axis indicate the percentage of leaves that had at least 50% yellow blades (inspected visually) at a given DAS (n = 12 for each plant line and time point). D, Higher ion leakage of plants overexpressing ATAF1 in the Col-0 and anac092-1 backgrounds compared with Col-0 and the anac092-1 mutant, respectively. Leaves 9 and 11 were combined and used for measuring ion leakage. Data in C and D are means ± sd of three biological replicates (asterisks indicate significant differences from Col-0; Student’s t test, P ≤ 0.05). E, Lower expression of the senescence marker gene SAG12 in 35S:ATAF1/anac092-1 than in 35S:ATAF1/Col-0 (OX-17) plants at 35 DAS indicates partial but not full recovery of the anac092-1 senescence phenotype. The expression levels of SAG12 in 35S:ATAF1/anac092-1 and 35S:ATAF1/Col-0 (OX-17) plants were normalized against ACTIN2 and compared with Col-0. Data are means ± sd of three independent biological experiments. The asterisk indicates a significant difference from OX-17 (Student’s t test, P ≤ 0.05). Fch, Fold change. F, Percentage of up- and down-regulated SAGs in leaf 9 of 35S:ATAF1/Col-0 (OX-17) and 35S:ATAF1/anac092-1 L6 plants as well as in the anac092-1 mutant compared with Col-0 (45 DAS). The corresponding gene expression data from three independent biological replications, each determined in two technical replicates, are given in Supplemental Table S1.
Figure 6.
Figure 6.
Gene expression in 35S:ATAF1/Col-0 and 35S:ATAF1/anac092-1 plants. A, Expression of ORE1 target genes in plants overexpressing ATAF1 in the Col-0 and anac092-1 backgrounds. Note the higher expression of ORE1 targets genes in OX-17 and the reduced expression in 35S:ATAF1/anac092-1 (line L6) plants except for SWEET15. B, Reduced expression of GLK1 and GLK2 and their target genes in OX-17 and 35S:ATAF1/anac092-1 plants. The heat map indicates the expression difference (log2 fold change) between transgenic plants and Col-0. Data represent means of three independent biological replicates determined in two technical replicates each (corresponding data are given in Supplemental Table S1). Measurements were done at 35 DAS.
Figure 7.
Figure 7.
Expression of ABA signaling and metabolic genes. Elevated expression is shown for genes involved in ABA biosynthesis, transport, signaling, responses, and catabolism in OX-17 and 35S:ATAF1/anac092-1 plants. The heat map indicates the expression difference (log2 fold change) between transgenic plants and Col-0. Data represent means of two independent biological experiments with two technical replicates each (corresponding data are given in Supplemental Table S1).
Figure 8.
Figure 8.
NCED3 and ABCG40 are direct targets of ATAF1. A, Expression of NCED3 and ABCG40 in 2-week-old ATAF1-IOE seedlings after estradiol (ESTR) induction of ATAF1. The heat map indicates the difference in expression (log2 fold change) compared with mock-treated samples. Data represent means of three independent biological replicates, determined in two technical replicates each (corresponding data are given in Supplemental Table S1). B, EMSA. Purified ATAF1-CELD protein binds specifically to the ATAF1-binding site within the promoters of NCED3 and ABCG40. In vitro DNA-binding reactions were performed with 40-bp promoter fragments containing the respective ATAF1-binding motifs (NCED3, 5′-GACACTAATATAAACTACGTACC-3′; and ABCG40, 5′-AGATGCGTGGGAGGCTTGGGGAC-3′). C, Expression levels of ATAF1 and ABCG40 in 2-week-old 35S:ATAF1-GFP seedlings compared with Col-0; ATAF1 expression in 35S:ATAF1-GFP seedlings represents the combined expression of the endogenous ATAF1 gene and the ATAF1-GFP transgene. Numbers on the y axis indicate expression fold change (log2 Fch) of gene expression in 35S:ATAF1-GFP compared with Col-0. Data are means ± sd of three independent biological replicates, each determined in two technical replicates. D, ChIP-qPCR. Shoots of 2-week-old 35S:ATAF1-GFP seedlings were harvested for the ChIP experiment. qPCR was used to quantify enrichment of the ABCG40 promoter. As a negative control (NC), qPCR was performed on a promoter (CLAVATA1; At1g75820) lacking ATAF1-binding sites. Data represent means ± sd (two independent biological replicates, each with three technical replicates).
Figure 9.
Figure 9.
ATAF1 negatively regulates H2O2 tolerance. A, Two-week-old wild-type (WT) and ataf1-2 seedlings were incubated for 2 d in liquid MS medium containing 10 mm H2O2. Note the better survival of the ataf1-2 seedlings (right). B, Seedlings of all three ataf1 knockout mutants retained chlorophyll significantly better than the wild type after H2O2 treatment. FW, Fresh weight. C, Mature leaves treated with 20 mm H2O2 for 2 d. Note the reduced chlorosis of ataf1-2 leaves compared with leaves from wild-type or OX-17 plants after H2O2 treatment. A similar result was obtained for the ataf1-4 mutant (data not shown). D, DAB staining of H2O2-treated and untreated leaves. Leaves of the ATAF1 overexpressor exhibited stronger brown staining than leaves from wild-type or ataf1-2 plants. E, Change in leaf pigmentation in ATAF1-IOE seedlings grown for 1 week in liquid MS medium containing 10 µm estradiol (ESTR) or 10 µm estradiol plus 10 mm H2O2. Estradiol and H2O2 were omitted in mock treatments. An empty-vector (EV) line was used as a control. Before treatment, seedlings were grown for 2 weeks on solid MS medium. F, Decreased chlorophyll retention in estradiol-treated ATAF1-IOE seedlings upon H2O2 treatment. Data in B and F represent means of three independent biological replicates ± sd. Asterisks indicate data significantly different from control plants: the wild type in B and the empty vector in F (Student’s t test, P ≤ 0.05).
Figure 10.
Figure 10.
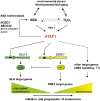
Model for the integration of ATAF1 function during developmental and stress-induced leaf senescence in Arabidopsis. ATAF1 activates ORE1 and represses GLK1 expression by directly binding to the promoters of both genes (ATAF1-binding sites are indicated by black boxes). Consequently, the expression of GLK target genes is impaired, resulting in an age-dependent decline in the expression of PAGs (GLK targets), while the expression of ORE1 target genes is enhanced, leading to the onset and subsequent progression of senescence. ATAF1 also activates the expression of genes involved in ABA biosynthesis and transport (NCED3 and ABCG40) and through this contributes to ABA-induced senescence. ATAF1 expression is regulated by unknown upstream TFs, allowing it to respond to ABA and H2O2 in a stress-related manner. Arrow-ending lines and T-ending lines indicate positive and negative interactions, respectively. The inhibitory effect of the ORE1 protein on GLK transcription factors was reported by Rauf et al. (2013a).

Similar articles

Cited by

References

    1. Allu AD, Soja AM, Wu A, Szymanski J, Balazadeh S (2014) Salt stress and senescence: identification of cross-talk regulatory components. J Exp Bot 65: 3993–4008 - PMC - PubMed
    1. Andersson A, Keskitalo J, Sjödin A, Bhalerao R, Sterky F, Wissel K, Tandre K, Aspeborg H, Moyle R, Ohmiya Y, et al. (2004) A transcriptional timetable of autumn senescence. Genome Biol 5: R24. - PMC - PubMed
    1. Arnon DI. (1949) Copper enzymes in chloroplasts: polyphenoloxidases in Beta Vulgaris. Plant Physiol 32: 691–697 - PMC - PubMed
    1. Baena-González E, Rolland F, Thevelein JM, Sheen J (2007) A central integrator of transcription networks in plant stress and energy signalling. Nature 448: 938–942 - PubMed
    1. Balazadeh S, Kwasniewski M, Caldana C, Mehrnia M, Zanor MI, Xue GP, Mueller-Roeber B (2011) ORS1, an H2O2-responsive NAC transcription factor, controls senescence in Arabidopsis thaliana. Mol Plant 4: 346–360 - PMC - PubMed

Publication types

MeSH terms