. 2015 Jul:84:170-8.
doi: 10.1016/j.yjmcc.2015.04.022. Epub 2015 May 4.

T-tubule disease: Relationship between t-tubule organization and regional contractile performance in human dilated cardiomyopathy

Affiliations

T-tubule disease: Relationship between t-tubule organization and regional contractile performance in human dilated cardiomyopathy

David J Crossman et al. J Mol Cell Cardiol. 2015 Jul.

Abstract

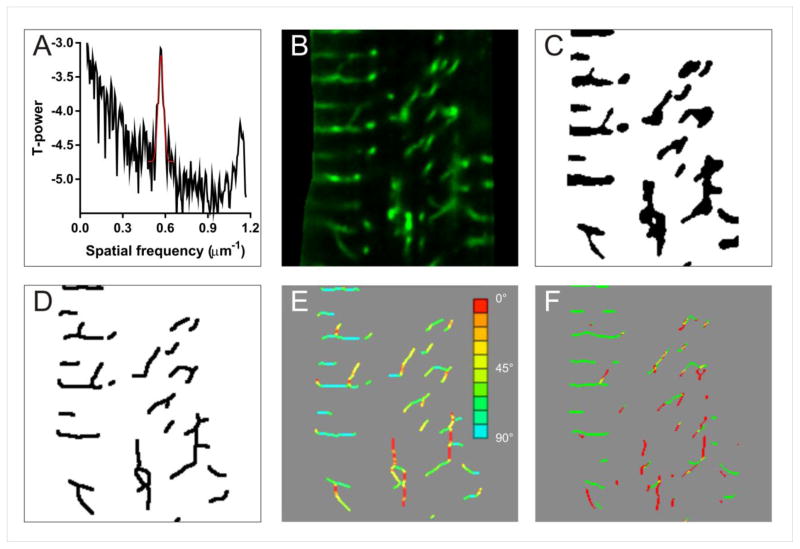
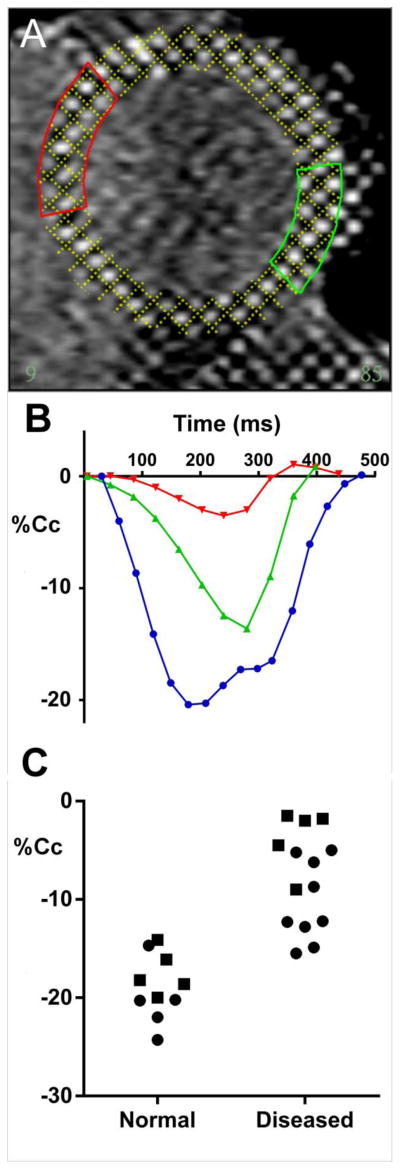
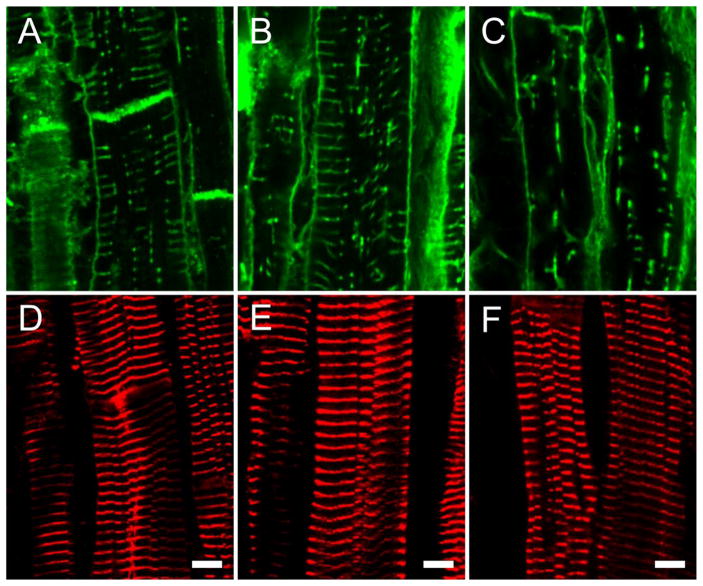
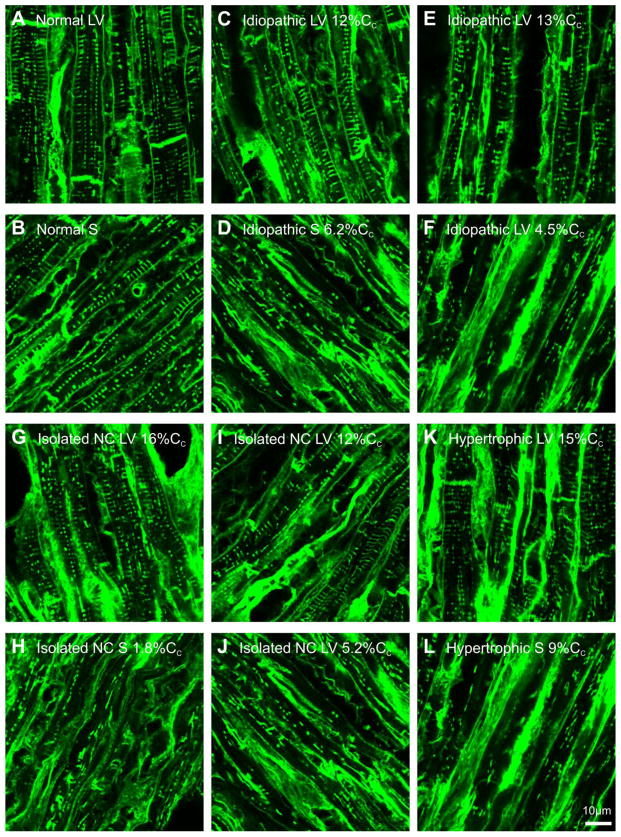
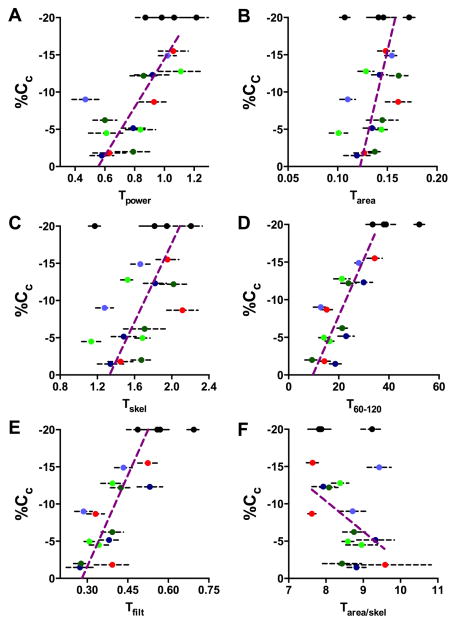
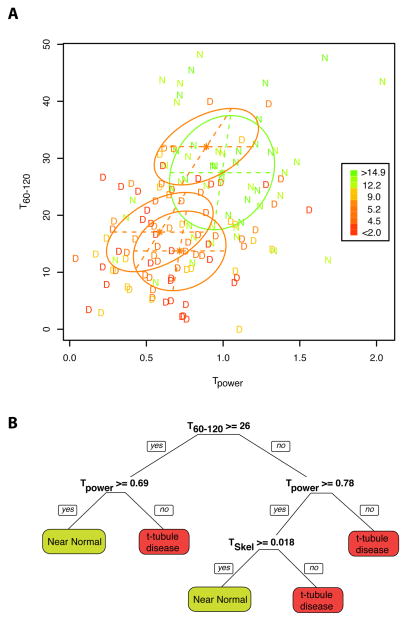
Evidence from animal models suggest that t-tubule changes may play an important role in the contractile deficit associated with heart failure. However samples are usually taken at random with no regard as to regional variability present in failing hearts which leads to uncertainty in the relationship between contractile performance and possible t-tubule derangement. Regional contraction in human hearts was measured by tagged cine MRI and model fitting. At transplant, failing hearts were biopsy sampled in identified regions and immunocytochemistry was used to label t-tubules and sarcomeric z-lines. Computer image analysis was used to assess 5 different unbiased measures of t-tubule structure/organization. In regions of failing hearts that showed good contractile performance, t-tubule organization was similar to that seen in normal hearts, with worsening structure correlating with the loss of regional contractile performance. Statistical analysis showed that t-tubule direction was most highly correlated with local contractile performance, followed by the amplitude of the sarcomeric peak in the Fourier transform of the t-tubule image. Other area based measures were less well correlated. We conclude that regional contractile performance in failing human hearts is strongly correlated with the local t-tubule organization. Cluster tree analysis with a functional definition of failing contraction strength allowed a pathological definition of 't-tubule disease'. The regional variability in contractile performance and cellular structure is a confounding issue for analysis of samples taken from failing human hearts, although this may be overcome with regional analysis by using tagged cMRI and biopsy mapping.

Keywords: Contraction; Heart failure; Human; t-tubules.


Figures

Figure 1
Figure 1
Illustration of image processing methods and derivation of TT metrics. A shows a typical power spectrum derived from TT WGA labelling. B shows an enlarged region of TT labelling (diseased sample) and C the thresholded image. D shows the topological skeleton of C. The calculated angles of the skeleton are shown in E with the color coding shown at right. F shows the application of Sobel filters to give transverse (green) and longitudinal (red) skeleton elements.
Figure 2
Figure 2
Regional sampling from cMRI. Panel A shows a typical heart short axis view of a patient with idiopathic dilated cardiomyopathy, the tagging marks are fitted by a model computer grid whose dimensions during the contraction/relaxation cycle give regional circumferential contration (%Cc). B shows regional shortening from two regions identified by color in A. Note the marked difference in contractile performance between these regions. For reference, shortening from a normal human heart cMRI is shown in blue. Panel C shows %Cc a sample of for healthy volunteers and heart failure patients. The symbols denote septum (circles) versus LV free wall (squares).
Figure 3
Figure 3
t-tubule and sarcomere labeling. Panels A,B and C show exemplar confocal micrographs of WGA stained t-tubules from normal, strongly contracting (Cc > 12%) and weakly contracting (Cc <1.8%) diseased hearts respectively. Panels D,E and F show z-lines (alpha actinin labelled) of same regions as shown in panels A, B and C respectively.
Figure 4
Figure 4
Lower magnification views of WGA labelling of t-tubules in failing human heart regions with variable levels of fractional shortening (%Cc). Panel A shows normal left ventricle (LV) and panel B shows normal septum (S) labelling. Panel C shows labelling of idiopathic LV (patient 1) with strong fractional shortening (12%Cc) and panel D shows S labelling associated with weak fractional shortening (6.2%Cc) from the same patient shown in panel C. Panel E shows labelling of an idiopathic LV (patient 2) with strong fractional shortening (13%Cc) and panel F shows labelling in a region with weak fractional shortening (4.5%Cc) (same patient shown in panel E). Panel G shows isolated non-compaction LV (patient 3) with strong fractional shortening (16%Cc) and panel H shows S labelling with weak fractional shortening (1.8%Cc) (same patient as shown in panel G). Panel I shows isolated non-compaction LV (patient 4) with strong fractional shortening (12%Cc) while panel J shows LV labelling associated with weak fractional shortening (5.2%Cc) from same patient shown in panel I. Panel K shows hypertrophic LV (patient 5) with strong fraction shortening (15%Cc) while panel L shows S labelling associated with moderate fractional shortening (9%Cc) from the same patient as shown in panel K.
Figure 5
Figure 5
Human t-tubule morphological analysis. Panel A shows the relationship between Tpower and %Cc for all samples analyzed. In all panels, each patient is indicated by a different color (see below) and error bars are 1SE. B Tarea measured by pixel thresholding. C Tskel measured from the skeleton of the thresholded area image. D shows the percentage of TTs that are within 30 degrees of being transverse to the long axis of the cell (T60-120). E the fraction of energy retained by transverse and longitudinal Sobel filters – note the close similarity of this metric to T60-120 (panel D). F shows a proxy for mean TT diameter derived by the division of Tarea by Tskel. In all panels a Deming regression line is shown to summarise the relationship between the TT metric and %Cc for the diseased samples only with samples from normal hearts being shown by black circles at an assumed 20%Cc. Analysis of samples from patient 1 (table 1) is shown in dark green; patient 2 in light green; patient 3 in red; patient 4 in dark blue; patient 5 in light blue.
Figure 6
Figure 6
Panel A shows all HF samples plotted according to the Tpower and T60-120 metrics with D indicating Cc <10% and N indicating Cc >= 10% and coloured accorded to their %Cc values as indicated in the inset. The stars and ellipses show the means and covariances of the best classification with the green ellipse indicating the estimated shape of the N cases and the three red ellipses the same for the D cases. B shows a possible decision tree for t-tubule disease based on the metrics described here.

Comment in

References

    1. Cheng H, Cannell MB, Lederer WJ. Propagation of excitation-contraction coupling into ventricular myocytes. Pflugers Arch. 1994 Oct;428(3–4):415–7. - PubMed
    1. Brette F, Despa S, Bers DM, Orchard CH. Spatiotemporal characteristics of SR Ca(2+) uptake and release in detubulated rat ventricular myocytes. J Mol Cell Cardiol. 2005 Nov;39(5):804–12. - PubMed
    1. Guo A, Zhang C, Wei S, Chen B, Song L-S. Emerging mechanisms of T-tubule remodelling in heart failure. Cardiovasc Res. 2013 May 1;98(2):204–15. - PMC - PubMed
    1. Louch WE, Mørk HK, Sexton J, Strømme TA, Laake P, Sjaastad I, et al. T-tubule disorganization and reduced synchrony of Ca2+ release in murine cardiomyocytes following myocardial infarction. J Physiol (Lond) 2006 Jul 15;574(Pt 2):519–33. - PMC - PubMed
    1. Song LS. Calcium Biology of the Transverse Tubules in Heart. Annals of the New York Academy of Sciences. 2005 Jun 1;1047(1):99–111. - PMC - PubMed

Publication types

MeSH terms

Substances

LinkOut - more resources