. 2015 May 26;112(21):6706-11.
doi: 10.1073/pnas.1503830112. Epub 2015 May 7.

Behavioral idiosyncrasy reveals genetic control of phenotypic variability

Affiliations

Behavioral idiosyncrasy reveals genetic control of phenotypic variability

Julien F Ayroles et al. Proc Natl Acad Sci U S A. .

Abstract

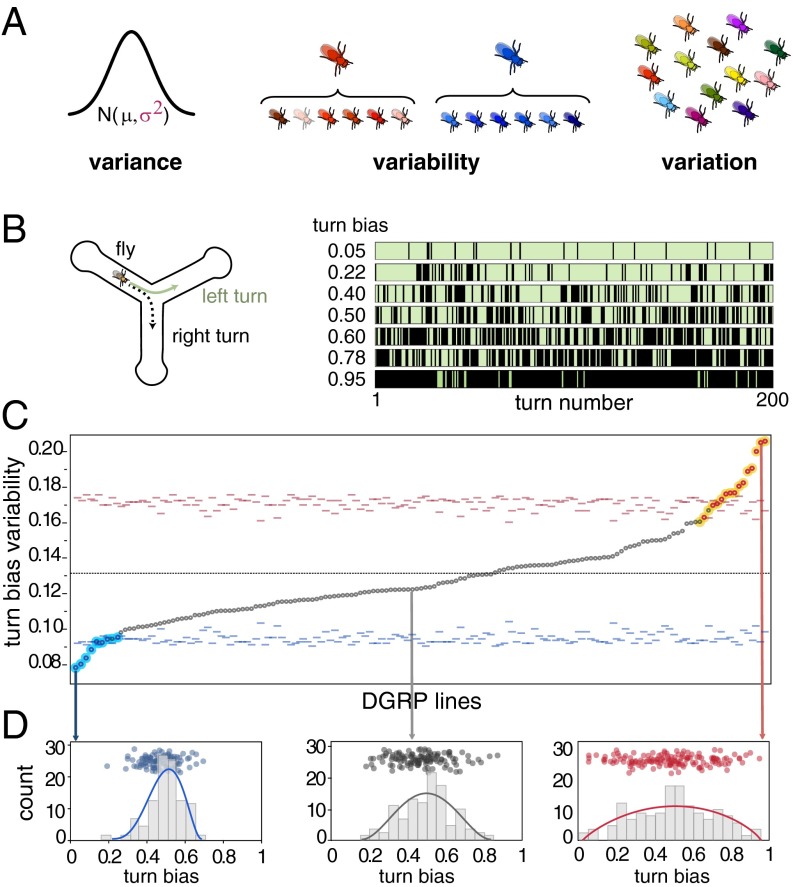
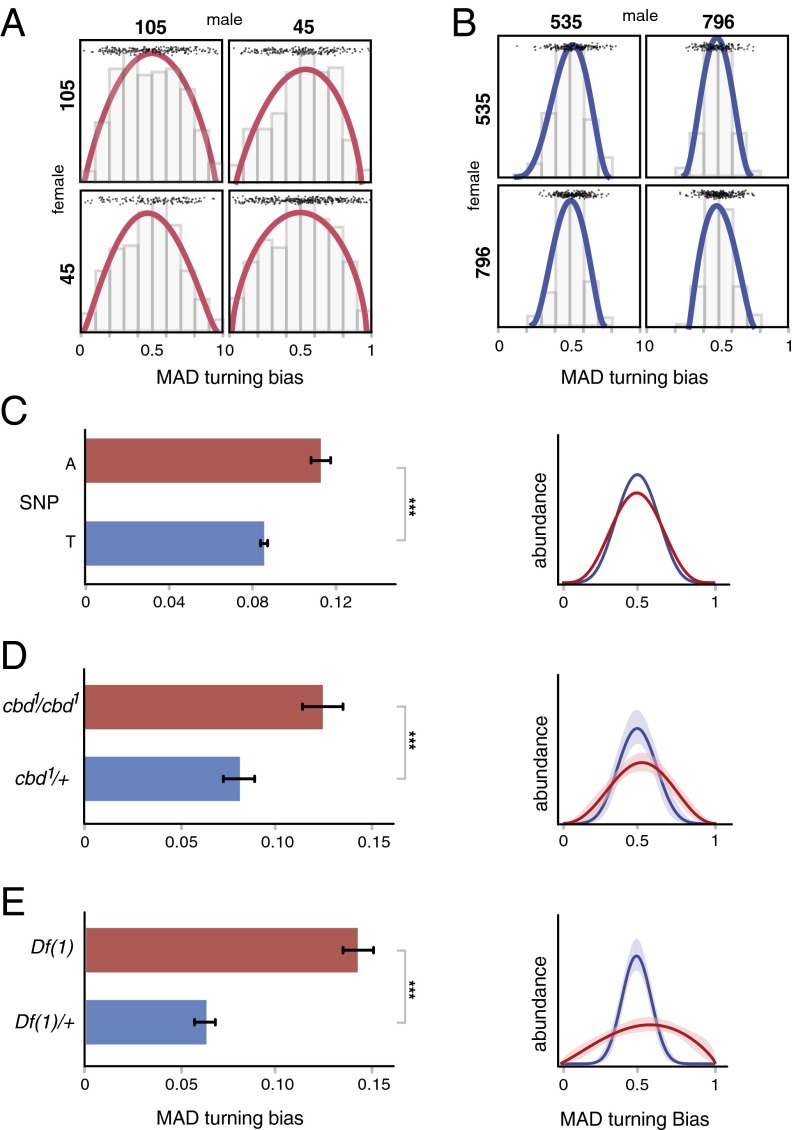
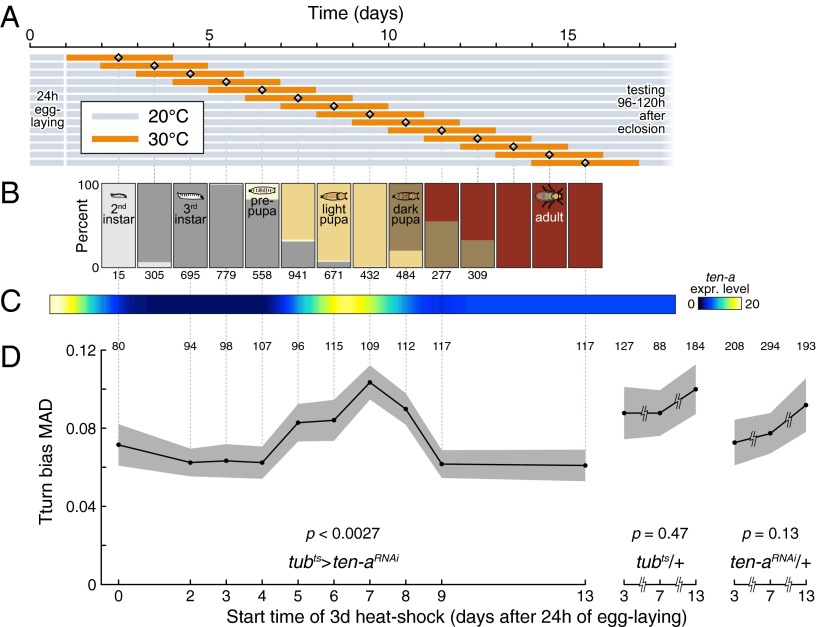
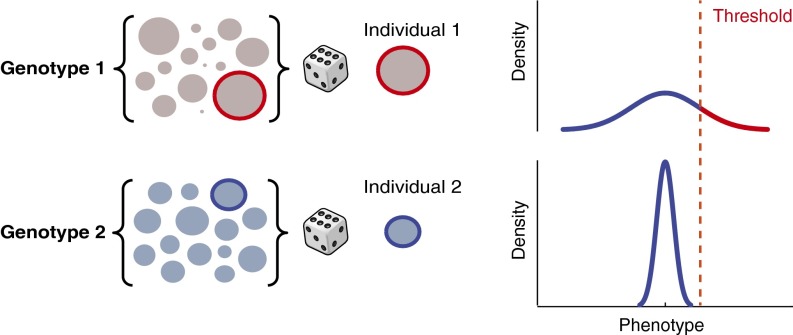
Quantitative genetics has primarily focused on describing genetic effects on trait means and largely ignored the effect of alternative alleles on trait variability, potentially missing an important axis of genetic variation contributing to phenotypic differences among individuals. To study the genetic effects on individual-to-individual phenotypic variability (or intragenotypic variability), we used Drosophila inbred lines and measured the spontaneous locomotor behavior of flies walking individually in Y-shaped mazes, focusing on variability in locomotor handedness, an assay optimized to measure variability. We discovered that some lines had consistently high levels of intragenotypic variability among individuals, whereas lines with low variability behaved as although they tossed a coin at each left/right turn decision. We demonstrate that the degree of variability is itself heritable. Using a genome-wide association study (GWAS) for the degree of intragenotypic variability as the phenotype across lines, we identified several genes expressed in the brain that affect variability in handedness without affecting the mean. One of these genes, Ten-a, implicates a neuropil in the central complex of the fly brain as influencing the magnitude of behavioral variability, a brain region involved in sensory integration and locomotor coordination. We validated these results using genetic deficiencies, null alleles, and inducible RNAi transgenes. Our study reveals the constellation of phenotypes that can arise from a single genotype and shows that different genetic backgrounds differ dramatically in their propensity for phenotypic variabililty. Because traditional mean-focused GWASs ignore the contribution of variability to overall phenotypic variation, current methods may miss important links between genotype and phenotype.

Keywords: DGRP; personality; ten-a; variability; variance QTL.


Conflict of interest statement

The authors declare no conflict of interest.

Figures

Fig. 1.
Fig. 1.
Intragenotypic variability of locomotor handedness varies across DGRP lines. (A) The similarity between concepts of variance, variation, and variability may lead to some confusion. Variance is used to describe the standard statistical dispersion parameter (σ2) or estimates of it derived from observations (s2). Variability refers to the potential of an organism or genotype to vary phenotypically, phenotypic differences we could observe across clones of the same genotype (i.e., red fly = high variability genotype, blue fly = low variability genotype). Variation refers to the realized (observable) differences between individuals or genotypes. (B) Diagram of the Y-maze used to quantify individual locomotor behavior. Plot at right illustrates 200 sequential turns for seven representative individual flies. A turn bias of 0.05 indicates that this particular fly turned right 5% of the time (black stripes indicate right turns and green stripes left turns). (C) Sorted distribution of the SDs of within-line individual turn bias for 159 DGRP lines. Red and blue filled dots are significant, exceeding their corresponding tick-marked 99.9% Cis, estimated by permutation. See Table S1 for experimental sample sizes. Cyan and yellow highlighted dots are significant at P < 0.001 based on nonparametric bootstrap. (D) Distributions of turning bias across individuals for three representative DGRP lines with low, intermediate, and high intragenotypic variability. Each dot represents the turning bias of a single fly within that line. Lines are β distribution fits, chosen because they model overdispersed binomial distributions.
Fig. 2.
Fig. 2.
Intragenotypic variability for turning bias is heritable. Effect of a Ten-a mutation on intragenotypic variability. (A) Distribution of F1 turn biases resulting from high variance line 105 reciprocally crossed to high variance line 45 (Brown-Forsythe, P = 0.08; n105 × 105 = 235; n45 × 45; = 315; n105 × 45 = 223; n45 × 105 = 135). (B) Distribution of F1 turn biases resulting from low variance line 535 reciprocally crossed to low line variance line 796 (Brown-Forsythe, P = 0.02; n535 × 535 = 197 n796 × 796 = 265; n796 × 535 = 160; n535 × 796 = 234). In both panels, the progeny are presented on the off diagonal. Lines are β distribution fits. Points are individual flies. For both A and B, P values comparing F1 to parents ranged from 0.14 to 0.99, uncorrected for multiple comparisons. (C) Intragenotypic variability (MAD) in turn bias of flies harboring alternative alleles of the Ten-a SNP identified in our GWAS (n = 159; GWAS, P < 3 × 10⁻⁶; phenotypic variance explained by this polymorphism: R2 = 19.5%). (D) Turn bias MAD of a homozygous Ten-a null allele (cbd1; red) and heterozygous control (blue). bk indicates the Ten-a+ genetic background Berlin-K. ncbd1/bk = 59, ncbd1/cbd1 = 99; Brown-Forsythe, P = 0.0074; bootstrapping, P < 0.001. (E) Turn bias MAD of a line bearing a homozygous deficiency overlapping Ten-a (red) and heterozygous control (blue). nDf(1)-bk = 100, nDf(1)Ten-a = 97; Brown-Forsythe, P = 1.5−11; bootstrapping, P < 0.001. ***P < 0.001. Right plots in all panels are corresponding β distribution fits of the distribution of turn bias scores within each experimental group. Shaded regions are 95% CIs on the β fits, estimated by bootstrap resampling; CIs in A are small compared with line thickness. Error bars are ±SE estimated by bootstrap resampling.
Fig. 3.
Fig. 3.
Disruption of Ten-a expression in midpupa affects behavioral variance. (A) Time courses of sliding window Ten-a RNAi induction. Flies laid eggs for 24 h prior the start of the experiment and were reared at 20 °C (gray) until 3 d of RNAi induction at 30 °C (orange). Flies were then returned to 20 °C until they were tested 3–5 d after eclosion. (B) Fraction of flies at any developmental stage during the course of the experiment. Numbers indicate sample sizes. (C) Ten-a expression level over development. Expression level derived from modENCODE. (D) Effect of temperature-inducible Ten-a RNAi on the variability of turning bias over development. Knockdown effect varied significantly with the timing of the induction window (P = 0.0027) estimated by a bootstrapping omnibus test (SI Text), with a knockdown starting on day 7 greatly increasing variability. This knockdown window coincides with the peak of Ten-a expression during pupation. Gray regions represent ±SE, estimated by bootstrapping. To the right, the controls, tubts/+ and Ten-aRNAi/+, measured after 3-d, 30 °C windows starting on days 3, 7, and 13, show no effect (P < 0.47 and P < 0.13, respectively). Numbers above data indicate sample sizes. Vertical guide lines associate data points across panels.
Fig. 4.
Fig. 4.
Consequences of intragenotypic variability on the fraction of a hypothetical population exceeding a disease threshold. Visual representation of the effects of variance on the prevalence of phenotypes exceeding a threshold, such as a disease state. Genotypes 1 and 2 differ in their degree of intragenotypic variability. The sets of circles at the left represent the range of possible outcomes for each genotype. Generally, each individual in an outbred diploid organism is a unique instance of its genotype. By contrast, our experiments with inbred lines allow us to consider multiple individuals from the same distribution. An individual drawn at random from genotype 1 (high variability) may land in the tail of the distribution, potentially in disease space. On the other hand, an individual drawn randomly from genotype 2 never gets a chance to explore the phenotypic space explored by genotype 1, even if it is just as much of an outlier within its respective distribution.

References

    1. Lynch M, Walsh B (1998) Genetics and Analysis of Quantitative Traits (Sinauer Associates, Sunderland, MA), 1st Ed.
    1. Hill WG, Mulder HA. Genetic analysis of environmental variation. Genet Res. 2010;92(5-6):381–395. - PubMed
    1. Yang J, et al. FTO genotype is associated with phenotypic variability of body mass index. Nature. 2012;490(7419):267–272. - PMC - PubMed
    1. Shen X, Pettersson M, Rönnegård L, Carlborg Ö. Inheritance beyond plain heritability: Variance-controlling genes in Arabidopsis thaliana. PLoS Genet. 2012;8(8):e1002839. - PMC - PubMed
    1. Dworkin I. A study of canalization and developmental stability in the sternopleural bristle system of Drosophila melanogaster. Evolution. 2005;59(7):1500–1509. - PubMed

Publication types

MeSH terms