. 2015 May 26;112(21):6730-5.
doi: 10.1073/pnas.1423328112. Epub 2015 May 7.

Optogenetic and pharmacological suppression of spatial clusters of face neurons reveal their causal role in face gender discrimination

Affiliations

Optogenetic and pharmacological suppression of spatial clusters of face neurons reveal their causal role in face gender discrimination

Arash Afraz et al. Proc Natl Acad Sci U S A. .

Abstract

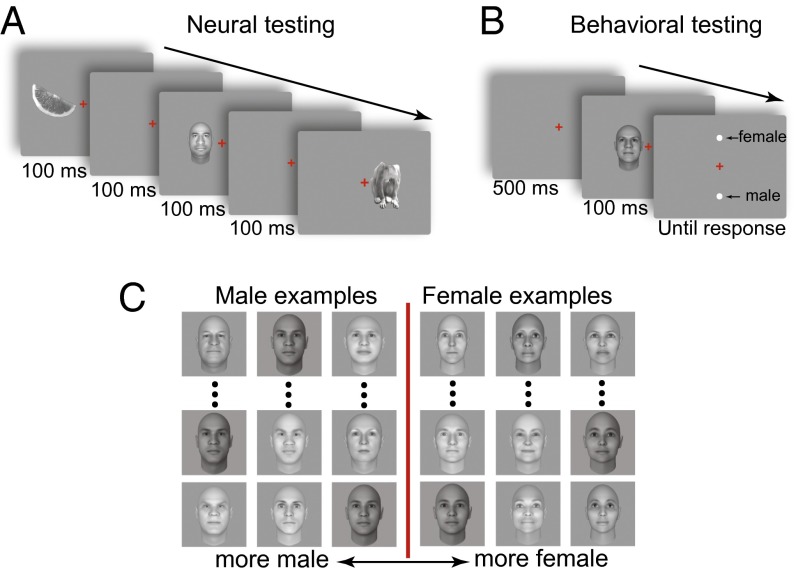
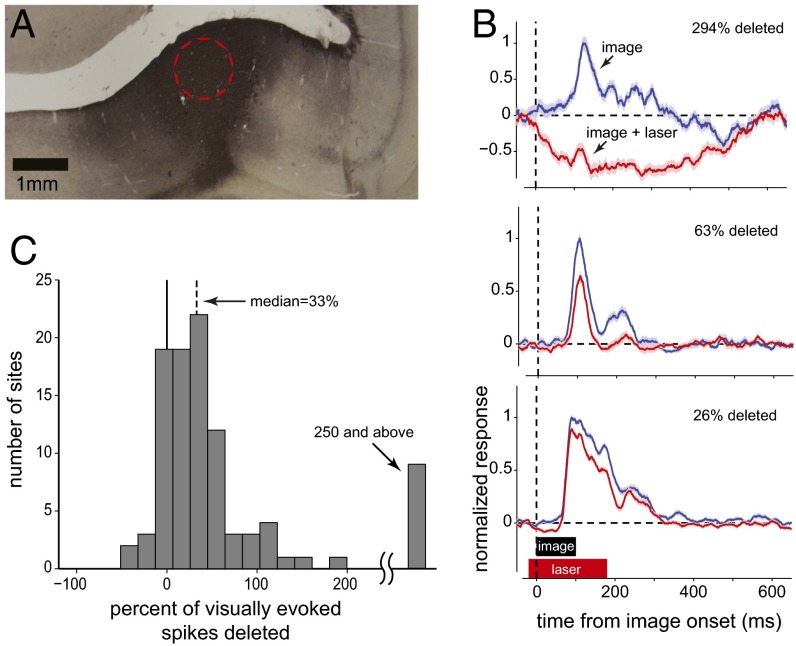
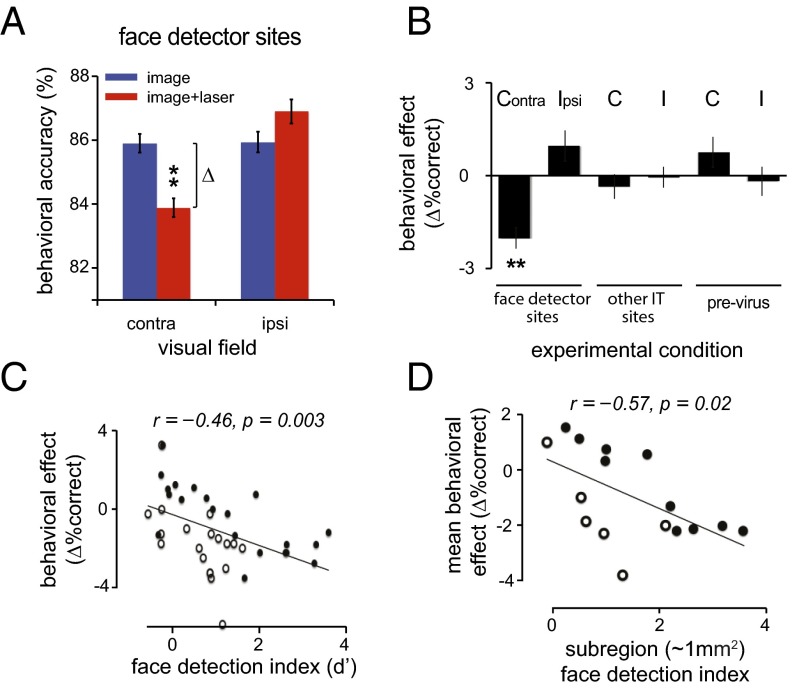
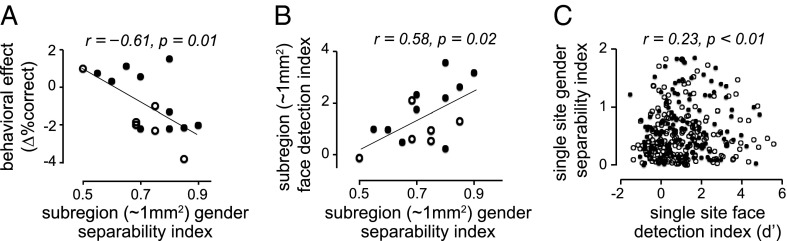
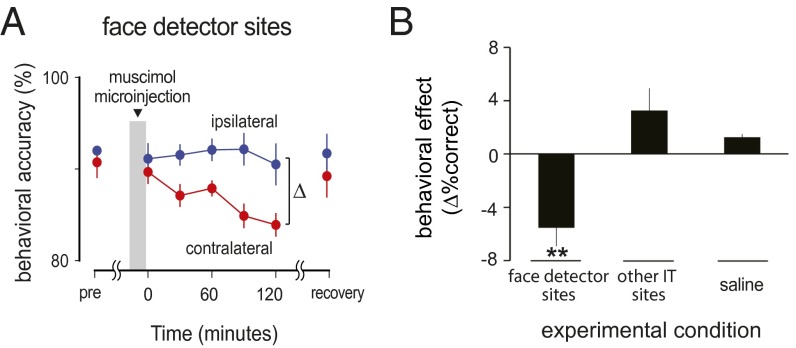
Neurons that respond more to images of faces over nonface objects were identified in the inferior temporal (IT) cortex of primates three decades ago. Although it is hypothesized that perceptual discrimination between faces depends on the neural activity of IT subregions enriched with "face neurons," such a causal link has not been directly established. Here, using optogenetic and pharmacological methods, we reversibly suppressed the neural activity in small subregions of IT cortex of macaque monkeys performing a facial gender-discrimination task. Each type of intervention independently demonstrated that suppression of IT subregions enriched in face neurons induced a contralateral deficit in face gender-discrimination behavior. The same neural suppression of other IT subregions produced no detectable change in behavior. These results establish a causal link between the neural activity in IT face neuron subregions and face gender-discrimination behavior. Also, the demonstration that brief neural suppression of specific spatial subregions of IT induces behavioral effects opens the door for applying the technical advantages of optogenetics to a systematic attack on the causal relationship between IT cortex and high-level visual perception.

Keywords: face; gender discrimination; inferior temporal cortex; object recognition; optogenetics.


Conflict of interest statement

Conflict of interest statement: E.S.B. is an inventor on multiple patents covering optogenetic tools.

Figures

Fig. 1.
Fig. 1.
Behavioral tasks and stimuli. (A) Passive fixation task. For neural response testing, each animal maintained fixation at the center of the display while images of faces, bodies, and other objects were presented 20 times in random order in an RSVP paradigm. The objects were restricted in an imaginary ∼4° x 6° window and presented at 2.15° to the left or right of the center of gaze. (B) Face gender-discrimination task. In each trial, the animals fixated on a central spot for 500 ms, then a stimulus appeared to the left or right of the fixation point (2.15° eccentricity) for 100 ms, followed by two response targets. To receive reward, the animals had to make a saccade to one of the two fixed response targets to report the facial gender of the stimulus. (C) The stimulus set for the gender-discrimination task included 400 grayscale computer-generated faces (FaceGen; 18 are shown here). The visual appearance (age, race, and other structural features) of the stimuli varied in each group (see examples), but the morphing “gender signal” (horizontal axis) was held at a level to keep the animal at 85–95% correct.
Fig. 2.
Fig. 2.
Neural effects of optogenetic perturbation of the IT cortex. (A) Virus transduction zone. A section of monkey STS transduced (∼8 months before euthanasia) with AAV-delivered ArchT–GFP, stained with anti-GFP antibody (dark region), is shown. The dashed circle shows the size of the estimated effective suppression zone for a single optical fiber. (B) Examples of optogenetic neural suppression observed at different sites in the IT cortex. Blue lines show multiunit response (median of 60 repeated presentations) to the site’s preferred image (100 ms; black bar) obtained during RSVP. Red lines show mean response to the same visual image, but with the laser light also delivered to the site (200-ms duration; red bar). Laser-on presentations were randomly interleaved with regular image presentations. Pink and light-blue shadings show ±1 SE. The numbers next to each subplot indicate percentage of visually evoked spikes deleted by light (with respect to the site’s baseline spiking rate; dashed line). (C) Distribution of optogenetic suppression of all visually driven IT sites that were tested for light sensitivity (n = 99). Percent of visually evoked spikes deleted is defined as 100 x (RRL)/R, where R is the baseline subtracted multiunit response to the preferred stimulus (50- to 250-ms temporal window), and RL is the same with laser on.
Fig. 3.
Fig. 3.
Behavioral effects of optogenetic suppression of local IT neural activity. (A) Face-detector sites. Shown is the mean behavioral effect of photosuppression applied at high-FD cortical sites (penetrations with face-detection index > 1). The ordinate shows the behavioral accuracy of the animals on the gender-discrimination task. The abscissa indicates the VF in which the stimulus was presented. All four trial types were randomly interleaved. (B) The behavioral effect of cortical illumination for various experimental conditions tested for images presented in the contralateral (C) and ipsilateral (I) VF. The ordinate depicts the behavioral effect (change in the behavioral accuracy for the gender-discrimination task; see A). Face-detector sites, summarizes the data already shown in A; other IT sites, same for low-FD sites (face-detection index < 1) with equivalent neural suppression (see text); pre-virus, same for high-FD IT sites before viral injection. Error bars show ±1 SE. **P < 0.01. (C) Behavioral effect of photosuppression for all experimental sessions after the viral injection. The abscissa shows the face-detection index of the targeted site. The ordinate indicates the photo-induced behavioral effect for contralaterally presented images. Each data point shows an experiment session. (D) Behavioral effect of photosuppression pooled for small (∼1 mm2) subregions of IT cortex (see text). In C and D, open and closed circles depict the data from monkeys E and C, respectively.
Fig. 4.
Fig. 4.
Explicit encoding of facial gender in CIT. (A) The relationship between explicit neural encoding of facial gender in various IT subregions and the effect of photosuppression of those subregions on face gender-discrimination behavior. The abscissa shows, for each IT subregion, the gender classification performance of a linear classifier trained and tested (independent image presentations) on all sites collected within that subregion (SI Methods). The ordinate shows the average impact of photosuppression of those subregions (pooled across multiple sessions) on the animals’ gender-discrimination performance for contralaterally presented images. (B) The relationship between explicit neural encoding of facial gender and average face-detection index (FD) over all tested IT subregions. The abscissa is the same as A. The ordinate shows the mean neural FD (d′) for all of the neurons recorded from each cortical subregion. (C) The relationship between neural encoding of facial gender and FD in all recorded IT sites (not pooled). The abscissa represents FD for all individual sites recorded in IT cortex, and the ordinate represents separability of the gender signal (defined as absolute d′ of the multiunit response for separating male and female stimuli) in the same sites (n = 353). Seven data points with ordinate values > 2 or abscissa values > 6 are not shown here for illustration purposes. Open and closed circles represent monkeys E and C, respectively.
Fig. 5.
Fig. 5.
Behavioral effect of drug microinjection in IT cortex. (A) Face-detector sites. The effect of muscimol injection centered over a high-FD subregion of IT cortex on gender-discrimination performance is shown. The ordinate represents the animals’ mean behavioral accuracy for the gender-discrimination task. The abscissa represents time. The gray band indicates the duration of muscimol microinjection. The red and blue lines show the behavioral performance for contralaterally and ipsilaterally presented images, respectively. (B) Behavioral effect of drug microinjection for various experimental conditions. The ordinate depicts the difference of behavioral accuracy between the ipsilateral and contralateral VFs averaged for all data points collected after 1 h from the end of microinjection. Face-detector sites, summarizes data shown in A (n = 6 microinjections); other IT sites, microinjections away from high-FD subregions of IT (n = 6); saline, microinjection of saline in high-FD subregion (n = 2). Error bars show ±1 SE. **P < 0.01.

References

    1. Gross CG. Processing the facial image: A brief history. Am Psychol. 2005;60(8):755–763. - PubMed
    1. Busigny T, Graf M, Mayer E, Rossion B. Acquired prosopagnosia as a face-specific disorder: Ruling out the general visual similarity account. Neuropsychologia. 2010;48(7):2051–2067. - PubMed
    1. Susilo T, Duchaine B. Advances in developmental prosopagnosia research. Curr Opin Neurobiol. 2013;23(3):423–429. - PubMed
    1. Towler J, Eimer M. Electrophysiological studies of face processing in developmental prosopagnosia: Neuropsychological and neurodevelopmental perspectives. Cogn Neuropsychol. 2012;29(5-6):503–529. - PubMed
    1. Pitcher D, Garrido L, Walsh V, Duchaine BC. Transcranial magnetic stimulation disrupts the perception and embodiment of facial expressions. J Neurosci. 2008;28(36):8929–8933. - PMC - PubMed

Publication types

LinkOut - more resources