

Genetic Variability Under the Seedbank Coalescent
- PMID: 25953769
- PMCID: PMC4512552
- DOI: 10.1534/genetics.115.176818
Genetic Variability Under the Seedbank Coalescent
Abstract
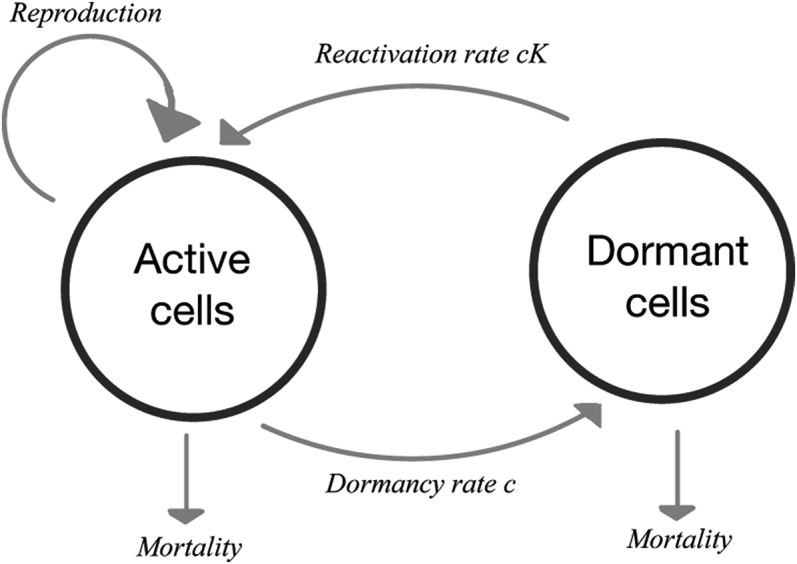
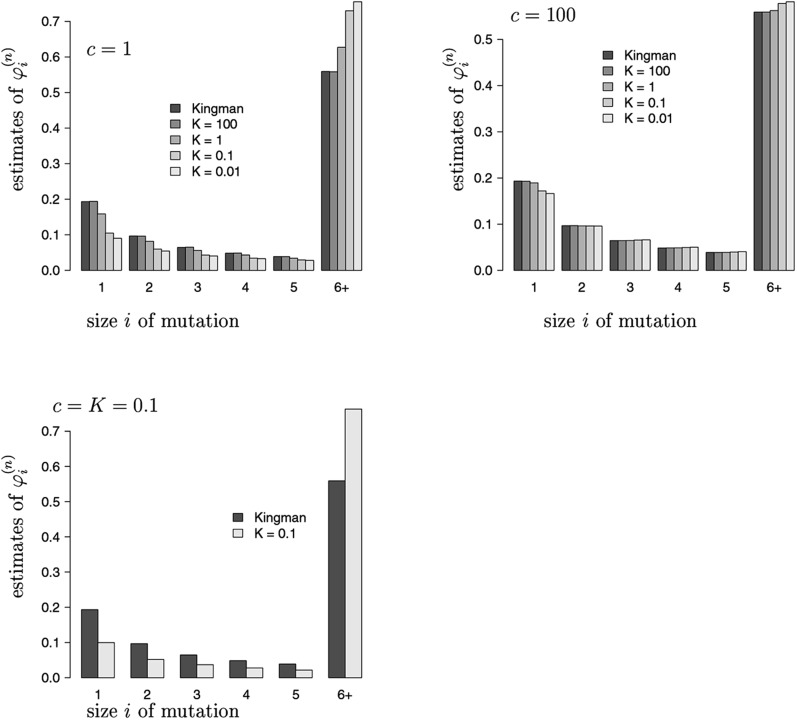
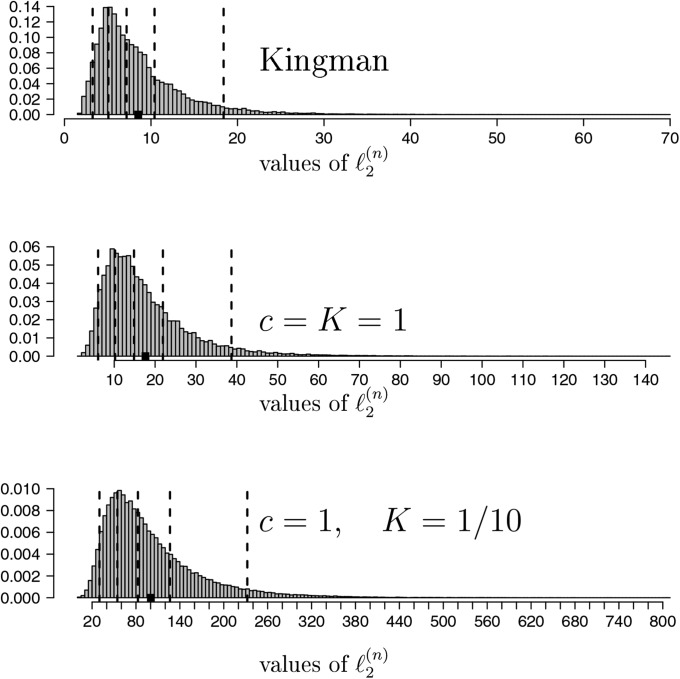
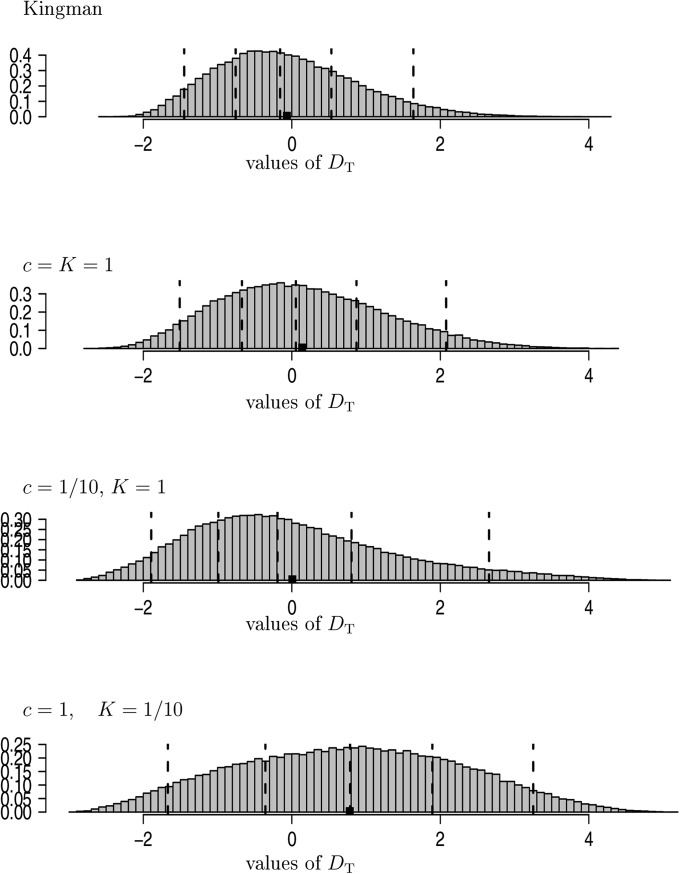
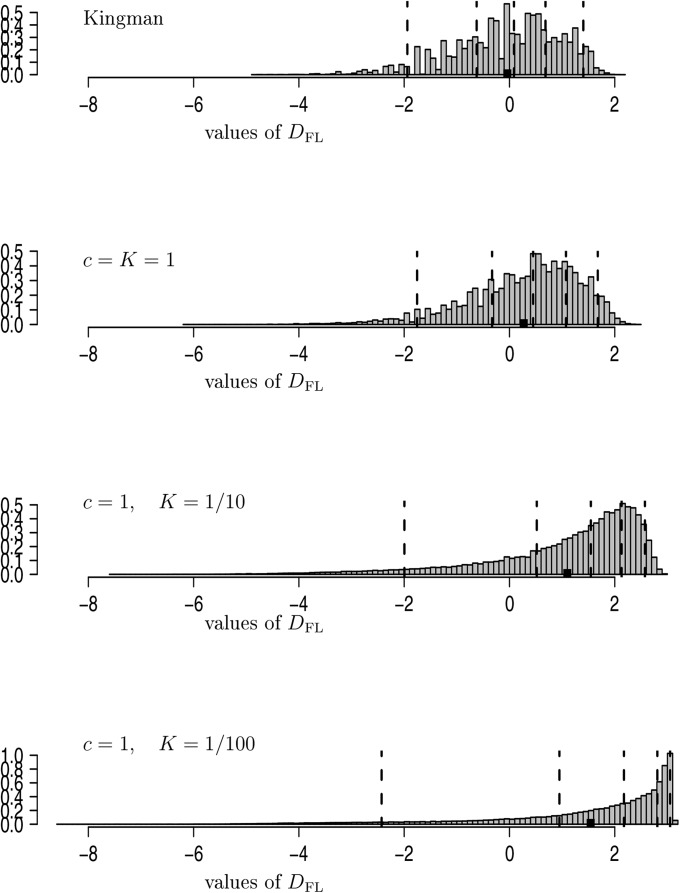
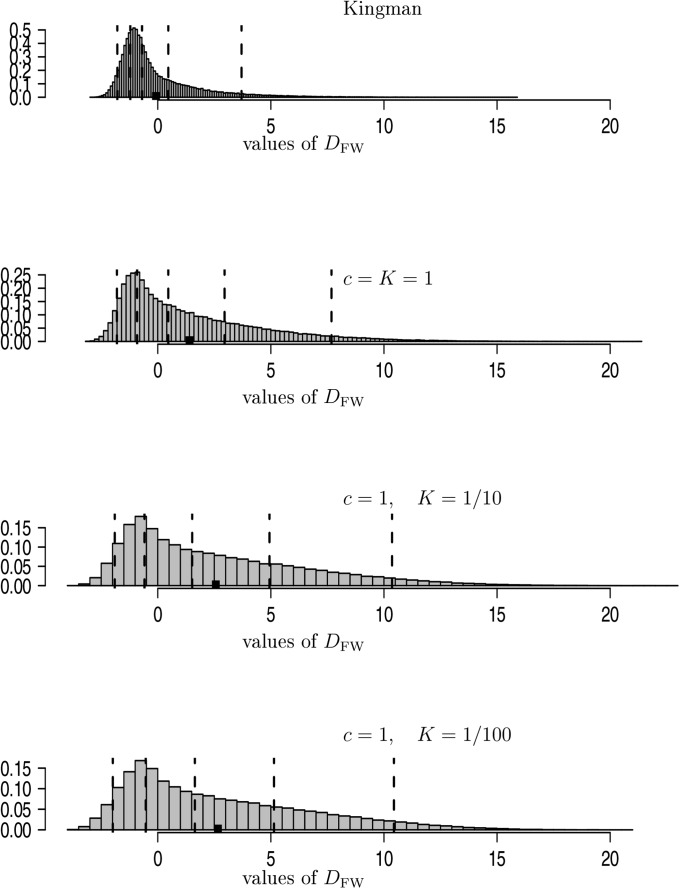
We analyze patterns of genetic variability of populations in the presence of a large seedbank with the help of a new coalescent structure called the seedbank coalescent. This ancestral process appears naturally as a scaling limit of the genealogy of large populations that sustain seedbanks, if the seedbank size and individual dormancy times are of the same order as those of the active population. Mutations appear as Poisson processes on the active lineages and potentially at reduced rate also on the dormant lineages. The presence of "dormant" lineages leads to qualitatively altered times to the most recent common ancestor and nonclassical patterns of genetic diversity. To illustrate this we provide a Wright-Fisher model with a seedbank component and mutation, motivated from recent models of microbial dormancy, whose genealogy can be described by the seedbank coalescent. Based on our coalescent model, we derive recursions for the expectation and variance of the time to most recent common ancestor, number of segregating sites, pairwise differences, and singletons. Estimates (obtained by simulations) of the distributions of commonly employed distance statistics, in the presence and absence of a seedbank, are compared. The effect of a seedbank on the expected site-frequency spectrum is also investigated using simulations. Our results indicate that the presence of a large seedbank considerably alters the distribution of some distance statistics, as well as the site-frequency spectrum. Thus, one should be able to detect from genetic data the presence of a large seedbank in natural populations.
Keywords: Wright–Fisher model; distance statistics; dormancy; seedbank coalescent; site-frequency spectrum.
Copyright © 2015 by the Genetics Society of America.
Figures
References
-
- Blath J., González Casanova A., Kurt N., Spanò D., 2013. The ancestral process of long-range seed bank models. J. Appl. Probab. 50: 741–759.
-
- Blath, J., B. Eldon, A. Casanova, and N. Kurt, 2015a Genealogy of a Wright Fisher model with strong seed bank component, in XI Symposium on Probability and Stochastic Processes, Progress in Probability, edited by R. Mena, J. C. Pardo, V. Rivero, and G. Uribe Bravo. Birkhäuser, Basel, Switzerland (in press).
-
- Blath J., Gonzalez-Casanova A., Kurt N., Wilke-Berenguer M., 2015b The seed-bank coalescent. Ann. Appl. Probab. (in press).
-
- Cannings C., 1974. The latent roots of certain Markov chains arising in genetics: a new approach, I. Haploid models. Adv. Appl. Probab. 6: 260–290.
Publication types
MeSH terms
LinkOut - more resources
Full Text Sources
Other Literature Sources
