

A genome-wide association study of body mass index across early life and childhood
- PMID: 25953783
- PMCID: PMC4469798
- DOI: 10.1093/ije/dyv077
A genome-wide association study of body mass index across early life and childhood
Abstract
Background: Several studies have investigated the effect of known adult body mass index (BMI) associated single nucleotide polymorphisms (SNPs) on BMI in childhood. There has been no genome-wide association study (GWAS) of BMI trajectories over childhood.
Methods: We conducted a GWAS meta-analysis of BMI trajectories from 1 to 17 years of age in 9377 children (77,967 measurements) from the Avon Longitudinal Study of Parents and Children (ALSPAC) and the Western Australian Pregnancy Cohort (Raine) Study. Genome-wide significant loci were examined in a further 3918 individuals (48,530 measurements) from Northern Finland. Linear mixed effects models with smoothing splines were used in each cohort for longitudinal modelling of BMI.
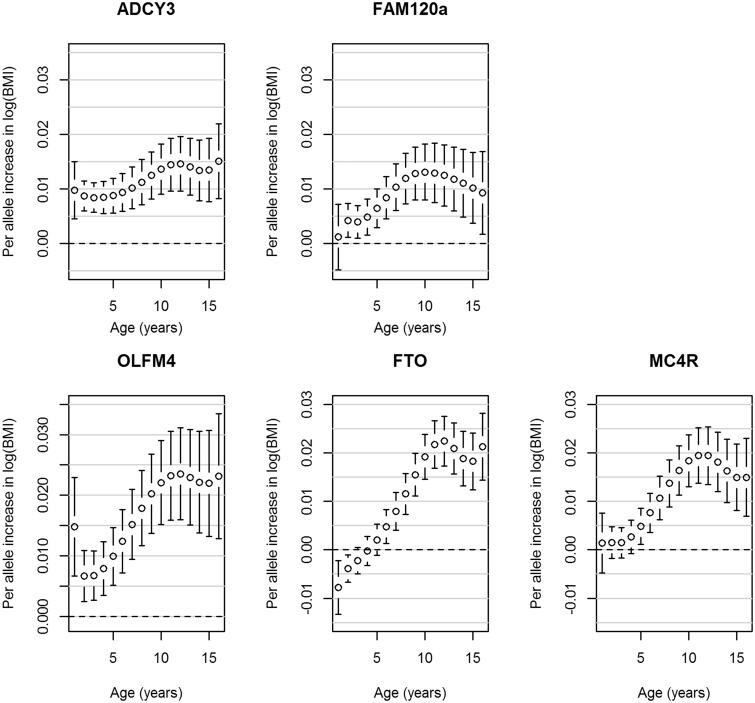
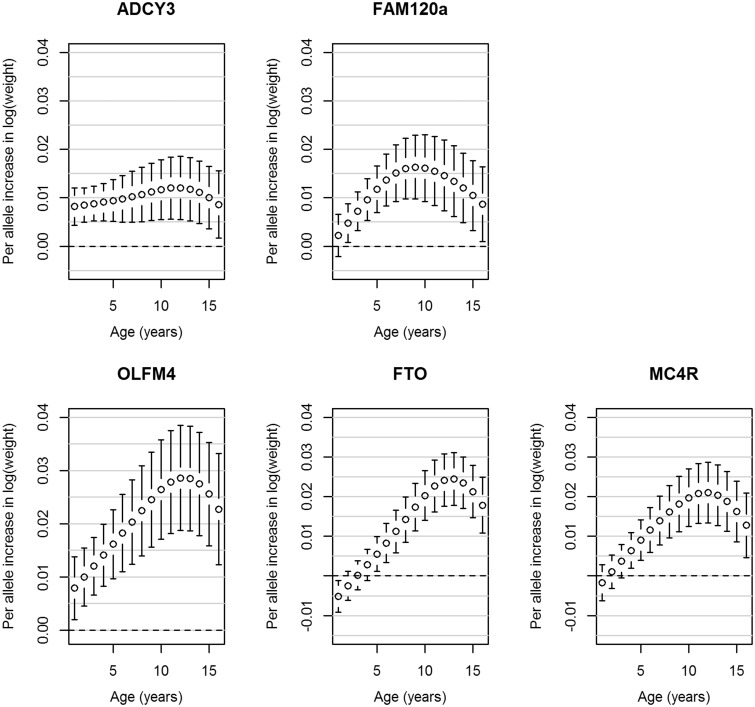
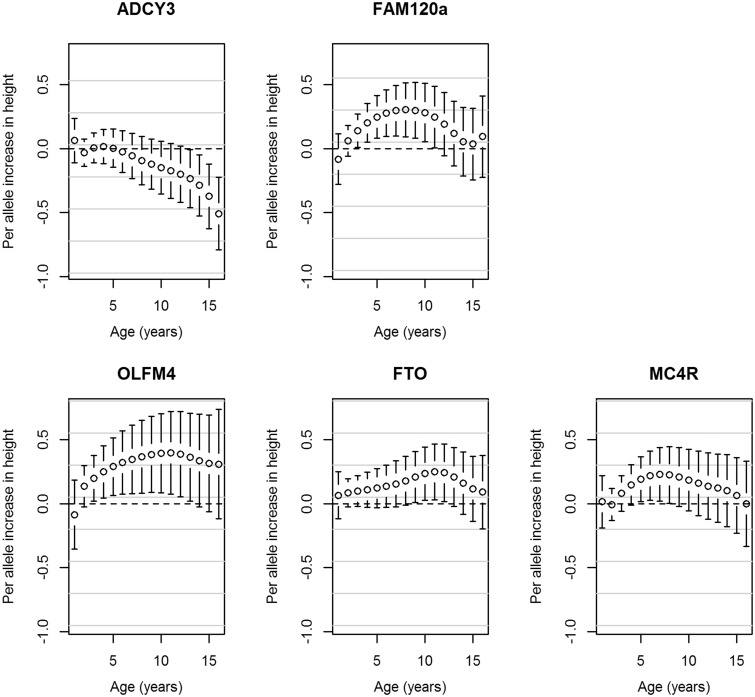
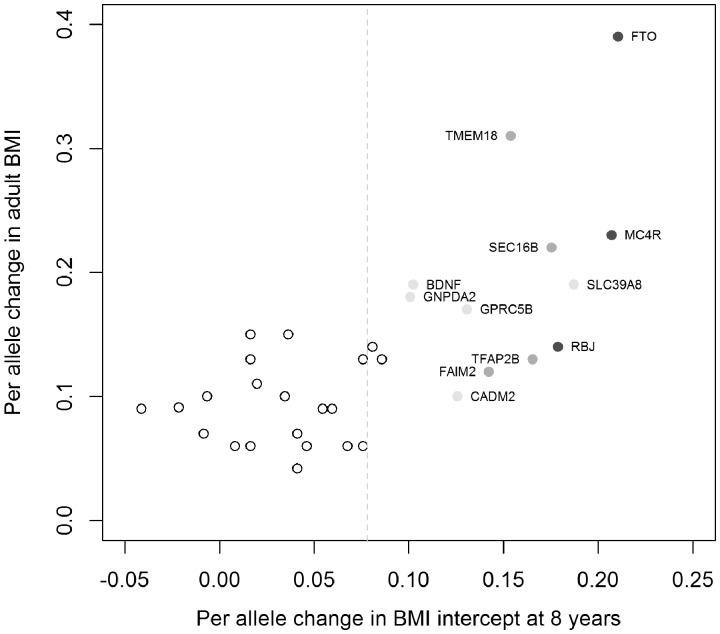
Results: A novel SNP, downstream from the FAM120AOS gene on chromosome 9, was detected in the meta-analysis of ALSPAC and Raine. This association was driven by a difference in BMI at 8 years (T allele of rs944990 increased BMI; PSNP = 1.52 × 10(-8)), with a modest association with change in BMI over time (PWald(Change) = 0.006). Three known adult BMI-associated loci (FTO, MC4R and ADCY3) and one childhood obesity locus (OLFM4) reached genome-wide significance (PWald < 1.13 × 10(-8)) with BMI at 8 years and/or change over time.
Conclusions: This GWAS of BMI trajectories over childhood identified a novel locus that warrants further investigation. We also observed genome-wide significance with previously established obesity loci, making the novel observation that these loci affected both the level and the rate of change in BMI. We have demonstrated that the use of repeated measures data can increase power to allow detection of genetic loci with smaller sample sizes.
Keywords: ALSPAC; Body mass index; Raine; childhood; genome-wide association study; trajectory.
© The Author 2015; all rights reserved. Published by Oxford University Press on behalf of the International Epidemiological Association.
Figures

References
-
- Wellman NS, Friedberg B. Causes and consequences of adult obesity: health, social and economic impacts in the United States. Asia Pac J Clin Nutr 2002;119(Suppl 8):S705–09.
-
- Ben-Shlomo Y, Kuh D. A life course approach to chronic disease epidemiology: conceptual models, empirical challenges and interdisciplinary perspectives. Int J Epidemiol 2002;31:285–93. - PubMed
-
- Newnham JP, Pennell CE, Lye SJ, Rampono J, Challis JR. Early life origins of obesity. Obstet Gynecol Clin North Am 2009;36:227–44, xii. - PubMed
Publication types
MeSH terms
Substances
Grants and funding
- R01 MH063706/MH/NIMH NIH HHS/United States
- R01 HL087679/HL/NHLBI NIH HHS/United States
- MC_UU_12013/3/MRC_/Medical Research Council/United Kingdom
- 5R01MH63706:02/MH/NIMH NIH HHS/United States
- 102215/WT_/Wellcome Trust/United Kingdom
- MC_PC_15018/MRC_/Medical Research Council/United Kingdom
- MC_UU_12013/1/MRC_/Medical Research Council/United Kingdom
- MC_UU_12013/4/MRC_/Medical Research Council/United Kingdom
- G1002375/MRC_/Medical Research Council/United Kingdom
- MC_UU_12013/5/MRC_/Medical Research Council/United Kingdom
- 102215/2/13/2)/WT_/Wellcome Trust/United Kingdom
- G0600705/MRC_/Medical Research Council/United Kingdom
- MR/J012165/1/MRC_/Medical Research Council/United Kingdom
- 1RL1MH083268-01/MH/NIMH NIH HHS/United States
- G0500539/MRC_/Medical Research Council/United Kingdom
- MC_UU_12013/9/MRC_/Medical Research Council/United Kingdom
- 5R01HL087679-02/HL/NHLBI NIH HHS/United States
- RL1 MH083268/MH/NIMH NIH HHS/United States
LinkOut - more resources
Full Text Sources
Other Literature Sources
Medical
Miscellaneous
