

Deletion of the PH-domain and Leucine-rich Repeat Protein Phosphatase 1 (Phlpp1) Increases Fibroblast Growth Factor (Fgf) 18 Expression and Promotes Chondrocyte Proliferation
- PMID: 25953896
- PMCID: PMC4481226
- DOI: 10.1074/jbc.M114.612937
Deletion of the PH-domain and Leucine-rich Repeat Protein Phosphatase 1 (Phlpp1) Increases Fibroblast Growth Factor (Fgf) 18 Expression and Promotes Chondrocyte Proliferation
Abstract
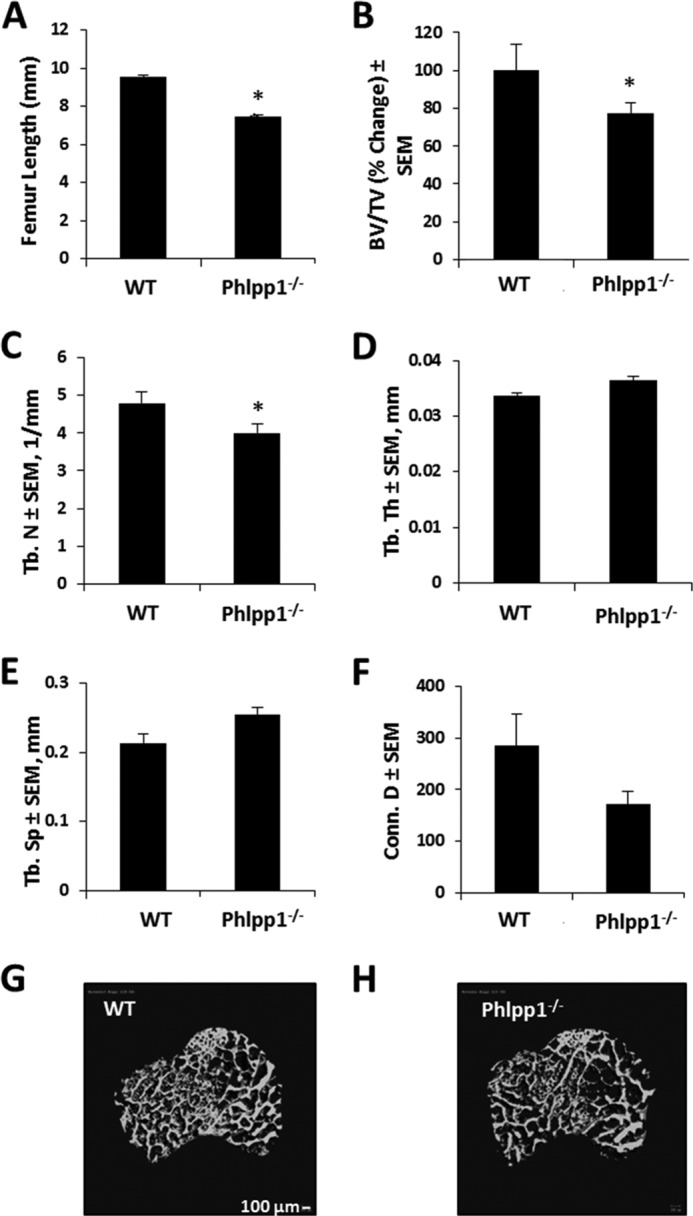
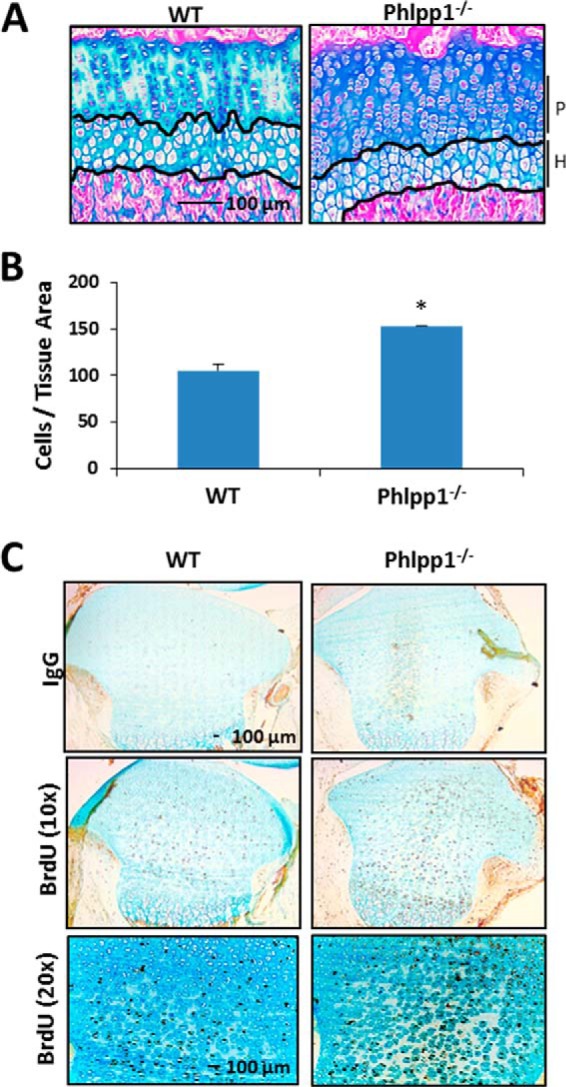
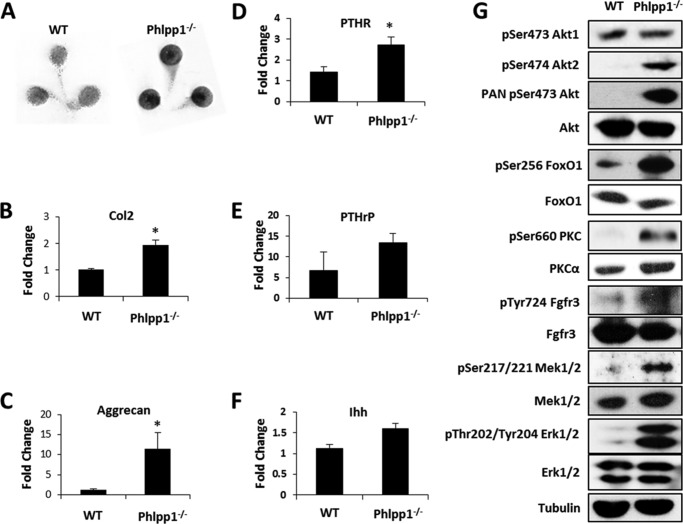
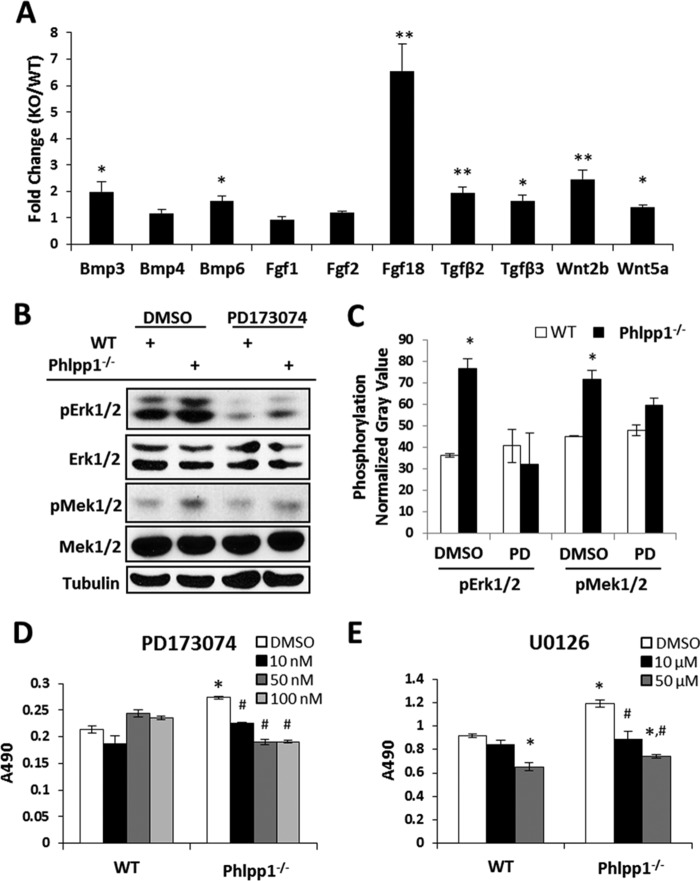
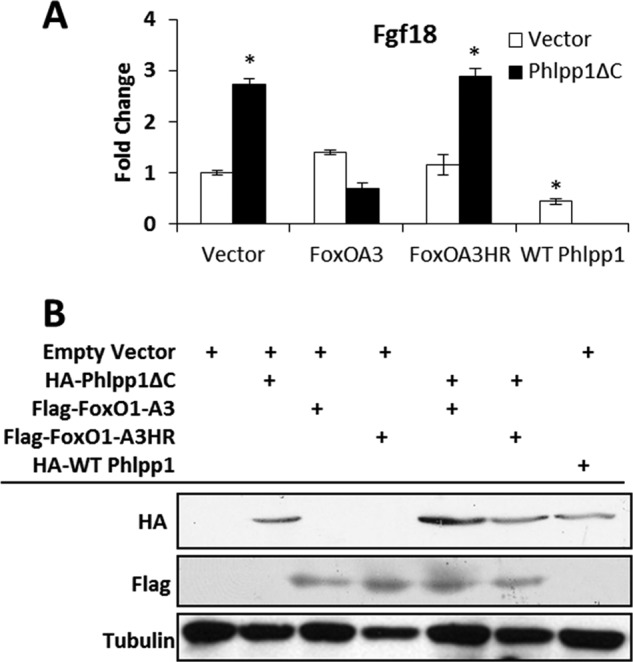
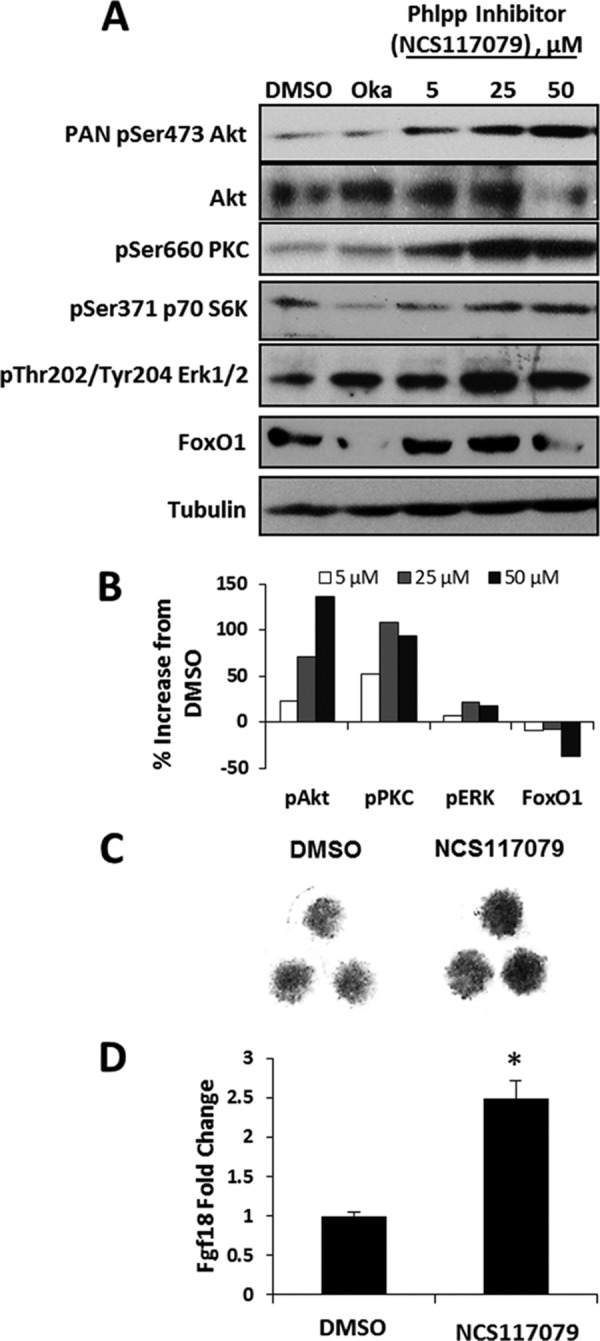
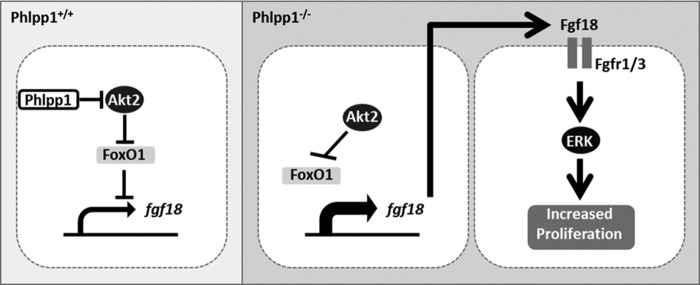
Endochondral ossification orchestrates formation of the vertebrate skeleton and is often induced during disease and repair processes of the musculoskeletal system. Here we show that the protein phosphatase Phlpp1 regulates endochondral ossification. Phlpp1 null mice exhibit decreased bone mass and notable changes in the growth plate, including increased BrdU incorporation and matrix production. Phosphorylation of known Phlpp1 substrates, Akt2, PKC, and p70 S6 kinase, were enhanced in ex vivo cultured Phlpp1(-/-) chondrocytes. Furthermore, Phlpp1 deficiency diminished FoxO1 levels leading to increased expression of Fgf18, Mek/Erk activity, and chondrocyte metabolic activity. Phlpp inhibitors also increased matrix content, Fgf18 production and Erk1/2 phosphorylation. Chemical inhibition of Fgfr-signaling abrogated elevated Erk1/2 phosphorylation and metabolic activity in Phlpp1-null cultures. These results demonstrate that Phlpp1 controls chondrogenesis via multiple mechanisms and that Phlpp1 inhibition could be a strategy to promote cartilage regeneration and repair.
Keywords: Akt PKB; FOXO; cartilage; fibroblast growth factor (FGF); fibroblast growth factor receptor (FGFR); osteoarthritis.
© 2015 by The American Society for Biochemistry and Molecular Biology, Inc.
Figures
Similar articles
-
Phlpp1 alters the murine chondrocyte phospho-proteome during endochondral bone formation.Bone. 2024 Dec;189:117265. doi: 10.1016/j.bone.2024.117265. Epub 2024 Sep 29. Bone. 2024. PMID: 39349089
-
Histone deacetylase 3 suppression increases PH domain and leucine-rich repeat phosphatase (Phlpp)1 expression in chondrocytes to suppress Akt signaling and matrix secretion.J Biol Chem. 2013 Apr 5;288(14):9572-9582. doi: 10.1074/jbc.M112.423723. Epub 2013 Feb 13. J Biol Chem. 2013. PMID: 23408427 Free PMC article.
-
Pleckstrin homology (PH) domain and Leucine Rich Repeat Phosphatase 1 (Phlpp1) Suppresses Parathyroid Hormone Receptor 1 (Pth1r) Expression and Signaling During Bone Growth.J Bone Miner Res. 2021 May;36(5):986-999. doi: 10.1002/jbmr.4248. Epub 2021 Feb 8. J Bone Miner Res. 2021. PMID: 33434347 Free PMC article.
-
PHLPPing through history: a decade in the life of PHLPP phosphatases.Biochem Soc Trans. 2016 Dec 15;44(6):1675-1682. doi: 10.1042/BST20160170. Biochem Soc Trans. 2016. PMID: 27913677 Free PMC article. Review.
-
PHLPP Signaling in Immune Cells.Curr Top Microbiol Immunol. 2022;436:117-143. doi: 10.1007/978-3-031-06566-8_5. Curr Top Microbiol Immunol. 2022. PMID: 36243842 Review.
Cited by
-
Identification of key gene modules and transcription factors for human osteoarthritis by weighted gene co-expression network analysis.Exp Ther Med. 2019 Oct;18(4):2479-2490. doi: 10.3892/etm.2019.7848. Epub 2019 Aug 5. Exp Ther Med. 2019. PMID: 31572500 Free PMC article.
-
Phlpp1 alters the murine chondrocyte phospho-proteome during endochondral bone formation.Bone. 2024 Dec;189:117265. doi: 10.1016/j.bone.2024.117265. Epub 2024 Sep 29. Bone. 2024. PMID: 39349089
-
Phlpp1 is associated with human intervertebral disc degeneration and its deficiency promotes healing after needle puncture injury in mice.Cell Death Dis. 2019 Oct 3;10(10):754. doi: 10.1038/s41419-019-1985-3. Cell Death Dis. 2019. PMID: 31582730 Free PMC article.
-
Phosphoproteomics of Fibroblast Growth Factor 1 (FGF1) Signaling in Chondrocytes: Identifying the Signature of Inhibitory Response.Mol Cell Proteomics. 2017 Jun;16(6):1126-1137. doi: 10.1074/mcp.M116.064980. Epub 2017 Mar 15. Mol Cell Proteomics. 2017. PMID: 28298517 Free PMC article.
-
PHLPP1 counter-regulates STAT1-mediated inflammatory signaling.Elife. 2019 Aug 13;8:e48609. doi: 10.7554/eLife.48609. Elife. 2019. PMID: 31408005 Free PMC article.
References
-
- Kronenberg H. M. (2003) Developmental regulation of the growth plate. Nature 423, 332–336 - PubMed
-
- Brown J. H., DeLuca S. A. (1992) Growth plate injuries: Salter-Harris classification. Am. Fam. Physician 46, 1180–1184 - PubMed
-
- Rimoin D. L., Cohn D., Krakow D., Wilcox W., Lachman R. S., Alanay Y. (2007) The skeletal dysplasias: clinical-molecular correlations. Ann. N.Y. Acad. Sci. 1117, 302–309 - PubMed
Publication types
MeSH terms
Substances
Grants and funding
- R01 GM067946/GM/NIGMS NIH HHS/United States
- K01 AR065397/AR/NIAMS NIH HHS/United States
- AR65397/AR/NIAMS NIH HHS/United States
- T32 AR056950/AR/NIAMS NIH HHS/United States
- AR68103/AR/NIAMS NIH HHS/United States
- R01 AR068103/AR/NIAMS NIH HHS/United States
- R25 GM055252/GM/NIGMS NIH HHS/United States
- GM067946/GM/NIGMS NIH HHS/United States
- AR056950/AR/NIAMS NIH HHS/United States
- F32 AR061873/AR/NIAMS NIH HHS/United States
- GM055252/GM/NIGMS NIH HHS/United States
- AR61873/AR/NIAMS NIH HHS/United States
- R56 AR068103/AR/NIAMS NIH HHS/United States
LinkOut - more resources
Full Text Sources
Molecular Biology Databases
Research Materials
Miscellaneous
