. 2015 May 8;348(6235):648-60.
doi: 10.1126/science.1262110. Epub 2015 May 7.

Human genomics. The Genotype-Tissue Expression (GTEx) pilot analysis: multitissue gene regulation in humans

Collaborators

Human genomics. The Genotype-Tissue Expression (GTEx) pilot analysis: multitissue gene regulation in humans

GTEx Consortium. Science. .

Abstract

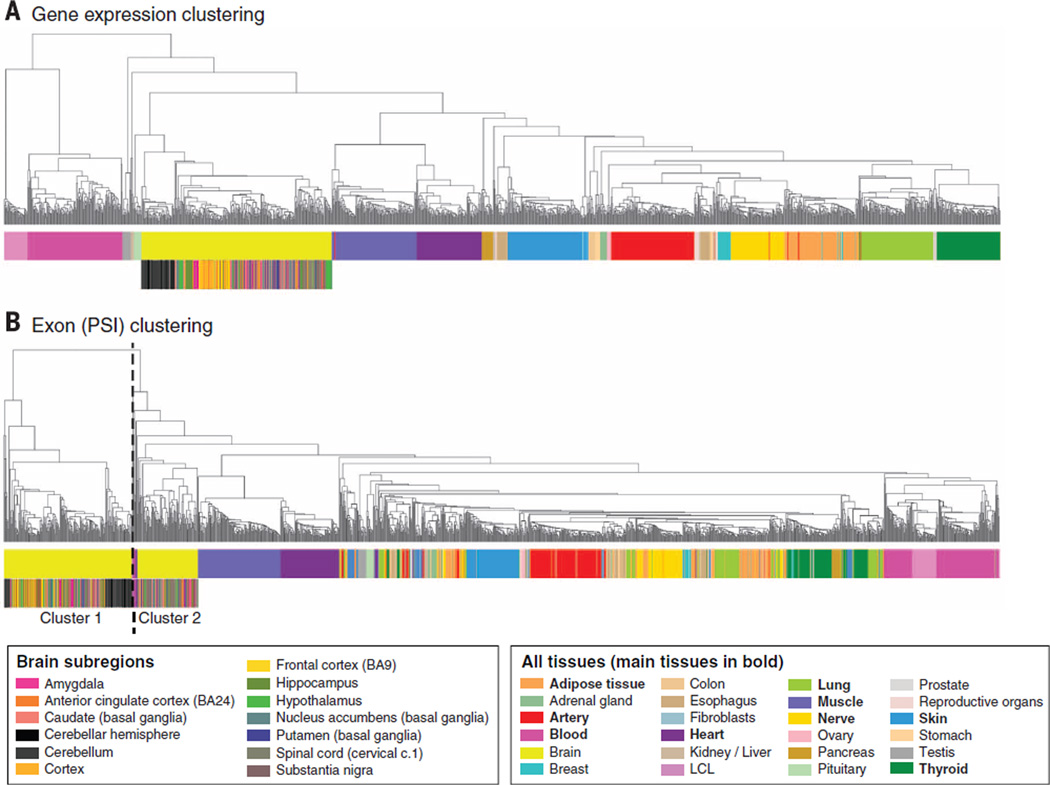
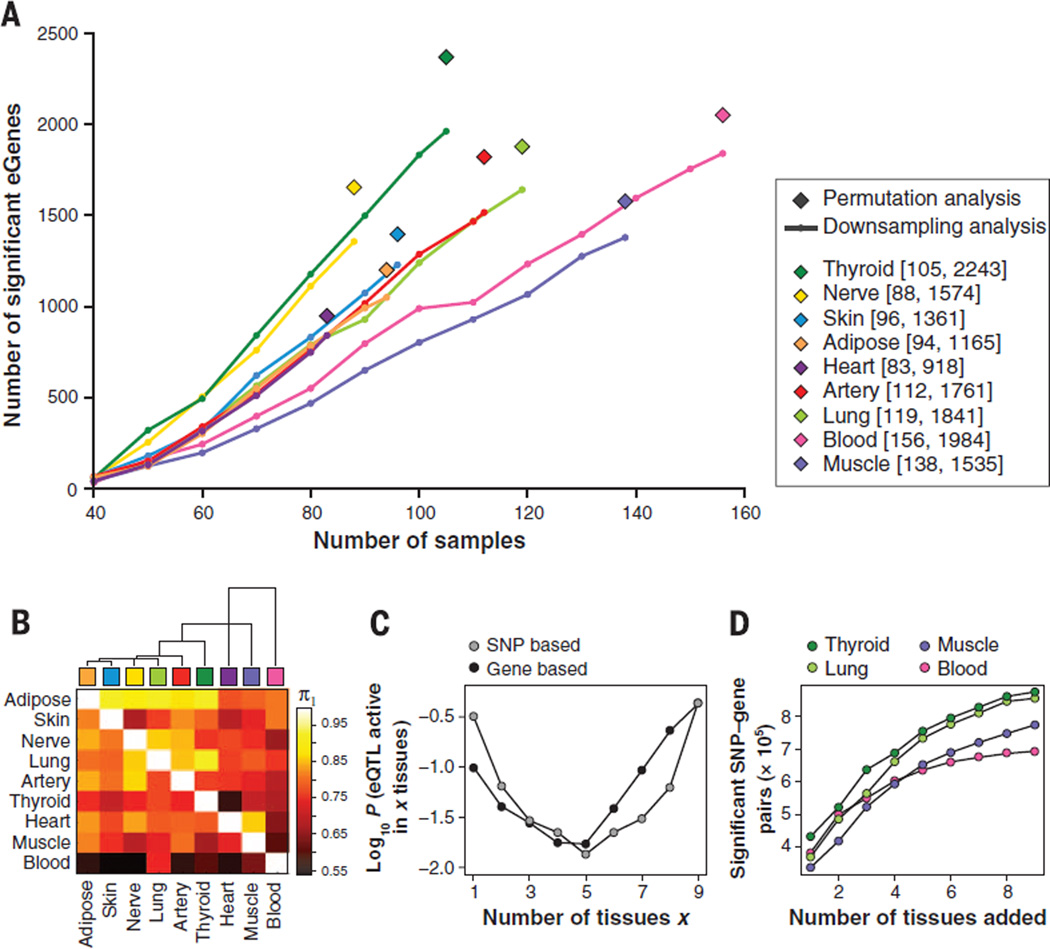
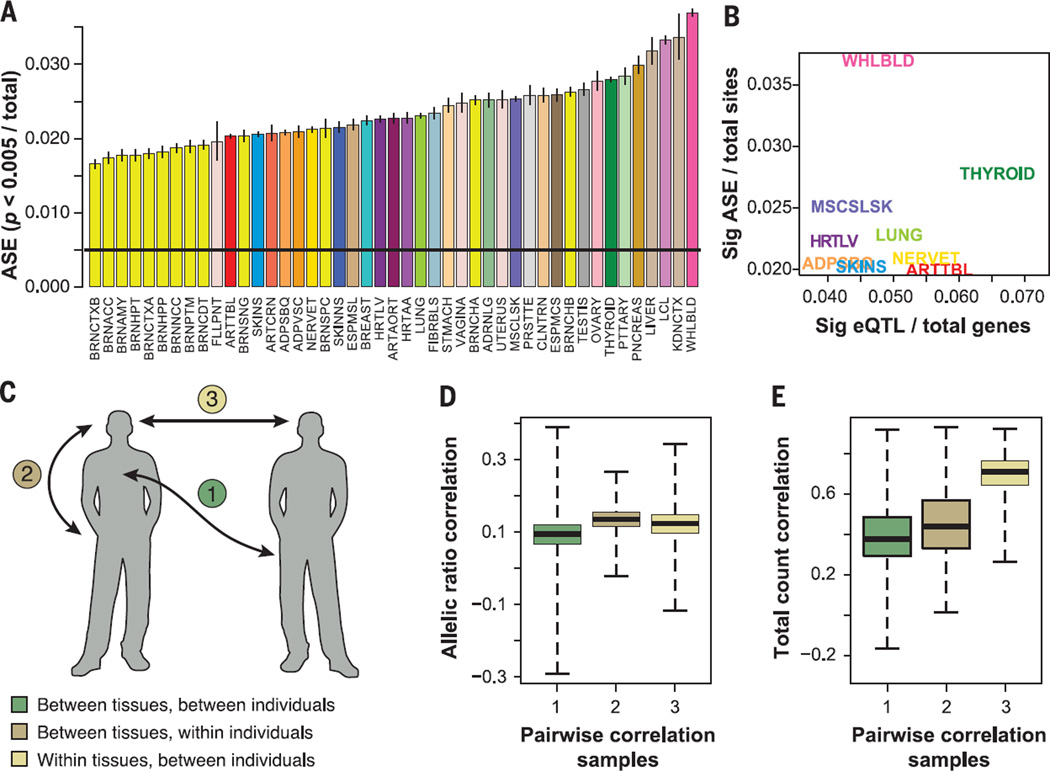
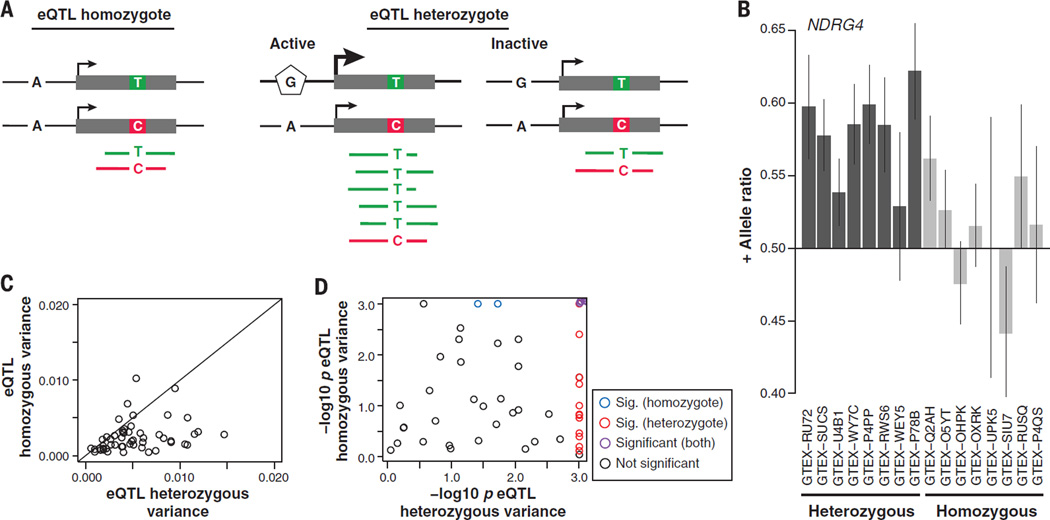
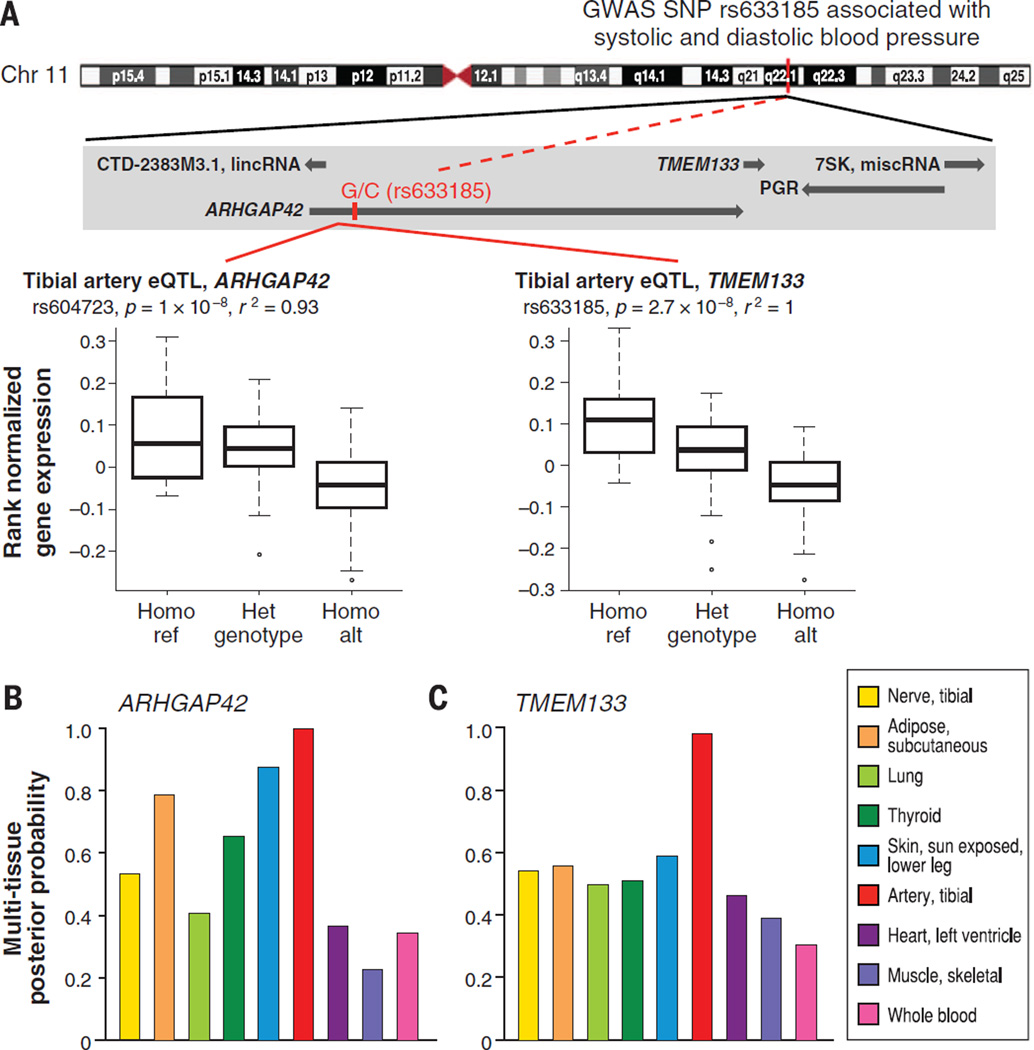
Understanding the functional consequences of genetic variation, and how it affects complex human disease and quantitative traits, remains a critical challenge for biomedicine. We present an analysis of RNA sequencing data from 1641 samples across 43 tissues from 175 individuals, generated as part of the pilot phase of the Genotype-Tissue Expression (GTEx) project. We describe the landscape of gene expression across tissues, catalog thousands of tissue-specific and shared regulatory expression quantitative trait loci (eQTL) variants, describe complex network relationships, and identify signals from genome-wide association studies explained by eQTLs. These findings provide a systematic understanding of the cellular and biological consequences of human genetic variation and of the heterogeneity of such effects among a diverse set of human tissues.


Figures

Fig. 1
Fig. 1. Sample clustering based on gene expression and exon splicing profiles
(A) Clustering performed on the basis of gene expression values for all genes from Gencode v12 annotation. Tissue type is the primary driver of expression differences, with the nonsolid tissues (blood and LCL cell lines) clustering separately from solid tissues. Hierarchical clustering was performed using as distance = 1 – Pearson correlation, and average method. (B) Sample clustering based on the “percent spliced in” (PSI) values for exons across samples. Tissue differentiation is less clearly a driver, and brain is now the main outgroup, driven largely by a cluster comprised of cerebellum and cortex samples.
Fig. 2
Fig. 2. Number and sharing of significant ciseQTLs per tissue
(A) Numbers of significant cis-eQTL genes (eGenes) per tissue according to single-tissue analysis. For each gene, the minimum nominal P value was used as the test statistic and an empirical P value was computed to correct for number of tests per gene, based on either permutation analysis of genotype sample labels applied to the full set of samples per tissue (◆) or Bonferroni correction, used for downsampling (line) to reduce computational burden (14). In the range of sample sizes tested, the number of identified eGenes increases linearly with sample size. (B) Dendrogram and heat map of pairwise eQTL sharing using the method of Nica et al. (22). Values are not symmetrical, since each entry in row i and column j is an estimate of π1 = Pr(eQTL in tissue i given an eQTL in tissue j). Blood has the lowest levels of eQTL sharing with other tissues while adipose shows higher levels of sharing. (C) Activity probabilities for both multitissue modeling approaches, applied to all nine tissues, indicate that the most likely configurations are for eQTLs that are active in only a few tissues or in many tissues. (D) For eQTLs in each tissue considered separately, analyzing multiple tissues jointly increases the number of discovered eQTL associations (FDR < 0.05), as assessed by the SNP-based multitissue model.
Fig. 3
Fig. 3. Quantification of regulatory diversity by ASE
(A) Proportion of sites with significant ASE (P < 0.005) in each tissue (colored and labeled as in Table 1), with binomial confidence intervals. (B) Proportion of significant ASE sites for the nine tissues with eQTL data as a function of the proportion of eQTLs after regressing out the log of sample size. (C) Partitioning variation in allelic and total gene expression within and between individuals and tissues. We calculated pairwise Spearman rank correlations between all the samples using two metrics [(D) and (E)]. (D) Allelic ratios over sites (sampled to 30 reads each), which captures similarity in allelic effects that are a proxy for cis-regulatory variation. (E) Total read counts over the same sites, which captures similarity in total gene expression levels. The plots show the distributions of pairwise correlations for sample pairs that are from (1) different tissues and different individual, (2) different tissues within an individual, or (3) same tissues in different individuals. Gene expression levels are highly correlated within the same tissue (E3) (see Fig. 1A). However, allelic ratios show highest correlation among different tissues of the same individual that share the same genome (D2).
Fig. 4
Fig. 4. Cis-regulatory effects in individuals that are not explained by detected eQTLs
(A) An eQTL showing individual homozygous (AA) for the eQTL SNP (left panel) or heterozygous (AG) (right panel). ASE is measured at the TC SNP. (B) An example of replication of an eQTL signal in ASE analysis in the NDRG4 gene, with eQTL heterozygotes showing higher ASE in the eQTL target gene than eQTL homozygotes (only a subset of individuals shown; linear regression P = 5.69 × 10⁻⁶). The error bars are from a binomial test for the allelic ratio. (C) For each eQTL gene where the eQTL signal was replicated in ASE (linear regression P < 0.05 after Bonferroni correction), the eQTL heterozygotes show higher variance in allelic ratio (Mann-Whitney P = 2.13 × 10⁻⁷). (D) Permuted P value for the variance between individuals, which is higher than expected in 22/53 genes (9 genes in homozygotes, 20 in heterozygotes).
Fig. 5
Fig. 5. Splicing QTLs
(A) A splicing QTL that affects the relative usage of alternative splice isoforms for the tRNA methyltransferase 1 homolog gene (TRMT1). TRMT1 has three annotated isoforms, only two of which are abundant in skeletal muscle. The relative abundance of the two isoforms differs by genotype (number of individuals below each genotype), with heterozygotes showing an intermediate behavior. This SNP has not been detected as an eQTL. The right panel shows the exonic structure of the transcripts along with the location of the sQTL SNP (dotted line). (B) The relative proportions of the different types of splicing events detected by the two methods over the nine tested tissues (fig. S23). (C) Functional enrichment of sQTLs from Altrans and sQTLseekeR. For the top-ranked SNPs associated with a given splicing event, we computed the relative frequency with which they map to different biologically determined ENCODE functional domains.
Fig. 6
Fig. 6. Coexpression networks within tissues and individuals
(A) Similarity of coexpression networks discovered in each tissue separately (rows) and replicated across all other tissues (columns), on the basis of the correlation in gene-pair expression levels across all individuals for a given tissue, as quantified by the π1 statistic. The tissues in this heat map are ordered as in Fig. 2B. (B) Coexpression modules learned within adipose tissue on the basis of weighted gene coexpression network analysis (WGCNA). The heat map shows the similarity in gene expression patterns (across individuals) for each pair of genes expressed within adipose tissue (red = high correlation, blue = low correlation). Non-gray colors highlight separate modules. (C and D) Genes in the same adipose coexpressed module [(C), rows] show enrichment for similar gene ontology (GO) categories (columns) and are co-bound by the same transcription factors (TF) [(D), columns] in their transcription start site (blue = Benjamini-Hochberg corrected P < 0.01). Dendrogram (top) denotes TF-to-TF similarity in module targeting. (E) Average expression level (red = high, blue = low) in each tissue (rows) across 117 expression modules (columns). Modules highlighted include Mod6, showing highest expression in whole blood and cortex; Mod95, showing highest expression in noncortex brain; and Mod101, showing brainwide expression. (F) Expression pattern of 175 individuals (columns) across 45 tissues (rows) for the ZFP57 gene encoding a KRAB domain transcription factor. Colored entries denote expression levels (heat map). White entries denote missing expression measurements for an individual in a given tissue. (G) Probability of membership of each individual (columns) in each expression module (rows) for the three most significant modules [highlighted in (E)]. (H) Genotype of the three top modQTL SNPs (rows) across individuals (columns) shows correlation with module membership probability.
Fig. 7
Fig. 7. Integration of transcriptome data improves annotation of putative protein truncating variants (PTVs)
(A) The majority of annotated PTV variants are partial PTV, meaning that only a fraction of the RNA-seq transcripts support PTV annotation. (B) For all the predicted PTV variants, we ask what percentage of variants maintain a PTV annotation if we require that a fixed percentage of the dominant isoforms across all sequenced tissues support a PTV prediction; 70% of PTV variants are relevant if the threshold is 10%, whereas only 40% of PTV variants are relevant if the threshold is 100%.
Fig. 8
Fig. 8. Tissue-dependent GWAS eQTL enrichment Q-Q plots
(A) eQTLs are enriched for trait associations with an important class of complex diseases. eQTLs discovered in whole blood (plotted in red) show significant enrichment for SNPs associated with autoimmune disorders from the WTCCC study (type 1 diabetes, Crohn’s disease, and rheumatoid arthritis) relative to null expectation (shown in gray) defined by non-eQTLs. (B) Enrichment of eQTLs for disease associations is tissue-dependent. Single-tissue eQTL annotation can be used to increase power to detect associations with hypertension, a disease for which the WTCCC study failed to yield significant associations. Notably, eQTLs discovered in adipose are enriched relative to muscle, lung, thyroid, skin, heart, and tibial artery (P < 0.05, Kolmogorov-Smirnov test) for known SNP associations with the hypertension.
Fig. 9
Fig. 9. A blood pressure-associated SNP is a significant eQTL in tibial artery, for ARHGAP42 and TMEM133
(A) The GWAS SNP, rs633185 in the intron of ARHGAP42, is associated with systolic blood pressure (P = 1.2 × 10⁻¹⁷) and diastolic blood pressure (P = 2 × 10⁻¹⁵). This GWAS SNP is in tight LD (r2 = 0.93) with the most significant eQTL for ARHGAP42 in tibial artery, rs604723 (P = 1 × 10⁻⁸), and is the most significant eQTL for TMEM133 in tibial artery (P = 2.7 × 10⁻⁸). Tibial artery was the only significant tissue at FDR < 0.05 according to the single-tissue eQTL discovery method. (B) Average posterior probability of the most significant cis-eQTL, rs607562 for ARHGAP42 at FDR < 0.05 from the multitissue eQTL methods. (C) Similar plot for TMEM133. The most significant cis-eQTL for TMEM133 from the multitissue methods at FDR < 0.05 is the GWAS SNP, rs633185, in tibial artery.

Comment in

Similar articles

  • An integrative functional genomics framework for effective identification of novel regulatory variants in genome-phenome studies.
    Zhao J, Cheng F, Jia P, Cox N, Denny JC, Zhao Z. Zhao J, et al. Genome Med. 2018 Jan 29;10(1):7. doi: 10.1186/s13073-018-0513-x. Genome Med. 2018. PMID: 29378629 Free PMC article.
  • Genetic effects on gene expression across human tissues.
    GTEx Consortium; Laboratory, Data Analysis &Coordinating Center (LDACC)—Analysis Working Group; Statistical Methods groups—Analysis Working Group; Enhancing GTEx (eGTEx) groups; NIH Common Fund; NIH/NCI; NIH/NHGRI; NIH/NIMH; NIH/NIDA; Biospecimen Collection Source Site—NDRI; Biospecimen Collection Source Site—RPCI; Biospecimen Core Resource—VARI; Brain Bank Repository—University of Miami Brain Endowment Bank; Leidos Biomedical—Project Management; ELSI Study; Genome Browser Data Integration &Visualization—EBI; Genome Browser Data Integration &Visualization—UCSC Genomics Institute, University of California Santa Cruz; Lead analysts:; Laboratory, Data Analysis &Coordinating Center (LDACC):; NIH program management:; Biospecimen collection:; Pathology:; eQTL manuscript working group:; Battle A, Brown CD, Engelhardt BE, Montgomery SB. GTEx Consortium, et al. Nature. 2017 Oct 11;550(7675):204-213. doi: 10.1038/nature24277. Nature. 2017. PMID: 29022597 Free PMC article.
  • Exploring regulation in tissues with eQTL networks.
    Fagny M, Paulson JN, Kuijjer ML, Sonawane AR, Chen CY, Lopes-Ramos CM, Glass K, Quackenbush J, Platig J. Fagny M, et al. Proc Natl Acad Sci U S A. 2017 Sep 12;114(37):E7841-E7850. doi: 10.1073/pnas.1707375114. Epub 2017 Aug 29. Proc Natl Acad Sci U S A. 2017. PMID: 28851834 Free PMC article.
  • Determining causality and consequence of expression quantitative trait loci.
    Battle A, Montgomery SB. Battle A, et al. Hum Genet. 2014 Jun;133(6):727-35. doi: 10.1007/s00439-014-1446-0. Epub 2014 Apr 26. Hum Genet. 2014. PMID: 24770875 Free PMC article. Review.
  • Expression quantitative trait loci: present and future.
    Nica AC, Dermitzakis ET. Nica AC, et al. Philos Trans R Soc Lond B Biol Sci. 2013 May 6;368(1620):20120362. doi: 10.1098/rstb.2012.0362. Print 2013. Philos Trans R Soc Lond B Biol Sci. 2013. PMID: 23650636 Free PMC article. Review.

Cited by

References

    1. Welter D, et al. Nucleic Acids Res. 2014;42:D1001–D1006. - PMC - PubMed
    1. Visscher PM, Brown MA, McCarthy MI, Yang J. Am. J. Hum. Genet. 2012;90:7–24. - PMC - PubMed
    1. Stranger BE, Stahl EA, Raj T. Genetics. 2011;187:367–383. - PMC - PubMed
    1. Ward LD, Kellis M. Nat. Biotechnol. 2012;30:1095–1106. - PMC - PubMed
    1. Maurano MT, et al. Science. 2012;337:1190–1195. - PMC - PubMed

Publication types

MeSH terms