. 2015 May 8;348(6235):660-5.
doi: 10.1126/science.aaa0355.

Human genomics. The human transcriptome across tissues and individuals

Affiliations

Human genomics. The human transcriptome across tissues and individuals

Marta Melé et al. Science. .

Abstract

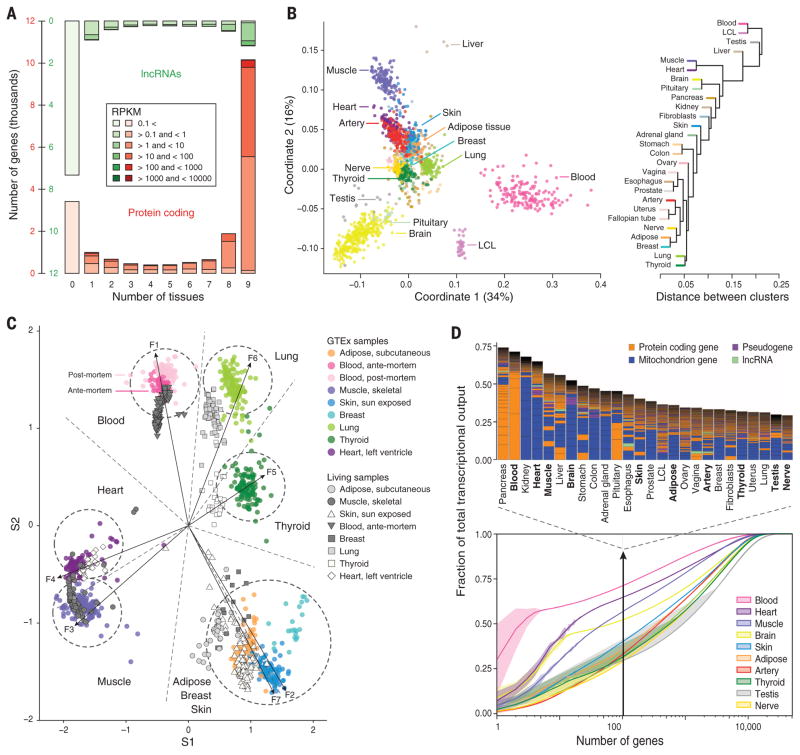
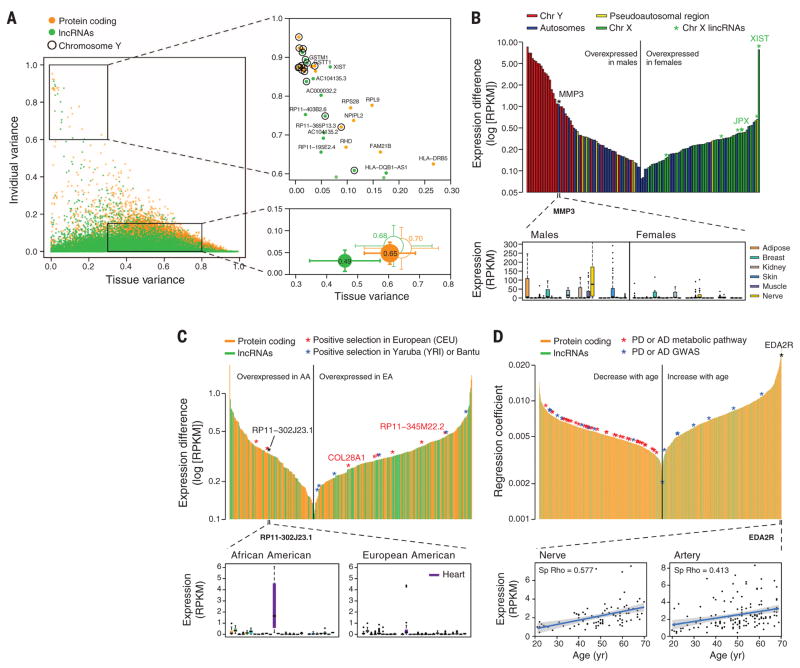
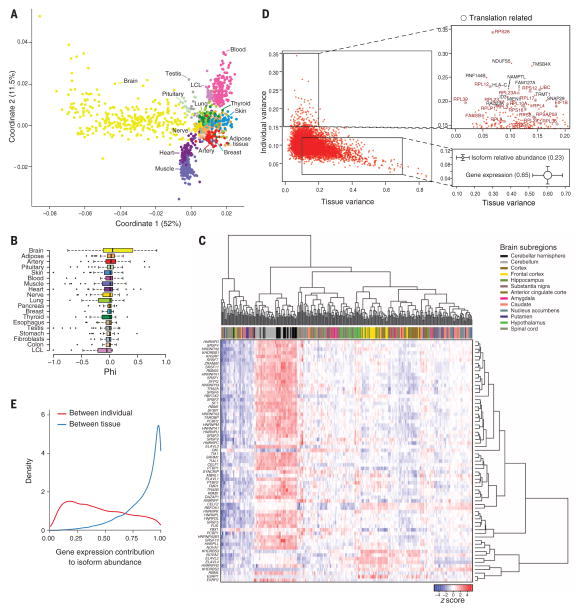
Transcriptional regulation and posttranscriptional processing underlie many cellular and organismal phenotypes. We used RNA sequence data generated by Genotype-Tissue Expression (GTEx) project to investigate the patterns of transcriptome variation across individuals and tissues. Tissues exhibit characteristic transcriptional signatures that show stability in postmortem samples. These signatures are dominated by a relatively small number of genes—which is most clearly seen in blood—though few are exclusive to a particular tissue and vary more across tissues than individuals. Genes exhibiting high interindividual expression variation include disease candidates associated with sex, ethnicity, and age. Primary transcription is the major driver of cellular specificity, with splicing playing mostly a complementary role; except for the brain, which exhibits a more divergent splicing program. Variation in splicing, despite its stochasticity, may play in contrast a comparatively greater role in defining individual phenotypes.


Figures

Fig. 1
Fig. 1. The GTEx multitissue transcriptome
(A) Gene expression levels and number of tissues in which genes are expressed (>0.1 RPKM in at least 80% of the samples). RPKMs are averaged over all genes expressed in a given number of tissues. (B) Sample and tissue similarity on the basis of gene expression profiles. Left: Multidimensional scaling Right: Tissue hierarchical clustering. (C) Expression values from eight GTEx tissues (colored circles) plotted radially along seven metagenes extracted from expression data. Antemortem samples curated from the Gene Expression Omnibus (GEO) cluster strongly with GTEx tissues. (D) Transcriptome complexity. Bottom: Cumulative distribution of the average fraction of total transcription contributed by genes when sorted from most-to-least expressed in each tissue (x axis). Lines represent mean values across samples of the same tissue, and lighter-color surfaces around the mean represent dispersion calculated as the standard deviation divided by the cumulative sum of all means.Top: Biological type and relative contribution to total transcription of the hundred most expressed genes. Height of the bars is proportional to the fraction that these genes contribute to total transcription.
Fig. 2
Fig. 2. Gene expression across tissues and individuals
(A) Left: Contribution of tissue and individual to gene expression variation of PCGs and lncRNAs. Bottom right: Mean ± SD over all genes (filled circles) and over genes with similar expression levels in PCGs and lncRNAs (unfilled circles). Circle size is proportional to the sum of tissue and individual variation, and segment length corresponds to 0.5 SD. Top right: genes with high individual variation and low tissue variation. (B) Sex differentially expressed genes. Top: differentially expressed genes (FDR < 0.05) sorted according to expression differences between males and females. Genes in the Y chromosome are sorted according to the expression in males. Bottom: MMP3 gene expression in males and females. (C) Genes differentially expressed with ethnicity. Top: differentially expressed genes (FDR < 0.05) between African Americans (AA) and European Americans (EA) sorted according to expression differences. A few of these genes lie in regions reported to be under positive selection in similar populations. Bottom: expression of RP11-302J23.1. (D) Genes differentially expressed with age. Top: Genes sorted according to the regression coefficient. Bottom: expression of EDAR2 gene in nerve and artery as a function of age. Shaded area around the regression line represents 95% confidence interval.
Fig. 3
Fig. 3. Splicing across tissue and individuals
(A) Multidimensional scaling of all samples on the basis of exon inclusion levels (Percent spliced in, PSI). (B) Microexon inclusion across tissues.Values of tissue exon inclusion close to 1 (−1) indicate that the microexon is included (excluded), in nearly all samples from the tissue, and excluded (included) in nearly all samples from the rest of the tissues.Tissues are sorted according to tissue exon inclusion (phi) median value. (C) Clustering of brain samples on the basis of the normalized expression levels of 67 RNA binding proteins involved in splicing. The order of samples and genes is obtained by biclustering the expression matrix. (D) Left: Contribution of tissue and individual to splicing variation in PCGs. Bottom right: Mean ± SD of individual and tissue contributions to splicing and to gene expression variation. Circle size is proportional to the sum of tissue and individual variation and segment length corresponds to 0.5 SD. Top right: Genes with high splicing variation across individuals. (E) Contribution of gene expression to the between-individual and between-tissue variation in isoform abundance

Comment in

References

    1. FANTOM Consortium and the RIKEN PMI and CLST (DGT) et al . Nature. 2014;507:462–470. - PMC - PubMed
    1. ENCODE Project Consortium. Nature. 2012;489:57–74. - PMC - PubMed
    1. Lappalainen T, et al. Nature. 2013;501:506–511. - PMC - PubMed
    1. Grundberg E, et al. Nat Genet. 2012;44:1084–1089. - PMC - PubMed
    1. Lonsdale TJ, et al. Nat Genet. 2013;45:580–585. - PMC - PubMed

Publication types

Associated data