. 2015 May 8;10(5):e0126314.
doi: 10.1371/journal.pone.0126314. eCollection 2015.

A Metabotropic-Like Flux-Independent NMDA Receptor Regulates Ca2+ Exit from Endoplasmic Reticulum and Mitochondrial Membrane Potential in Cultured Astrocytes

Affiliations

A Metabotropic-Like Flux-Independent NMDA Receptor Regulates Ca2+ Exit from Endoplasmic Reticulum and Mitochondrial Membrane Potential in Cultured Astrocytes

Pavel Montes de Oca Balderas et al. PLoS One. .

Erratum in

Abstract

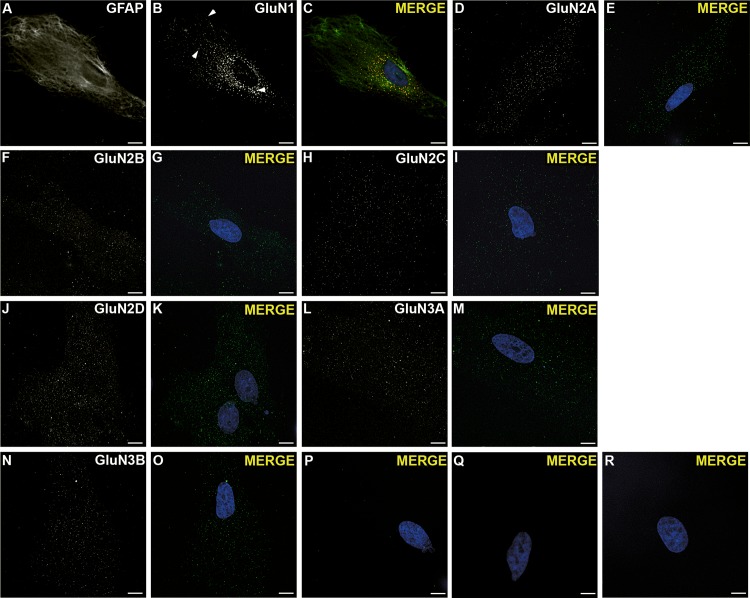
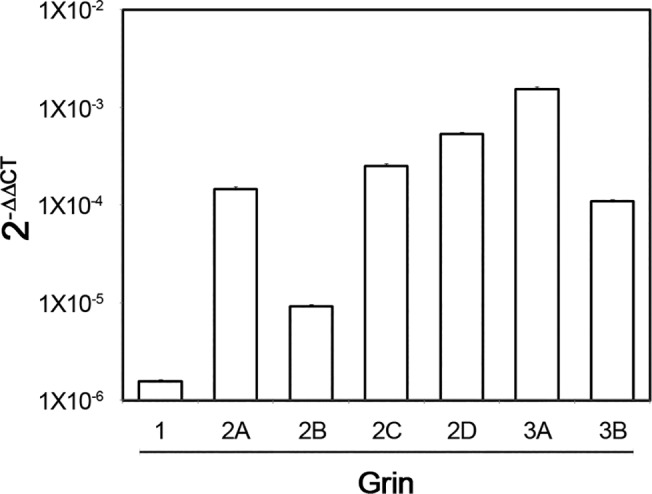
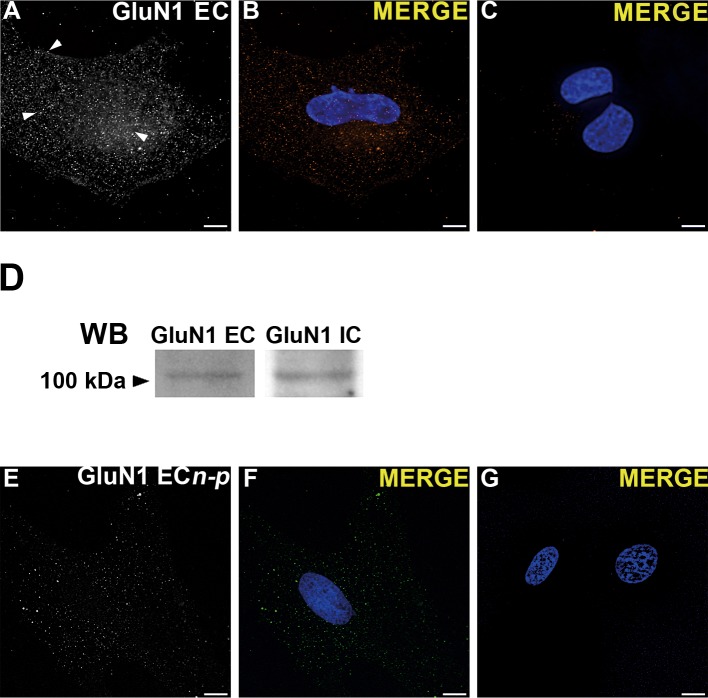
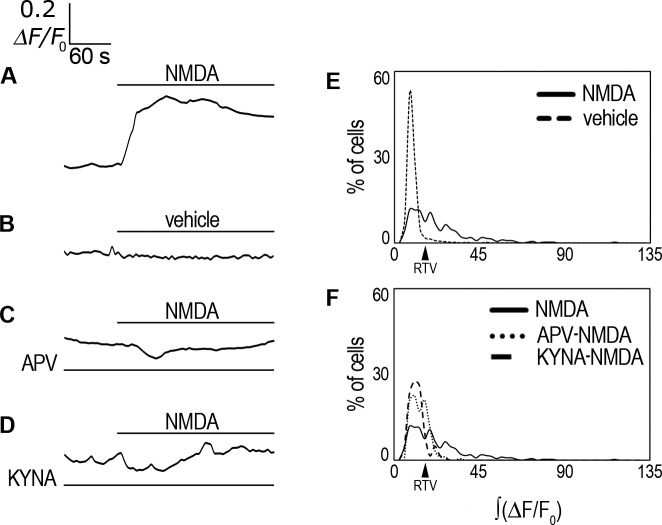
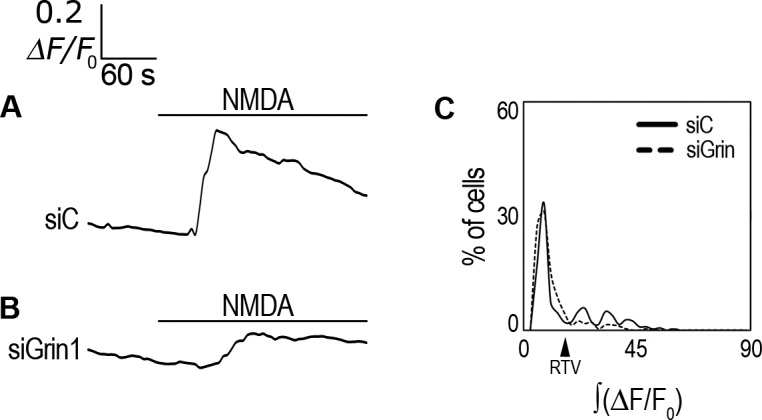
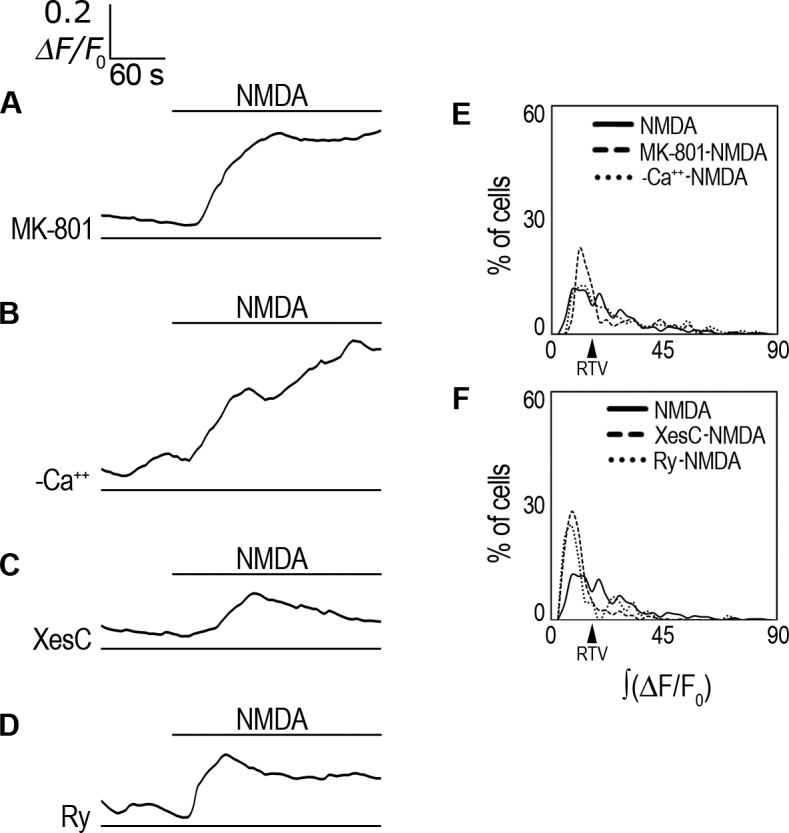
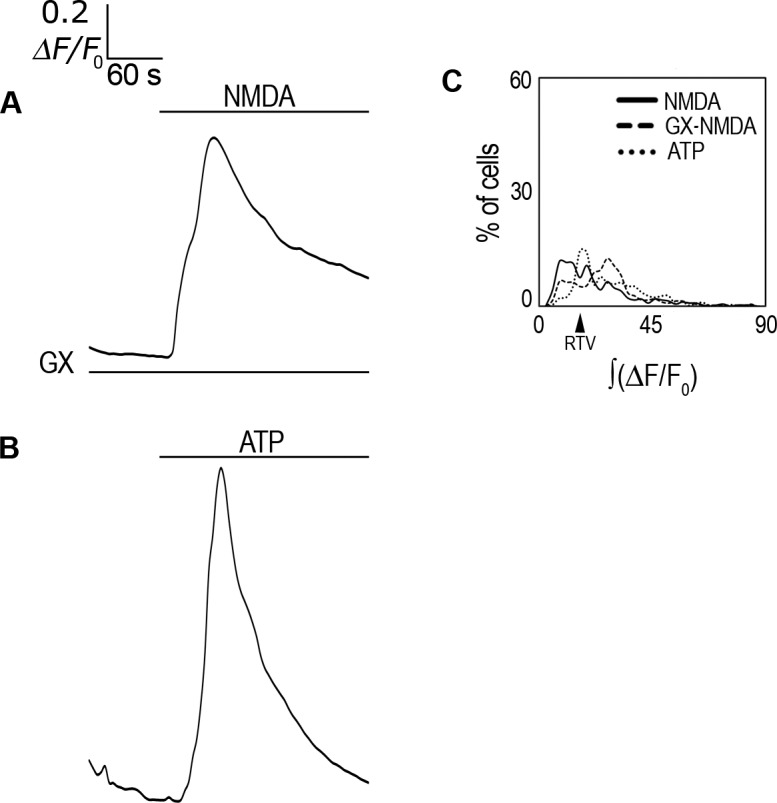
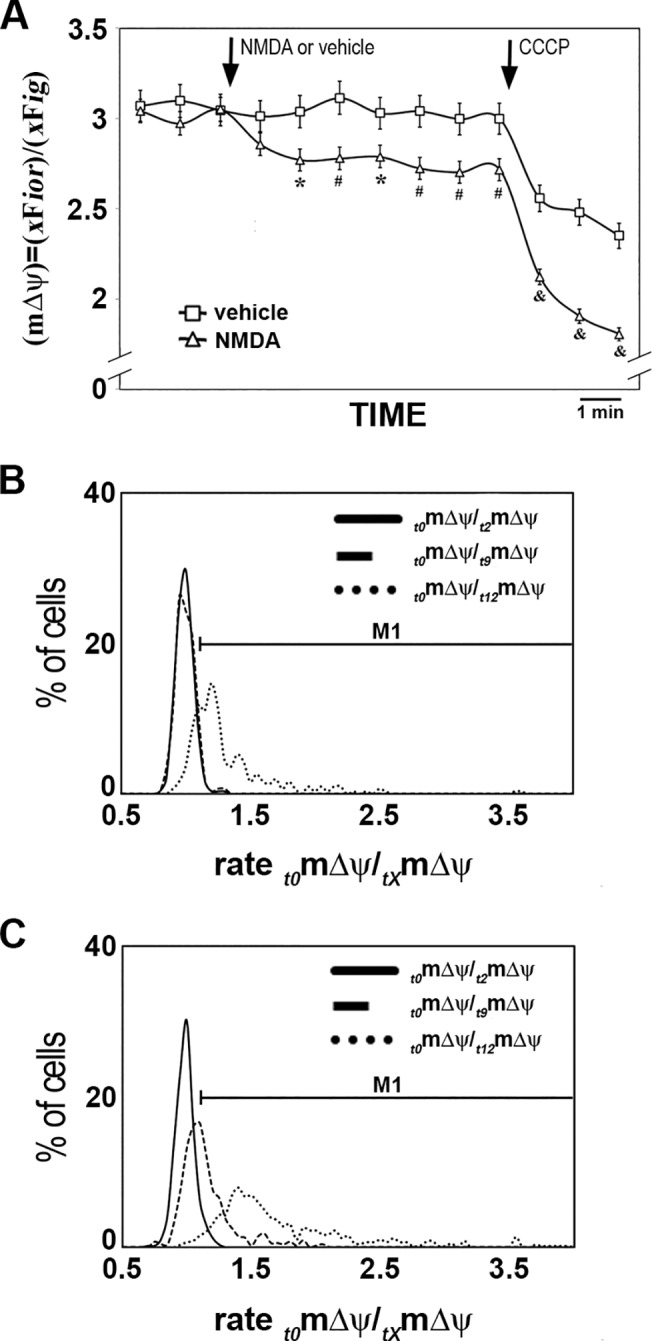
Astrocytes were long thought to be only structural cells in the CNS; however, their functional properties support their role in information processing and cognition. The ionotropic glutamate N-methyl D-aspartate (NMDA) receptor (NMDAR) is critical for CNS functions, but its expression and function in astrocytes is still a matter of research and debate. Here, we report immunofluorescence (IF) labeling in rat cultured cortical astrocytes (rCCA) of all NMDAR subunits, with phenotypes suggesting their intracellular transport, and their mRNA were detected by qRT-PCR. IF and Western Blot revealed GluN1 full-length synthesis, subunit critical for NMDAR assembly and transport, and its plasma membrane localization. Functionally, we found an iCa2+ rise after NMDA treatment in Fluo-4-AM labeled rCCA, an effect blocked by the NMDAR competitive inhibitors D(-)-2-amino-5-phosphonopentanoic acid (APV) and Kynurenic acid (KYNA) and dependent upon GluN1 expression as evidenced by siRNA knock down. Surprisingly, the iCa2+ rise was not blocked by MK-801, an NMDAR channel blocker, or by extracellular Ca2+ depletion, indicating flux-independent NMDAR function. In contrast, the IP3 receptor (IP3R) inhibitor XestosponginC did block this response, whereas a Ryanodine Receptor inhibitor did so only partially. Furthermore, tyrosine kinase inhibition with genistein enhanced the NMDA elicited iCa2+ rise to levels comparable to those reached by the gliotransmitter ATP, but with different population dynamics. Finally, NMDA depleted the rCCA mitochondrial membrane potential (mΔψ) measured with JC-1. Our results demonstrate that rCCA express NMDAR subunits which assemble into functional receptors that mediate a metabotropic-like, non-canonical, flux-independent iCa2+ increase.


Conflict of interest statement

Competing Interests: The authors have declared that no competing interests exist.

Figures

Fig 1
Fig 1. NMDAR subunits in permeabilized rCCA.
(A) GFAP positive cells were double labeled with a goat polyclonal Ab against the GluN1 IC domain (B) that showed near plasma membrane (top arrow), intracellular (middle arrow) and perinuclear puncta (bottom arrow). (C) Merged image with stained nucleus. (D) GluN2A IF with a goat polyclonal Ab. (E) Merged image with stained nucleus. (F) GluN2B IF with a mouse monoclonal Ab. (G) Merged image with stained nucleus. (H) GluN2C IF with a polyclonal rabbit Ab. (I) Merged image with stained nucleus. (J) GluN2D IF with a monoclonal mouse Ab. (K) Merged image with stained nucleus. (L) GluN3A IF with a goat monoclonal Ab. (M) Merged image with stained nucleus. (N) GluN3B IF with a polyclonal rabbit Ab. (O) Merged image with stained nucleus. These phenotypes were not observed in cells without primary Ab but with identical secondary Ab concentrations against goat IgG (P); rabbit IgG (Q); and mouse IgG (R). In all images the bottom slice from a z stack after blind deconvolution processing from a representative cell from 3 independent experiments is shown. Reference bar = 10 μm.
Fig 2
Fig 2. NMDAR subunit mRNA expression.
The bars represent 2-ΔΔ Ct averages ± s.d. of triplicates from one representative experiment of three independent experiments with 18S rRNA as reference gene.
Fig 3
Fig 3. Full-length GluN1 expression and cell membrane localization.
(A) GluN1 IF in permeabilized rCCA with a polyclonal Ab against its EC domain showing puncta near the plasma membrane (top arrow), intracellular (middle arrow) and perinuclear (bottom arrow). (B) Merged image with stained nucleus. This phenotype was not observed in cells without primary Ab but with identical secondary Ab concentrations (C). (D) WB of whole cell lysates with Abs against GluN1 EC (left panel) and IC (right panel) domains in the same blot after stripping. A band of ≈115 kDa corresponding to full-length GluN1 was detected with both Abs. One representative experiment is shown from at least three performed independently. (E) GluN1 IF in non-permeabilized rCCA with a polyclonal Ab against its EC domain. (F) Merged image with stained nucleus. This phenotype was not observed in non-permeabilized cells without primary Ab but with identical secondary Ab concentrations (C). In all images the bottom slice from a z-stack after blind deconvolution processing from a cell representative of 3 independent experiments is shown. Reference bar = 10 μm.
Fig 4
Fig 4. NMDA effect on iCa2+.
(A) ΔF/F0 averaged response in Fluo-4-AM-labeled rCCA perfused with 1 mM NMDA. (B) ΔF/F0 averaged response in Fluo-4-AM-labeled rCCA perfused with vehicle alone. (C) ΔF/F0 averaged response in Fluo-4-AM-labeled rCCA perfused with NMDA in the presence of APV or (D) KYNA. Line above traces indicates perfusion with 1 mM NMDA or vehicle after 120 sec basal recording. Line below (if applicable) indicates the inhibitor used throughout the recording time. (E) ∫(ΔF/F0) distribution histogram for cell population responses in NMDA and vehicle conditions. (F) ∫(ΔF/F0) distribution histogram for cell population responses in APV and KYNA conditions; the NMDA treated population distribution is included for comparison. The RTV value is indicated by the black arrowhead (see text). Statistical analyses for these distributions with the number of cells and the number of experiments are shown in Table 1. Representative images of iCa2+ responses are shown in S8 Fig.
Fig 5
Fig 5. Grin1 knock down effect on iCa2+ response to NMDA.
(A) F/F0 averaged response in Fluo-4-AM-labeled rCCA transfected with a control siRNA (siC) and perfused with 1 mM NMDA. (B) ΔF/F0 averaged response in Fluo-4-AM-labeled rCCA transfected with a Grin1 siRNA (siGrin1) and perfused with 1 mM NMDA. Line above traces indicates perfusion with 1 mM NMDA after 120 sec basal recording. (C) ∫(ΔF/F0) distribution histograms for cell population responses after siRNA transfection. The RTV value is indicated by the black arrowhead (see text). Statistical analyses for these distributions with the number of cells and the number of experiments are shown in Table 1. Representative images from iCa2+ responses are shown in S8 Fig.
Fig 6
Fig 6. Analysis of iCa2+ source.
(A) ΔF/F0 averaged response in Fluo-4-AM-labeled rCCA perfused with 1 mM NMDA in the presence of MK-801. (B) ΔF/F0 averaged response in Fluo-4-AM-labeled rCCA perfused with 1 mM NMDA under extracellular Ca2+-free conditions. (C) ΔF/F0 averaged response in Fluo-4-AM-labeled rCCA perfused with 1 mM NMDA in the presence of XestosponginC. (D) ΔF/F0 averaged response in Fluo-4-AM-labeled rCCA perfused with 1 mM NMDA in the presence of Ryanodine. Line above traces indicates perfusion with 1 mM NMDA after 120 sec basal recording. Line below (if applicable) indicates the inhibitor used throughout the recording time. (E) ∫(ΔF/F0) distribution histogram for cell population responses in MK-801 and extracellular Ca2+-free conditions, NMDA distribution is included for comparative purposes. (F) ∫(ΔF/F0) distribution histogram for cell population responses in XestosponginC and Ryanodine conditions; the NMDA treated population distribution is included for comparison. The RTV value is indicated by the black arrowhead (see text). Statistical analysis for these distributions with the number of cells and the number of experiments are shown in Table 1. Representative images from iCa2+ responses are shown in S8 Fig.
Fig 7
Fig 7. Genistein effect on iCa2+ response to NMDA and ATP response.
(A) ΔF/F0 averaged response in Fluo-4-AM-labeled rCCA perfused with 1 mM NMDA in the presence of genistein (GX). (B) ΔF/F0 averaged response in Fluo-4-AM-labeled rCCA perfused with ATP. Line above traces indicates perfusion with 1 mM NMDA after 120 sec basal recording. Line below (if applicable) indicates the inhibitor used throughout the recording time. (C) ∫(ΔF/F0) distribution histogram for cell population responses in genistein and ATP conditions; the NMDA treated population distribution is included for comparison. The RTV value is indicated by the black arrowhead (see text). Statistical analysis for these distributions with the number of cells and the number of experiments are shown in Table 1. Representative images from iCa2+ responses are shown in S8 Fig.
Fig 8
Fig 8. NMDA effect on mΔψ.
(A) mΔψ time lapses of vehicle-(squares) and 1 mM NMDA-(triangles) treated rCCA labeled with JC-1. The three initial frames measured basal mΔψ. After basal recording, NMDA or vehicle was added as indicated by the arrow, and seven more frames were acquired. Finally, CCCP was added (arrow) as positive control for depolarization and three more frames were acquired. Distribution histograms for cell-by-cell change rate analysis for vehicle-(B) or NMDA-(C) treated rCCA at three different timepoints. Rates were calculated for each cell in vehicle and NMDA conditions between their initial (t0) mΔψ and three subsequent time points: at t2 in basal conditions (t0mΔψ/t2mΔψ; line), at t9 after NMDA treatment (t0mΔψ/t9mΔψ; dashed line), and at t12 after CCCP treatment (t0mΔψ/t12mΔψ; dotted line). The M1 line above the histograms indicates the range used as reference to claim mΔψ depolarization. Data summaries for these histograms are presented in Table 2. (* = p≤0.05; # = p≤0.01; & = p≤0.001; student’s t-test).

Similar articles

Cited by

References

    1. Allen NJ, Barres BA. Neuroscience: Glia—more than just brain glue. Nature. 2009;457(7230):675–7. 10.1038/457675a - DOI - PubMed
    1. Cornell-Bell AH, Finkbeiner SM, Cooper MS, Smith SJ. Glutamate induces calcium waves in cultured astrocytes: long-range glial signaling. Science. 1990;247(4941):470–3. . - PubMed
    1. Giaume C, Koulakoff A, Roux L, Holcman D, Rouach N. Astroglial networks: a step further in neuroglial and gliovascular interactions. Nat Rev Neurosci. 2010;11(2):87–99. 10.1038/nrn2757 - DOI - PubMed
    1. Kettenmann H, Schachner M. Pharmacological properties of gamma-aminobutyric acid-, glutamate-, and aspartate-induced depolarizations in cultured astrocytes. J Neurosci. 1985;5(12):3295–301. . - PMC - PubMed
    1. Lalo U, Pankratov Y, Parpura V, Verkhratsky A. Ionotropic receptors in neuronal-astroglial signalling: what is the role of "excitable" molecules in non-excitable cells. Biochim Biophys Acta. 2010;1813(5):992–1002. 10.1016/j.bbamcr.2010.09.007 - DOI - PubMed

Publication types

MeSH terms

LinkOut - more resources