

Phosphorylation of PPARγ Affects the Collective Motions of the PPARγ-RXRα-DNA Complex
- PMID: 25954810
- PMCID: PMC4425662
- DOI: 10.1371/journal.pone.0123984
Phosphorylation of PPARγ Affects the Collective Motions of the PPARγ-RXRα-DNA Complex
Abstract
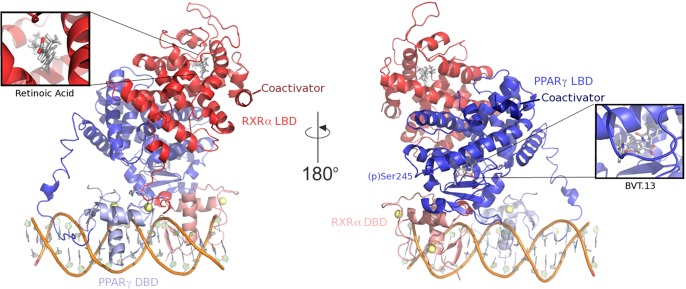
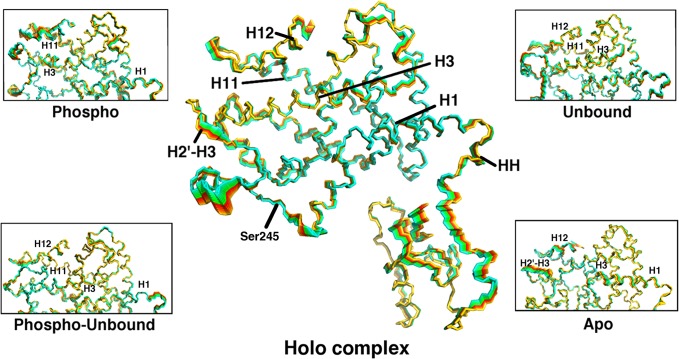
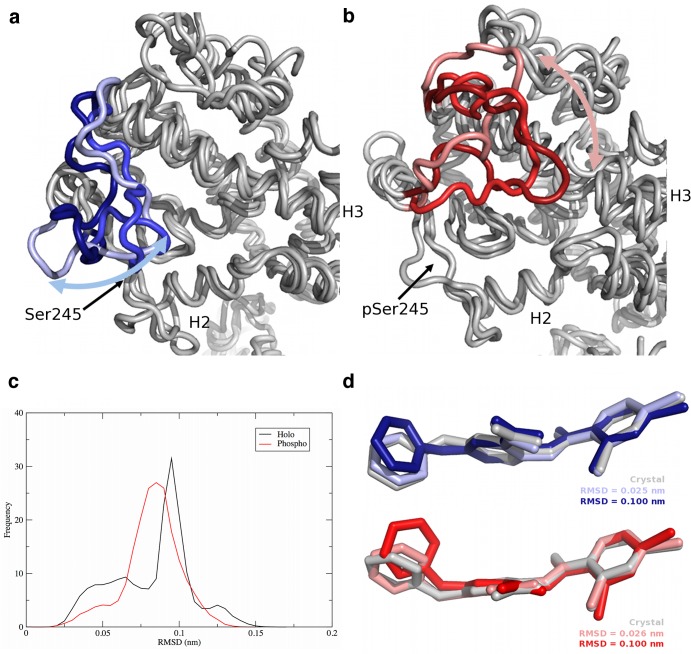
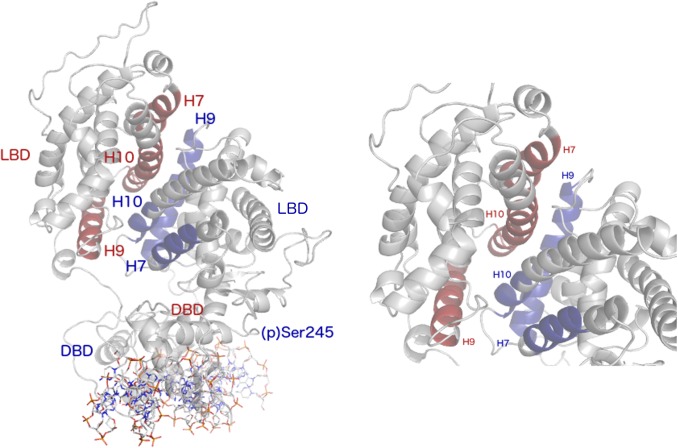
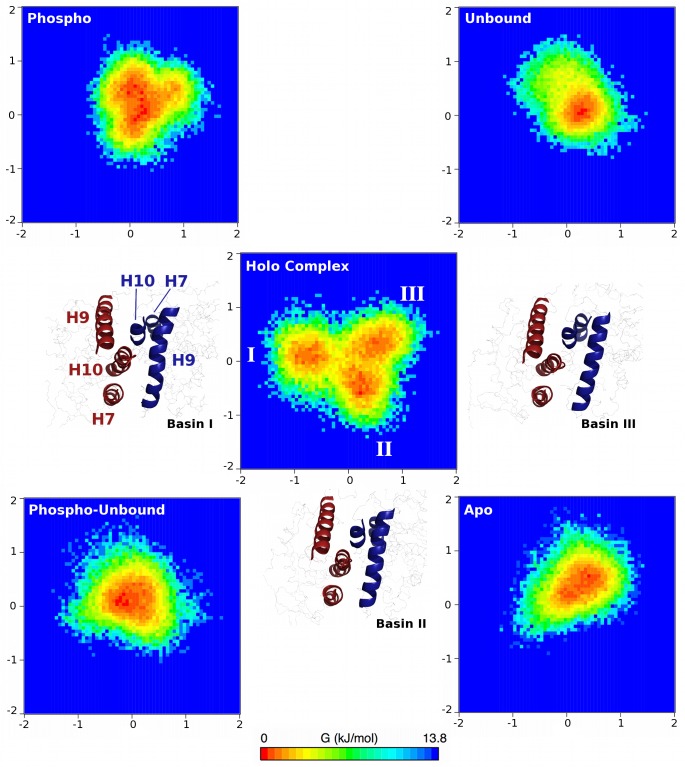
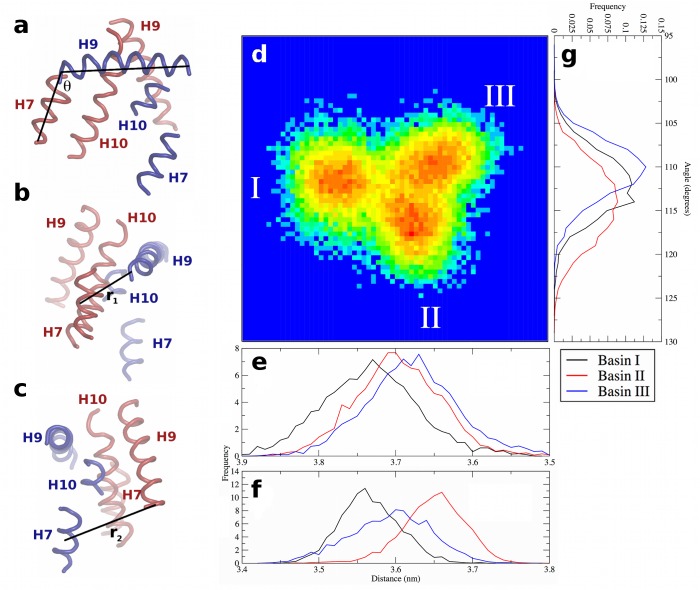
Peroxisome-proliferator activated receptor-γ (PPARγ) is a nuclear hormone receptor that forms a heterodimeric complex with retinoid X receptor-α (RXRα) to regulate transcription of genes involved in fatty acid storage and glucose metabolism. PPARγ is a target for pharmaceutical intervention in type 2 diabetes, and insight into interactions between PPARγ, RXRα, and DNA is of interest in understanding the function and regulation of this complex. Phosphorylation of PPARγ by cyclin-dependent kinase 5 (Cdk5) has been shown to dysregulate the expression of metabolic regulation genes, an effect that is counteracted by PPARγ ligands. We applied molecular dynamics (MD) simulations to study the relationship between the ligand-binding domains of PPARγ and RXRα with their respective DNA-binding domains. Our results reveal that phosphorylation alters collective motions within the PPARγ-RXRα complex that affect the LBD-LBD dimerization interface and the AF-2 coactivator binding region of PPARγ.
Conflict of interest statement
Figures

Similar articles
-
Heterodimer formation with retinoic acid receptor RXRα modulates coactivator recruitment by peroxisome proliferator-activated receptor PPARγ.J Biol Chem. 2021 Jul;297(1):100814. doi: 10.1016/j.jbc.2021.100814. Epub 2021 May 31. J Biol Chem. 2021. PMID: 34081964 Free PMC article.
-
Allosteric Pathways in the PPARγ-RXRα nuclear receptor complex.Sci Rep. 2016 Jan 29;6:19940. doi: 10.1038/srep19940. Sci Rep. 2016. PMID: 26823026 Free PMC article.
-
Manipulation of reciprocal salt bridges at the heterodimerization interface alters the dimerization properties of mouse RXRalpha and PPARgamma1.Biochem Biophys Res Commun. 2007 Jul 13;358(4):1080-5. doi: 10.1016/j.bbrc.2007.05.051. Epub 2007 May 22. Biochem Biophys Res Commun. 2007. PMID: 17521607
-
Diabetes: New conductors for the peroxisome proliferator-activated receptor γ (PPARγ) orchestra.Int J Biochem Cell Biol. 2011 Aug;43(8):1071-4. doi: 10.1016/j.biocel.2011.04.017. Epub 2011 May 5. Int J Biochem Cell Biol. 2011. PMID: 21558015 Review.
-
Insights into Dynamic Mechanism of Ligand Binding to Peroxisome Proliferator-Activated Receptor γ toward Potential Pharmacological Applications.Biol Pharm Bull. 2021;44(9):1185-1195. doi: 10.1248/bpb.b21-00263. Biol Pharm Bull. 2021. PMID: 34471046 Review.
Cited by
-
Activation of PPARγ suppresses proliferation and induces apoptosis of esophageal cancer cells by inhibiting TLR4-dependent MAPK pathway.Oncotarget. 2016 Jul 12;7(28):44572-44582. doi: 10.18632/oncotarget.10067. Oncotarget. 2016. PMID: 27323819 Free PMC article.
-
Triphenyl phosphate is a selective PPARγ modulator that does not induce brite adipogenesis in vitro and in vivo.Arch Toxicol. 2020 Sep;94(9):3087-3103. doi: 10.1007/s00204-020-02815-1. Epub 2020 Jul 18. Arch Toxicol. 2020. PMID: 32683515 Free PMC article.
-
The PPAR Ω Pocket: Renewed Opportunities for Drug Development.PPAR Res. 2020 Jul 1;2020:9657380. doi: 10.1155/2020/9657380. eCollection 2020. PPAR Res. 2020. PMID: 32695150 Free PMC article. Review.
-
Microsecond MD Simulations to Explore the Structural and Energetic Differences between the Human RXRα-PPARγ vs. RXRα-PPARγ-DNA.Molecules. 2022 Sep 7;27(18):5778. doi: 10.3390/molecules27185778. Molecules. 2022. PMID: 36144514 Free PMC article.
-
Tissue expression analysis, cloning and characterization of the 5'-regulatory region of the bovine FABP3 gene.Mol Biol Rep. 2016 Sep;43(9):991-8. doi: 10.1007/s11033-016-4026-7. Epub 2016 Jun 6. Mol Biol Rep. 2016. PMID: 27270359
References
-
- Tontonoz P, Hu E, Graves RA, Budavari AI, Spiegelman BM. mPPARγ2: tissue-specific regulator of an adipocyte enhancer. Genes Dev. 1994; 8: 1224–1234. - PubMed
-
- Bain DL, Heneghan AF, Connaghan-Jones KD, Miura MT. Nuclear Receptor Structure: Implications for Function. Annu Rev Physiol. 2007; 69: 201–220. - PubMed
Publication types
MeSH terms
Substances
Grants and funding
LinkOut - more resources
Full Text Sources
Other Literature Sources
Molecular Biology Databases
