

A Home-Based Educational Intervention Improves Patient Activation Measures and Diabetes Health Indicators among Zuni Indians
- PMID: 25954817
- PMCID: PMC4425648
- DOI: 10.1371/journal.pone.0125820
A Home-Based Educational Intervention Improves Patient Activation Measures and Diabetes Health Indicators among Zuni Indians
Abstract
Introduction: One in three people will be diagnosed with diabetes by 2050, and the proportion will likely be higher among Native Americans. Diabetes control is currently suboptimal in underserved populations despite a plethora of new therapies. Patient empowerment is a key determinant of diabetes control, but such empowerment can be difficult to achieve due to resource limitation and cultural, language and health literacy barriers. We describe a home-based educational intervention using Community Health Representatives (CHRs), leading to improvement in Patient Activation Measures scores and clinical indicators of diabetes control.
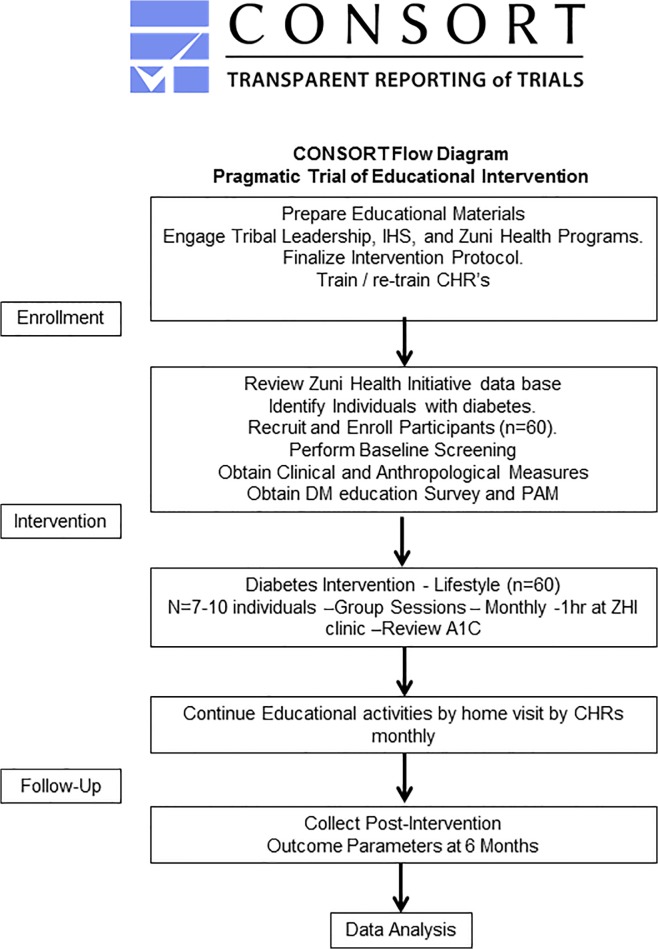
Methods: Sixty participants with type 2 diabetes (T2D) completed a baseline evaluation including physical exam, Point of Care (POC) testing, and the Patient Activation Measure (PAM) survey. Participants then underwent a one hour group didactic session led by Community Health Representatives (CHRs) who subsequently carried out monthly home-based educational interventions to encourage healthy lifestyles, including diet, exercise, and alcohol and cigarette avoidance until follow up at 6 months, when clinical phenotyping and the PAM survey were repeated.
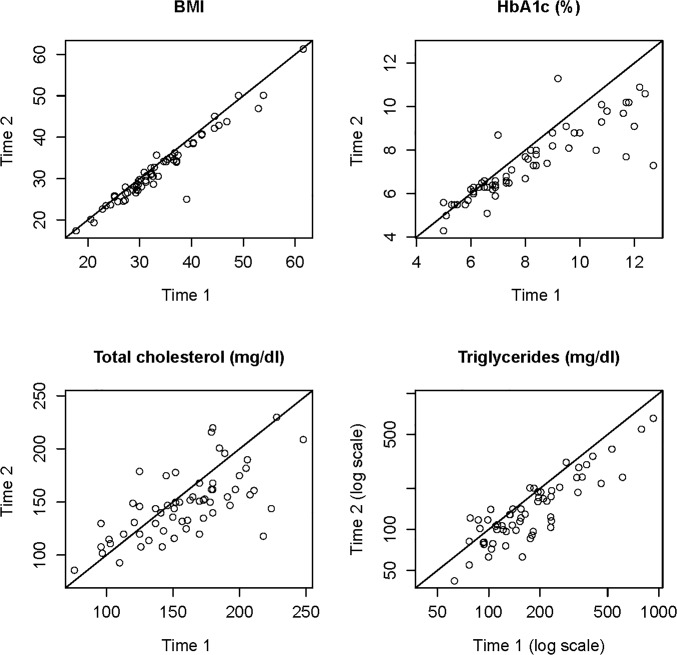
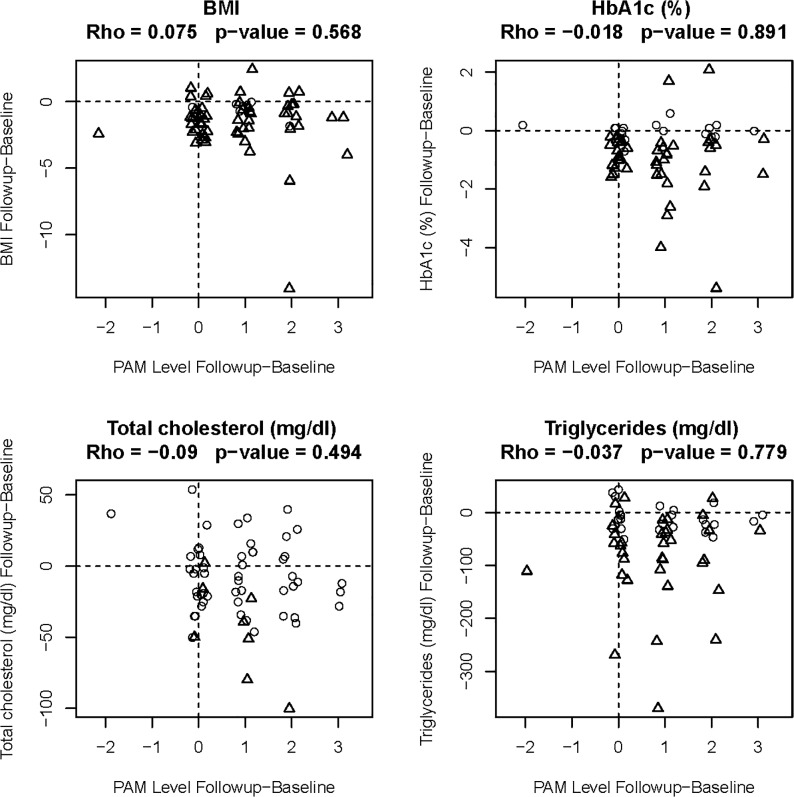
Results: PAM scores were increased by at least one level in 35 (58%) participants, while 24 participants who started at higher baseline score did not change. Six months after intervention, mean levels of A1C decreased by 0.7 ± 1.2%; fasting blood glucose decreased by 24.0 ± 38.0 mg/dl; BMI decreased by 1.5 ± 2.1 kg/m2; total cholesterol decreased by 12.0 ± 28.0 mg/dl; and triglycerides decreased by 52.0 ± 71.0 mg/dl. All of these changes were statistically significant (p < 0.05).
Conclusion: This six month, CHR led and community-oriented educational intervention helps inform standards of practice for the management of diabetes, engages diabetic populations in their own care, and reduces health disparities for the underserved population of Zuni Indians.
Trial registration: ClinicalTrials.gov NCT02339311.
Conflict of interest statement
Figures
References
-
- Center for Disease Control 2010. Available: http://www.cdc.gov/nchs/data/nhsr/nhsr020.pdf. Accessed 6 January 2014.
-
- Jousilahti P, Tuomilehto J, Korhonen HJ, Vartiainen E, Puska P, Nissinen A. Trends in CVD Risk Factor Clustering. Preventive Medicine. 1994;23: 6–14. - PubMed
Publication types
MeSH terms
Associated data
Grants and funding
LinkOut - more resources
Full Text Sources
Other Literature Sources
Medical
Miscellaneous
