. 2015 May 5;108(9):2282-90.
doi: 10.1016/j.bpj.2015.03.052.

Constant-pH Molecular Dynamics Study of Kyotorphin in an Explicit Bilayer

Affiliations

Constant-pH Molecular Dynamics Study of Kyotorphin in an Explicit Bilayer

Pedro R Magalhães et al. Biophys J. .

Abstract

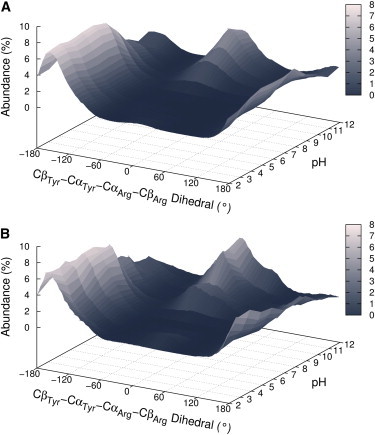
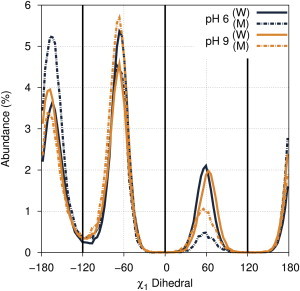
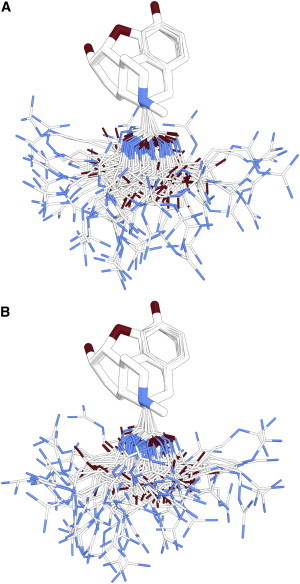
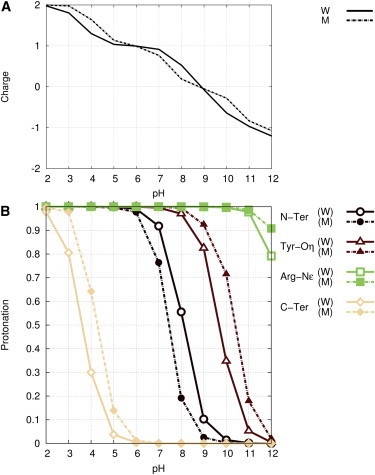
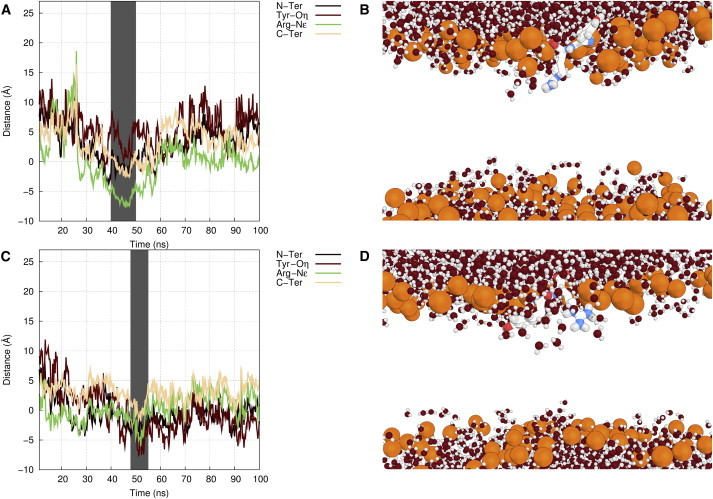
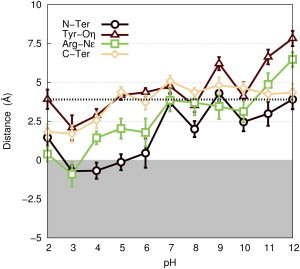
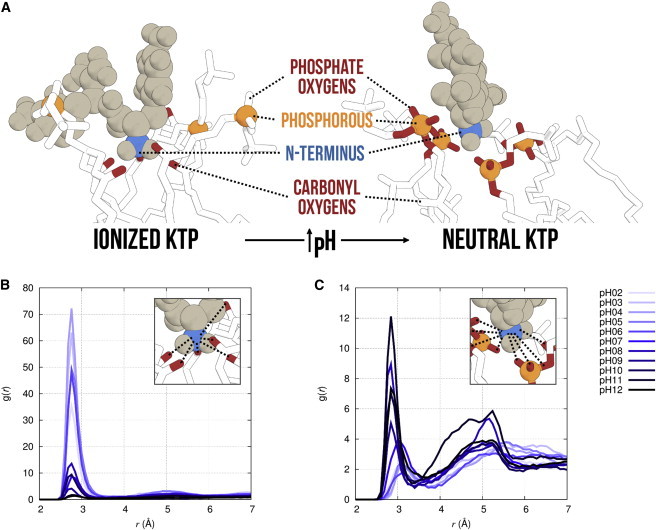
To our knowledge, we present the first constant-pH molecular dynamics study of the neuropeptide kyotorphin in the presence of an explicit lipid bilayer. The overall conformation freedom of the peptide was found to be affected by the interaction with the membrane, in accordance with previous results using different methodologies. Analysis of the interactions between the N-terminus amine group of the peptide and several lipid atoms shows that the membrane is able to stabilize both ionized and neutral forms of kyotorphin, resulting in a pKa value that is similar to the one obtained in water. This illustrates how a detailed molecular model of the membrane leads to rather different results than would be expected from simply regarding it as a low-dielectric slab.


Figures

Figure 1
Figure 1
Abundance of CβTyr-CαTyr-CαArg-CβArg dihedral angle of KTP versus pH in water (A) and membrane (B). Dihedral angle values >−70° and <100° are considered cis and the rest trans. To see this figure in color, go online.
Figure 2
Figure 2
χ1 torsion angle of tyrosine in water (W) and membrane (M) at pH 6 (blue) and pH 9 (yellow). To see this figure in color, go online.
Figure 3
Figure 3
Fit of the 56 best structures of KTP (lines) to morphine (sticks) obtained from water (A) and membrane (B) simulations. Carbon atoms are depicted in white, oxygen atoms in red, and nitrogen atoms in blue. To see this figure in color, go online.
Figure 4
Figure 4
Total titration curves of KTP (A) and titration curves of individual KTP sites in water and membrane systems (B). To see this figure in color, go online.
Figure 5
Figure 5
Distance between the four titratable groups of KTP, measured using the z coordinates of the four atoms shown in the key, and the average z coordinate of the phosphorous atoms of the closest monolayer (A and C) and a snapshot (B and D) taken during the time represented by the area highlighted in gray in the plot. The first plot, and corresponding snapshot (A and B), occurred in one of the replicates at pH = 9, and depicts an internalized arginine residue. The second plot and snapshot (C and D) occurred at pH = 10 and depicts both side chains internalized. KTP is shown as colored spheres, water molecules are shown as gray and red spheres, and phosphorous atoms are shown in orange. Lipid tails are hidden for clarity. To see this figure in color, go online.
Figure 6
Figure 6
Mean distance between the four titratable groups of KTP and the lipid bilayer at different pH values, with corresponding errors of the mean. The zero is defined as the average z-axis position of the phosphorous atoms of the monolayer that is closest to the peptide. The dotted line represents the average position of the choline nitrogen atom. To see this figure in color, go online.
Figure 7
Figure 7
Snapshots taken during the simulations (A) show the N-terminus interacting with the carbonyl or phosphate oxygen atoms of the closest DMCP molecules in ionized and neutral KTP, respectively. RDF plots (B and C) between the N-terminus amine group of KTP and the DMPC carbonyl oxygen atoms (B) and the phosphate group oxygen atoms (C) at several pH values. To see this figure in color, go online.

Similar articles

Cited by

References

    1. Berg J.M., Tymoczko J.L., Stryer L. W. H. Freeman; San Francisco, CA: 2002. Biochemistry, Fifth Edition: International Version.
    1. Alexov E., Mehler E.L., Word J.M. Progress in the prediction of pKa values in proteins. Proteins. 2011;79:3260–3275. - PMC - PubMed
    1. Machuqueiro M., Baptista A.M. Acidic range titration of HEWL using a constant-pH molecular dynamics method. Proteins. 2008;72:289–298. - PubMed
    1. Machuqueiro M., Baptista A.M. Molecular dynamics at constant pH and reduction potential: application to cytochrome c(3) J. Am. Chem. Soc. 2009;131:12586–12594. - PubMed
    1. Machuqueiro M., Campos S.R.R., Baptista A.M. Membrane-induced conformational changes of kyotorphin revealed by molecular dynamics simulations. J. Phys. Chem. B. 2010;114:11659–11667. - PubMed

Publication types

MeSH terms

LinkOut - more resources