. 2015 May 5;108(9):2340-9.
doi: 10.1016/j.bpj.2015.03.025.

Direct Sensing and Discrimination among Ubiquitin and Ubiquitin Chains Using Solid-State Nanopores

Affiliations

Direct Sensing and Discrimination among Ubiquitin and Ubiquitin Chains Using Solid-State Nanopores

Iftach Nir et al. Biophys J. .

Abstract

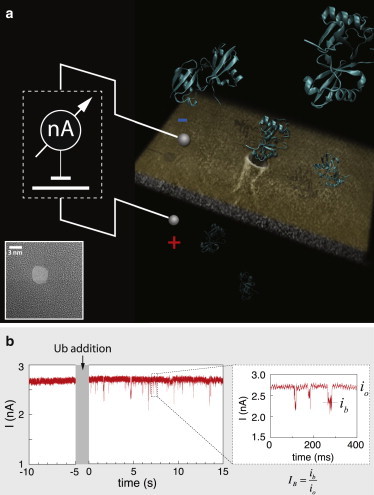
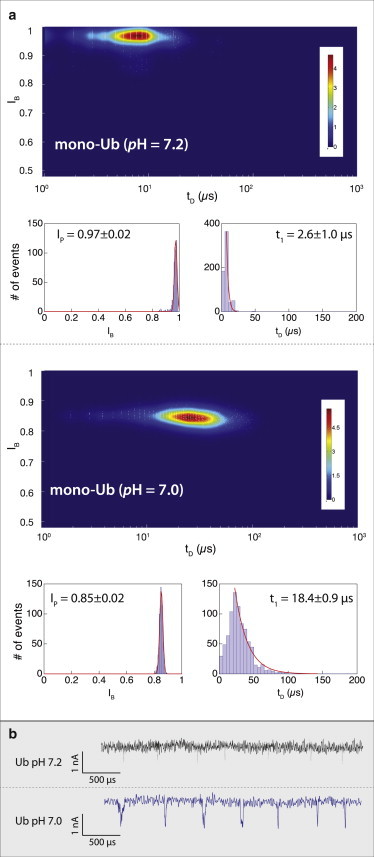
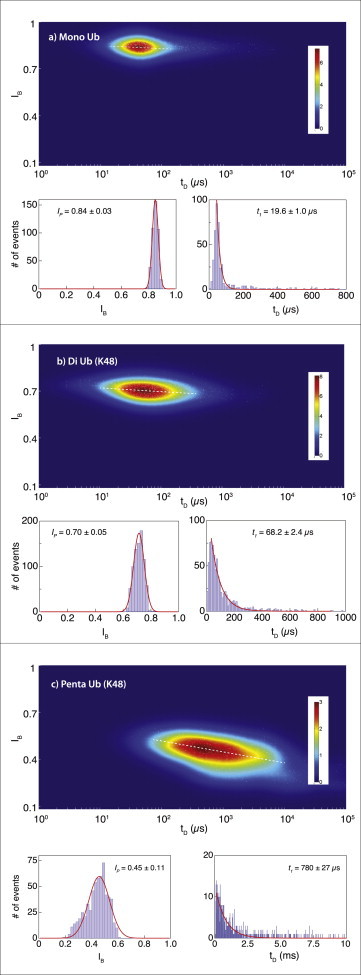
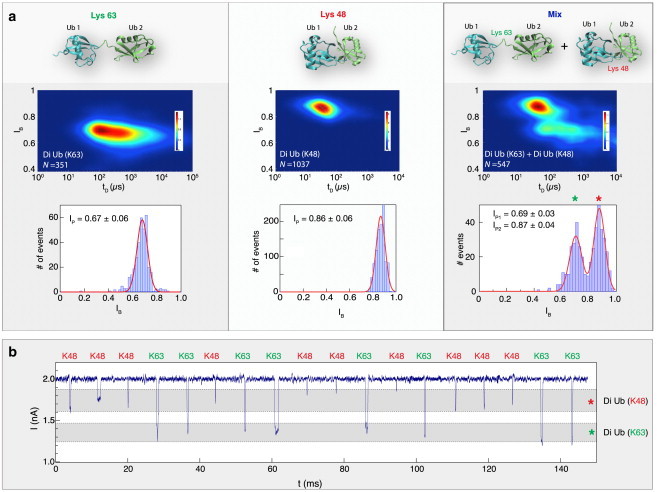
Nanopore sensing involves an electrophoretic transport of analytes through a nanoscale pore, permitting label-free sensing at the single-molecule level. However, to date, the detection of individual small proteins has been challenging, primarily due to the poor signal/noise ratio that these molecules produce during passage through the pore. Here, we show that fine adjustment of the buffer pH, close to the isoelectric point, can be used to slow down the translocation speed of the analytes, hence permitting sensing and characterization of small globular proteins. Ubiquitin (Ub) is a small protein of 8.5 kDa, which is well conserved in all eukaryotes. Ub conjugates to proteins as a posttranslational modification called ubiquitination. The immense diversity of Ub substrates, as well as the complexity of Ub modification types and the numerous physiological consequences of these modifications, make Ub and Ub chains an interesting and challenging subject of study. The ability to detect Ub and to identify Ub linkage type at the single-molecule level may provide a novel tool for investigation in the Ub field. This is especially adequate because, for most ubiquitinated substrates, Ub modifies only a few molecules in the cell at a given time. Applying our method to the detection of mono- and poly-Ub molecules, we show that we can analyze their characteristics using nanopores. Of particular importance is that two Ub dimers that are equal in molecular weight but differ in 3D structure due to their different linkage types can be readily discriminated. Thus, to our knowledge, our method offers a novel approach for analyzing proteins in unprecedented detail using solid-state nanopores. Specifically, it provides the basis for development of single-molecule sensing of differently ubiquitinated substrates with different biological significance. Finally, our study serves as a proof of concept for approaching nanopore detection of sub-10-kDa proteins and demonstrates the ability of this method to differentiate among native and untethered proteins of the same mass.


Figures

Figure 1
Figure 1
Schematic diagram of the experimental system and sample ion-current trace before and after addition of Ub molecules. (a) Solid-state NPs of ∼3.5 nm are used as single-molecule sensors for Ub and Ub chains (see inset for a typical TEM image). The passage of di-Ub molecules through the NP is illustrated. (b) NP current before (t < −5 s) and after (t > 0 s) addition of mono-Ub molecules to the cis chamber (V = 125 mV). (Inset) Enlargement of three translocation events, the open-pore (io) and the blocked-pore levels (ib). Current traces were digitally low-pass filtered (50 kHz) for display purpose only. To see this figure in color, go online.
Figure 2
Figure 2
Dependence of the translocation dynamics of mono-Ub through a solid-state NP at pH close to its isoelectric point. (a) Heat maps (IB versus tD) at pH 7.2 (upper) and pH 7.0 (lower), showing a substantial shift toward longer translocation times and deeper blockade levels for Ub at pH 7.0 (N > 500 for each case). Histograms of the IB and tD, shown beneath the heat maps, are fitted to Gaussian and exponential functions, respectively (red curves). (b) Representative sets of translocation events of mono-Ub measured using the same ∼3.5 nm pore at pH 7.2 (black) and pH 7.0 (blue). At pH 7.2, the event amplitudes and dwell times are bandwidth-limited, but at pH 7.0, both are well defined (n = 6 NPs). To see this figure in color, go online.
Figure 3
Figure 3
Translocation dynamics of mono- and multiunit Ub chains. Two-dimensional heat maps, blockade current, and dwell-time histograms for mono-Ub (a), di-Ub (K48-linked) (b), and penta-Ub (K48-linked) (c). Measurements were performed using the same NP to maximize consistency among the different molecules (n = 8 NPs). To see this figure in color, go online.
Figure 4
Figure 4
Single-molecule discrimination among the two forms of di-Ub molecules. (a) The expected equilibrium conformation of di-Ub linked by K63 (left), K48 (middle), or a mixture of the two (right). The structure cartoons were created using Visual Molecular Dynamics (53) based on Protein Data Bank structures 1AAR (12) and 2JF5 (54). Heat maps of the two different di-Ub conformers (measured using the same NP) show a distinct pattern for each dimer. The two molecules can be distinguished by their corresponding fractional current blockades shown below the heat maps. An experiment consisting of an equal molar ratio of both dimers yielded two populations in the heat maps, corresponding to two distinct Ip values. (b) Instantaneous discrimination among K63- and K48-linked di-Ubs. A collection of single-molecule events is shown (time between events was truncated to allow fitting of multiple events on the graph). Gray bands correspond to the two Ip (mean ± SD) values of the two dimers shown in (a) (n = 10 NPs). To see this figure in color, go online.
Figure 5
Figure 5
Monitoring a deubiquitination reaction using NPs. (a) USP8 was preincubated with di-Ub (K48) on ice before analysis by the NP. At t = 0, a single-event population can be seen, consistent with di-Ub (K48). Deubiquitination reactions were carried out at 37°C for 30 (b), 60 (c), 120 (d), and 240 min (e). The reaction was terminated by immediately freezing the samples using liquid nitrogen. Defrosted samples were analyzed using NPs and the distributions of IB values for the different time points are presented along their heat maps. All measurements were performed using a single NP to maximize consistency (n = 6 NPs). To see this figure in color, go online.
Figure 6
Figure 6
Comparison between deubiquitination reaction results quantified by NP analysis and by Coomassie-stained band intensity. (a) Product/substrate ratios of each deubiquitination time point are plotted against time. The fraction of mono- to di-Ub was calculated by integration under the fractional blocked current histogram (squares). Open circles represent gel quantification. (b) Mono-Ub (1.5 μg), di-Ub (K48) (1.5 μg), and samples from the deubiquitination reaction (described in Fig. 5 legend) were separated on 15% SDS-PAGE and stained with Coomassie.

Similar articles

Cited by

References

    1. Vijay-Kumar S., Bugg C.E., Cook W.J. Structure of ubiquitin refined at 1.8 A resolution. J. Mol. Biol. 1987;194:531–544. - PubMed
    1. Varshavsky A. The ubiquitin system. Trends Biochem. Sci. 1997;22:383–387. - PubMed
    1. Hershko A., Ciechanover A. The ubiquitin system. Annu. Rev. Biochem. 1998;67:425–479. - PubMed
    1. Komander D. The emerging complexity of protein ubiquitination. Biochem. Soc. Trans. 2009;37:937–953. - PubMed
    1. Komander D., Rape M. The ubiquitin code. Annu. Rev. Biochem. 2012;81:203–229. - PubMed

Publication types

MeSH terms

LinkOut - more resources