Comparative Study
. 2015 May 6;7(5):3279-99.
doi: 10.3390/nu7053279.

Phylum level change in the cecal and fecal gut communities of rats fed diets containing different fermentable substrates supports a role for nitrogen as a factor contributing to community structure

Affiliations
Comparative Study

Phylum level change in the cecal and fecal gut communities of rats fed diets containing different fermentable substrates supports a role for nitrogen as a factor contributing to community structure

Martin Kalmokoff et al. Nutrients. .

Abstract

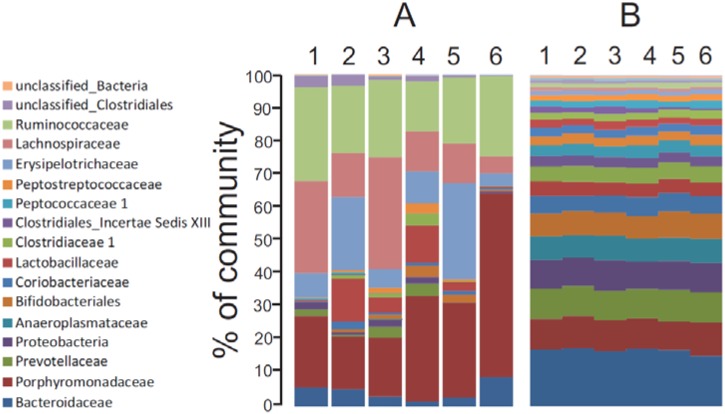
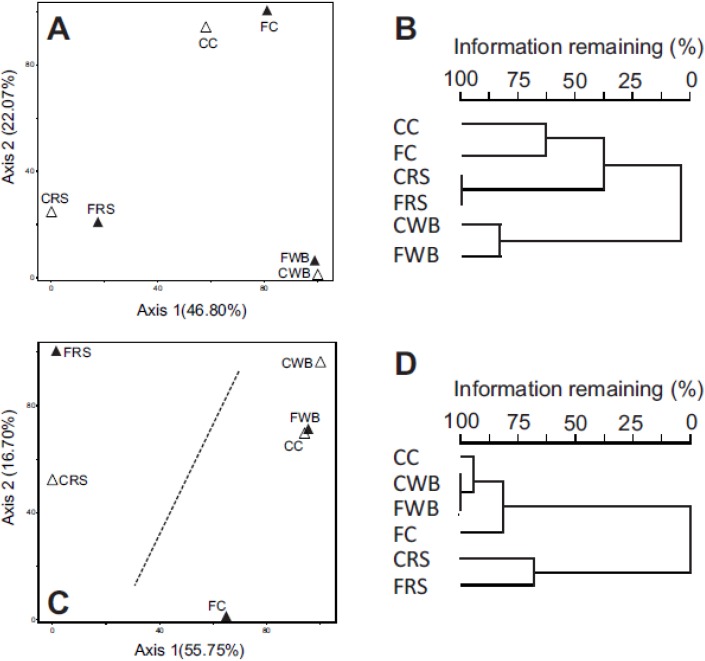
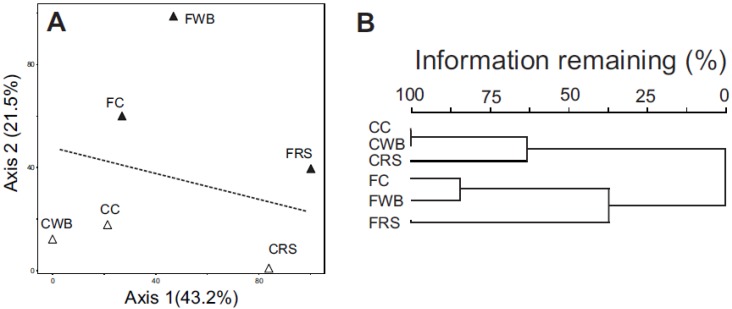
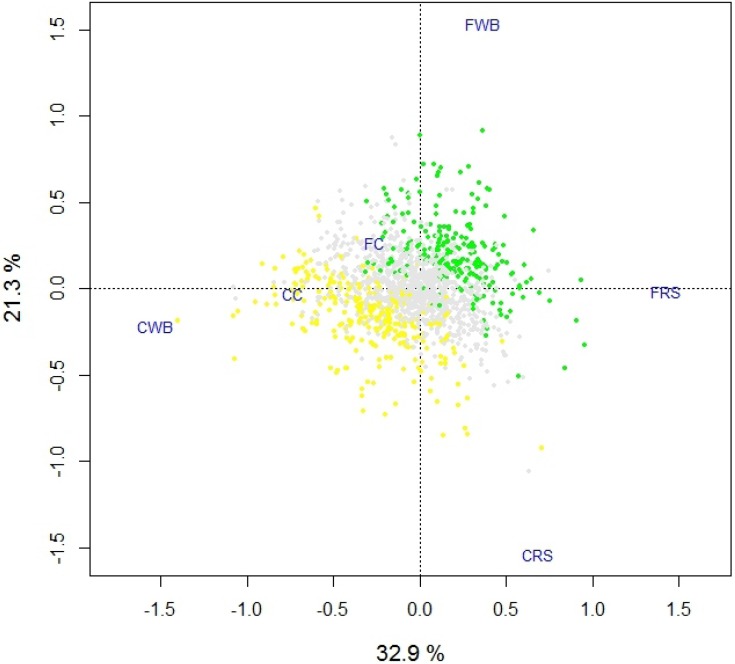
Fermentation differs between the proximal and distal gut but little is known regarding how the bacterial communities differ or how they are influenced by diet. In order to investigate this, we compared community diversity in the cecum and feces of rats by 16S rRNA gene content and DNA shot gun metagenomics after feeding purified diets containing different fermentable substrates. Gut community composition was dependent on the source of fermentable substrate included in the diet. Cecal communities were dominated by Firmicutes, and contained a higher abundance of Lachnospiraceae compared to feces. In feces, community structure was shifted by varying degrees depending on diet towards the Bacteroidetes, although this change was not always evident from 16S rRNA gene data. Multi-dimensional scaling analysis (PCoA) comparing cecal and fecal metagenomes grouped by location within the gut rather than by diet, suggesting that factors in addition to substrate were important for community change in the distal gut. Differentially abundant genes in each environment supported this shift away from the Firmicutes in the cecum (e.g., motility) towards the Bacteroidetes in feces (e.g., Bacteroidales transposons). We suggest that this phylum level change reflects a shift to ammonia as the primary source of nitrogen used to support continued microbial growth in the distal gut.


Figures

Figure 1
Figure 1
(A) Distribution of phylotypes (% of total) at the family taxon level in the fecal and cecal communities of rats fed each diet. Family taxa are identified on the left of panel A. The phylum Proteobacteria encompasses the families Desulfovibrionaceae, Helicobacteraceae, Sutterellaceae, Pasteurellaceae and unclassified “Proteobacteria”; (B) Distribution of gene assignments among the 26 identified SEED families (% of total). SEED families in ascending order are Carbohydrates, Virulence, Protein Metabolism, DNA Metabolism, Cell Wall and Capsule, Amino Acids and Derivatives, RNA Metabolism, Clustering Based Subsystems, Cofactors and Vitamins, Cell Division and Cell Cycle, Nucleosides and Nucleotides, Respiration, Stress Response, Regulation and Cell Signaling, Fatty Acids, Motility and Chemotaxis, Phages and Transposons, Membrane Transport, Phosphorus Metabolism, Dormancy and Sporulation, Nitrogen Metabolism, Miscellaneous, Sulfur Metabolism, Metabolism of Aromatic Compounds, Secondary Metabolism, and Potassium Metabolism. Lane 1: C cecal community. Lane 2: C fecal community. Lane 3: WB cecal community. Lane 4: WB fecal community. Lane 5: RS cecal community. Lane 6: RS fecal community.
Figure 2
Figure 2
Multi-dimensional scaling (MDS) analysis using principle coordinates (PCoA) and cluster analysis of phylotype composition (presence/absence) and diversity (phylotype presence and abundance) in the cecal (Δ) and fecal (▲) communities of rats fed each diet. (A) MDS comparing phylotype content under each diet. p = 0.001, r2 = 0.813; (B) Cluster analysis comparing phylotype content under each diet; (C) MDS comparing diversity under each diet. p = 0.001, r2 = 0.960; (D) Cluster analysis comparing diversity under each diet. CC: cecal cellulose. FC: fecal cellulose. CWB: cecal wheat bran. FWB: fecal wheat bran. CRS: cecal resistant starch. FRS: fecal resistant starch.
Figure 3
Figure 3
(A) MDS (PCoA) analysis of SEED gene assignments in the cecal (Δ) and fecal (▲) communities of rats fed each diet. Ordination plot was calculated using Euclidian distances and with resampling 1000 times. Axis 1: 43.2% of data variability, R2 = 0.746, p = 0.0009. Axis 2: 21.5% of data variability, R2 = 0.848, p = 0.0009; (B) Cluster analysis of SEED gene assignments. CC: cecal cellulose. FC: fecal cellulose. CWB: cecal wheat bran. FWB: fecal wheat bran. CRS: cecal resistant starch. FRS: fecal resistant starch.
Figure 4
Figure 4
Biplot (PCA) showing the ordinal location for each SEED gene assignment (Supplementary Table 2) and their relationship to each community. SEED gene assignments having >50% increase in abundance in the fecal or cecal communities are indicated (green and yellow points respectively), all others are indicated in grey. CC: cecal cellulose. FC: fecal cellulose. CWB: cecal wheat bran. FWB: fecal wheat bran. CRS: cecal resistant starch. FRS: fecal resistant starch.

Similar articles

Cited by

References

    1. Walker A.W., Ince J., Duncan S.H., Webster L.M., Holtrop G., Ze X., Brown D., Stares M.D., Scott P., Bergerat A., et al. Dominant and diet-responsive groups of bacteria within the human colonic microbiota. ISME J. 2011;5:220–230. doi: 10.1038/ismej.2010.118. - DOI - PMC - PubMed
    1. Abnous K., Brooks S.P., Kwan J., Matias F., Green-Johnson J., Selinger L.B., Thomas M., Kalmokoff M. Diets enriched in oat bran or wheat bran temporally and differentially alter the composition of the fecal community of rats. J. Nutr. 2009;139:2024–2031. doi: 10.3945/jn.109.109470. - DOI - PubMed
    1. Swanson K.S., Dowd S.E., Suchodolski J.S., Middelbos I.S., Vester B.M., Barry K.A., Nelson K.E., Torralba M., Henrissat B., Coutinho P.M., et al. Phylogenetic and gene-centric metagenomics of the canine intestinal microbiome reveals similarities with humans and mice. ISME J. 2011;5:639–649. doi: 10.1038/ismej.2010.162. - DOI - PMC - PubMed
    1. Hildebrandt M.A., Hoffmann C., Sherrill-Mix S.A., Keilbaugh S.A., Hamady M., Chen Y.Y., Knight R., Ahima R.S., Bushman F., Wu G.D. High-fat diet determines the composition of the murine gut microbiome independently of obesity. Gastroenterology. 2009;137:1716–1724.e2. doi: 10.1053/j.gastro.2009.08.042. - DOI - PMC - PubMed
    1. David L.A., Maurice C.F., Carmody R.N., Gootenberg D.B., Button J.E., Wolfe B.E., Ling A.V., Devlin A.S., Varma Y., Fischbach M.A., et al. Diet rapidly and reproducibly alters the human gut microbiome. Nature. 2014;505:559–563. doi: 10.1038/nature12820. - DOI - PMC - PubMed

Publication types

MeSH terms