. 2015 May 8;10(5):e0123611.
doi: 10.1371/journal.pone.0123611. eCollection 2015.

A mathematical model to elucidate brain tumor abrogation by immunotherapy with T11 target structure

Affiliations

A mathematical model to elucidate brain tumor abrogation by immunotherapy with T11 target structure

Sandip Banerjee et al. PLoS One. .

Abstract

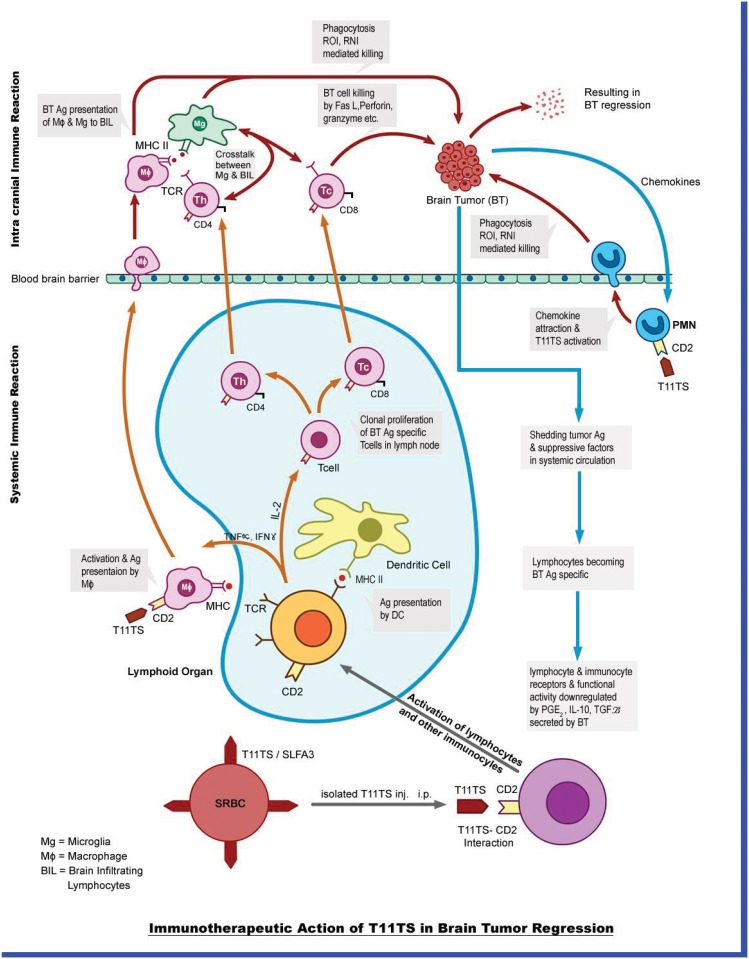
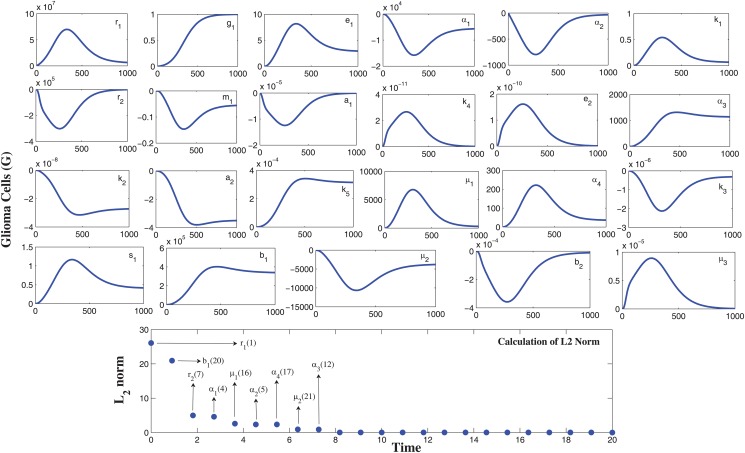
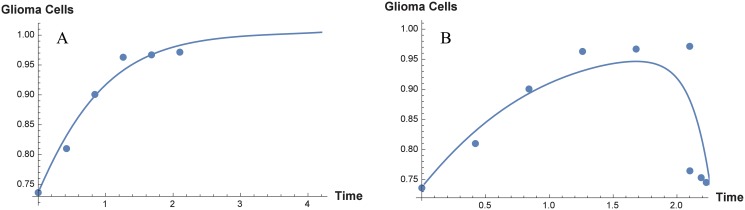
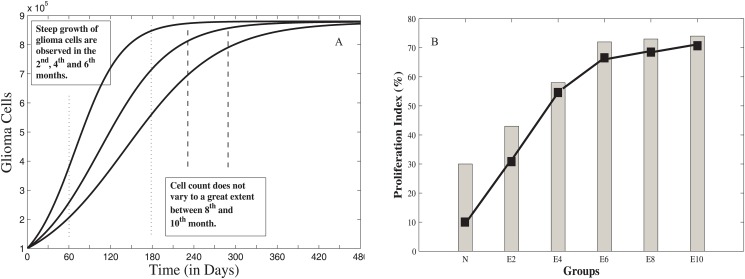
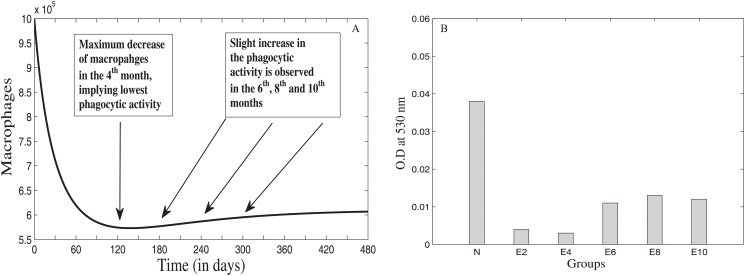
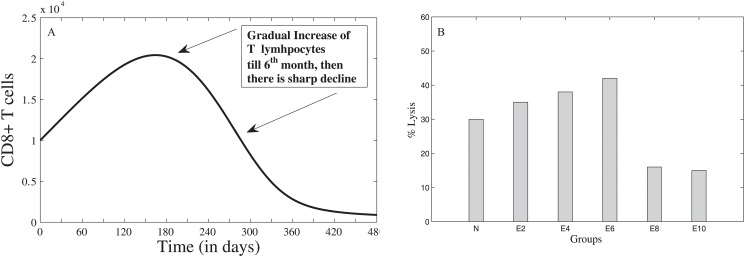
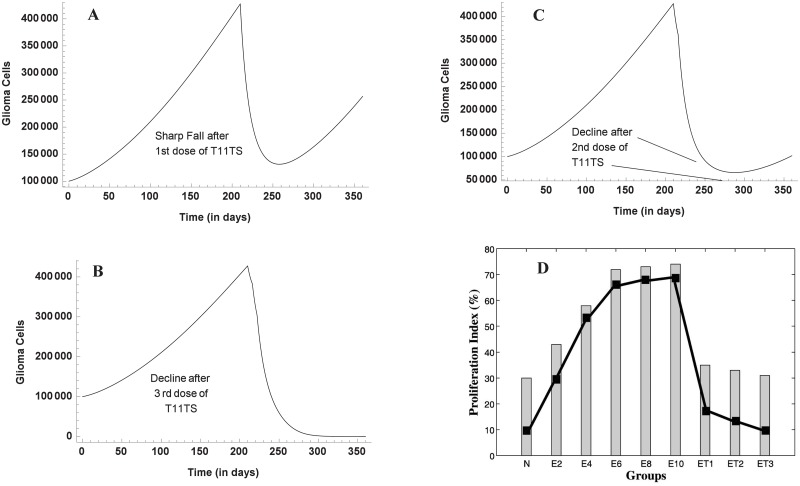
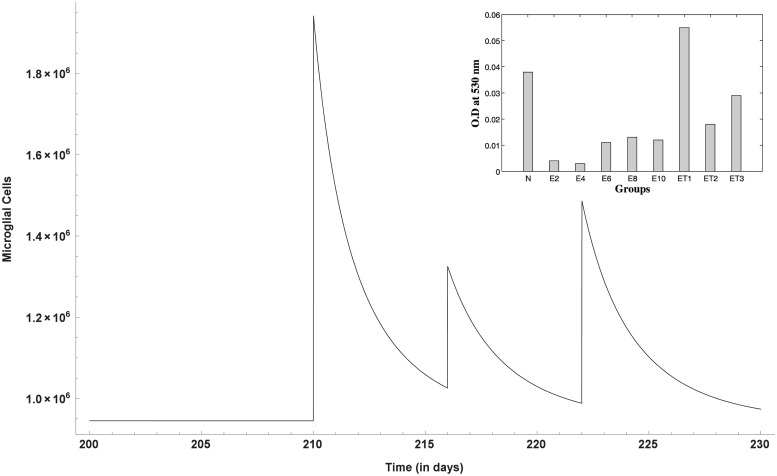
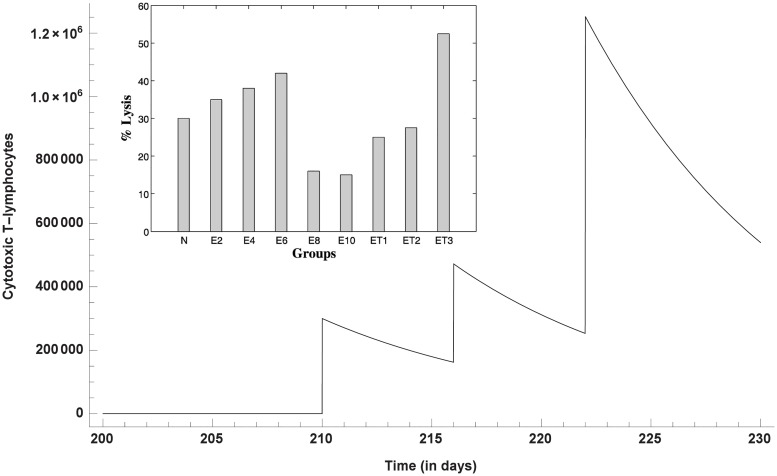
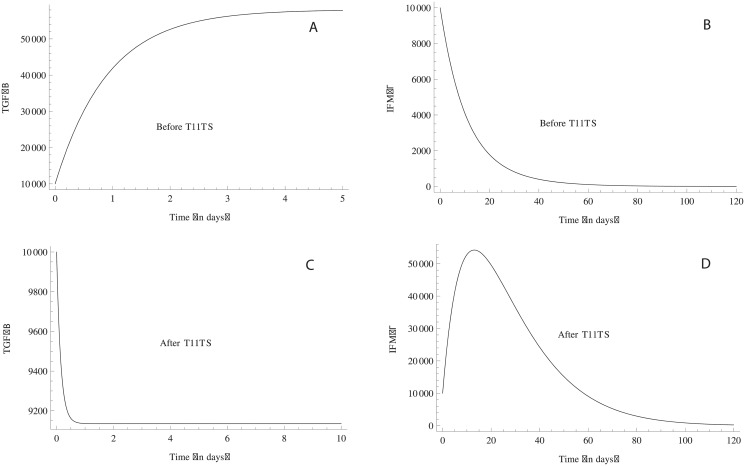
T11 Target structure (T11TS), a membrane glycoprotein isolated from sheep erythrocytes, reverses the immune suppressed state of brain tumor induced animals by boosting the functional status of the immune cells. This study aims at aiding in the design of more efficacious brain tumor therapies with T11 target structure. We propose a mathematical model for brain tumor (glioma) and the immune system interactions, which aims in designing efficacious brain tumor therapy. The model encompasses considerations of the interactive dynamics of glioma cells, macrophages, cytotoxic T-lymphocytes (CD8(+) T-cells), TGF-β, IFN-γ and the T11TS. The system undergoes sensitivity analysis, that determines which state variables are sensitive to the given parameters and the parameters are estimated from the published data. Computer simulations were used for model verification and validation, which highlight the importance of T11 target structure in brain tumor therapy.


Conflict of interest statement

Competing Interests: The authors have declared that no competing interests exist.

Figures

Fig 1
Fig 1. Schematic diagram.
The figure shows the dynamics between brain tumor and the immune components, namely, macrophage, microglia, CD4+ T cells, CD8+ T cells, dendritic cells, TGF-β, IFN-γ and the immunotherapeutic agent T11 target structure.
Fig 2
Fig 2. Relative sensitivities of the parameters using automatic differentiation.
From the top panel figures, it is observed that the parameters r 1, α 1, α 2, r 2, α 3, μ 1, α 4, b 1, μ 2 are sensitive with respect to the malignant glioma cells. The observation window is [0, 1000] and the sensitivity of a parameter is identified by the maximum deviation of the state variable (along y-axis) and it also identifies the time intervals when the system is most sensitive to such changes. The bottom panel gives the sensitivity quantification by calculating sensitivity coefficient through L 2 norm.
Fig 3
Fig 3. System parameter estimation by the method of least squares.
Six data points are used to estimate the parameters r 1 (glioma growth rate) and G max (carrying capacity) in absence of immune system. The left panel A shows the best fit curve for the estimation of the parameters r 1 and G max. The parameters r 2, a 2, α 1, α 3, α 4 and k 5 are estimated by using nine data points obtained during immunotherapy by T11TS, the right panel B showing the curve of best fit.
Fig 4
Fig 4. Glioma cell dynamics without T11 target structure (T11TS).
The left panel A shows the growth of malignant glioma from model simulation and the right panel B gives the experimental data showing glioma cell proliferation index (N to E10).
Fig 5
Fig 5. Dynamics of Macrophages before T11 target structure (T11TS) administration.
The left panel A gives the model simulation showing the decrease in the cell count of macrophages and hence in its phagocytic activity. The right panel B gives the experimental data showing phagocytic activity of macrophages (N to E10).
Fig 6
Fig 6. Dynamics of CD8+ T cells before administration of T11TS.
The left panel A gives the model simulation showing the attempt and failure of CD8+ T cells to counter-attack the malignant glioma cells. The right panel B gives the experimental data showing the decrease in cytotoxic efficacy (N to E10) of CD8+ T cells.
Fig 7
Fig 7. Malignant glioma dynamics after the doses of T11 target structure.
Through model simulation, the three figures (A,B,C) show the behavior of malignant glioma cells after the (A) first dose (B) second dose (C) third dose of T11TS, the first being administered in the 7th month (210th day), followed by the other two at an interval of 6 days. The fourth figure (D) shows the experimental data of proliferation index of glioma cells after T11TS administration (N to ET3).
Fig 8
Fig 8. Macrophage stimulation increases with the doses of T11TS.
Model simulation shows significant stimulation of macrophages after the first dose, when compared with the next two doses. The inset figure represents the experimental data showing increase in phagocytic activity of macrophages.
Fig 9
Fig 9. Dynamics of CD8+ T-cells after the administration of T11 target structure.
Optimal increase in the cell count and therefore efficacy of CD8+ T cells is observed after the 3rd dose of T11TS. The inset figure shows the experimental data of cytotoxic efficacy.
Fig 10
Fig 10. Dynamics of TGF–β and IFN–γ.
Before the administration of T11TS, TGF–β, the immunosuppressive agent, suppresses the activation and proliferation of immune components with its increase (Fig. A) whereas IFN–γ degrades in 2 months, pointing out its failure to activate the immune system (Fig. B). However, after the doses of T11TS, TGF–β decreases and immunostimulatory effect of IFN–γ increases (Fig. C and Fig. D).

References

    1. Laperriere N, Zuraw L, Cairncross G. Radiotherapy for newly diagnosed malignant glioma in adults: a systematic review. Radiother Oncol. 2002; 64: 259–273. 10.1016/S0167-8140(02)00078-6 - DOI - PubMed
    1. Kleihues P, Soylemazoglu F, Schäuble B, Schniethauer BW, Bruger PC. Histopathology, classification and grading of gliomas. Glia. 1995; 15: 211–221. 10.1002/glia.440150303 - DOI - PubMed
    1. Kleihues P, Louis DN, Scheithauer BW, Rorke LB, Reifenberger G, Burger PC, et al. The WHO classification of tumors of the nervous system. J Neuropathol Exp Neurol. 2002; 61: 215–225. - PubMed
    1. Swanson KR, Alvord EC Jr, Murray JD. A quantitative model for differential motility of gliomas in grey and white matter. Cell Prolif. 2000; 33: 317–329. 10.1046/j.1365-2184.2000.00177.x - DOI - PMC - PubMed
    1. Swanson KR, Alvord EC Jr, Murray JD. Virtual brain tumors (gliomas) enhance the reality of medical imaging and highlights inadequacies of current therapy. Br J Cancer. 2002; 86(1): 14–18. 10.1038/sj.bjc.6600021 - DOI - PMC - PubMed

Publication types

MeSH terms

Substances